


Key Insights
Lithuania's e-commerce market is projected for robust expansion, exhibiting a Compound Annual Growth Rate (CAGR) of 15.46% from 2025 to 2033. This growth is propelled by increasing internet and smartphone penetration, rising disposable incomes, and a strong consumer preference for online shopping convenience. The market encompasses diverse segments, including fashion, electronics, and groceries, with key players such as Shopify, Amazon, Senukai, and Pigu driving competition and innovation. The market size is estimated at 3.18 billion in the base year of 2025. Improvements in logistics and delivery infrastructure are supporting this expansion, though cybersecurity and data privacy remain critical considerations for maintaining consumer trust.
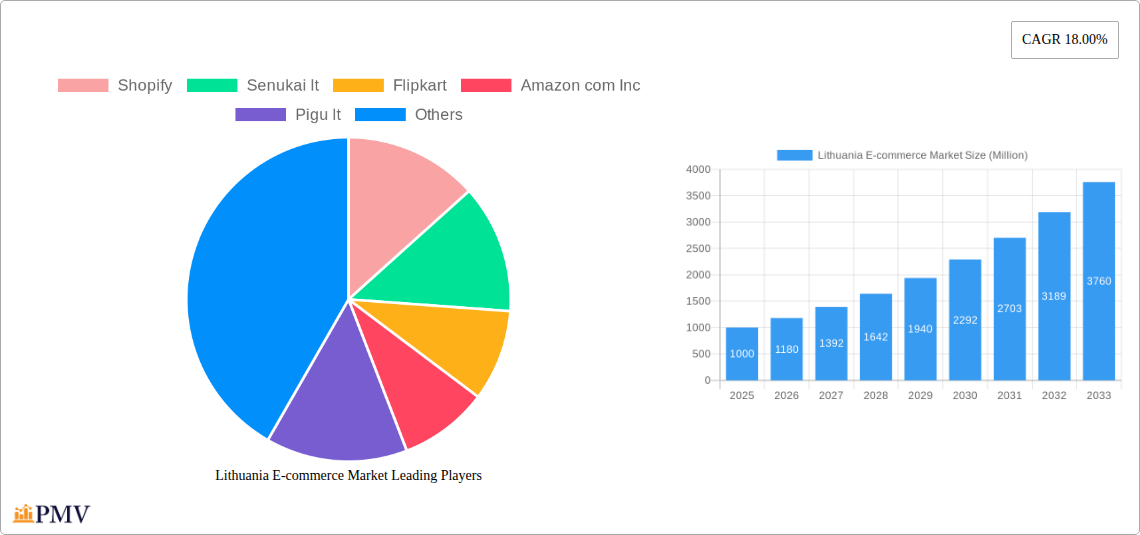
Lithuania E-commerce Market Market Size (In Billion)

Sustained growth in the Lithuanian e-commerce sector will be influenced by government digitalization initiatives, digital infrastructure investments, and advancements in payment systems and customer-centric platforms. The competitive landscape ensures price competitiveness and a wide array of product offerings for consumers. Addressing potential challenges while leveraging digital transformation positions the Lithuanian e-commerce market for significant economic impact over the next decade.

Lithuania E-commerce Market Company Market Share
Lithuania E-commerce Market: 2019-2033 Report
This comprehensive report provides an in-depth analysis of the Lithuania e-commerce market, covering the period 2019-2033. It offers valuable insights into market structure, competitive dynamics, industry trends, growth drivers, and challenges, equipping businesses with the knowledge to navigate this dynamic sector. The report utilizes data from the historical period (2019-2024), the base year (2025), and projects the market's trajectory through the forecast period (2025-2033). Market values are expressed in Millions.
Lithuania E-commerce Market Market Structure & Competitive Dynamics
The Lithuanian e-commerce market exhibits a moderately concentrated structure, with a few dominant players like Senukai.lt and Pigu.lt holding significant market share. However, the market also features numerous smaller players and emerging startups, leading to a dynamic competitive landscape. Innovation is driven by the adoption of advanced technologies such as AI-powered personalization and improved logistics. The regulatory framework is generally supportive of e-commerce growth, though ongoing developments in data privacy and consumer protection continue to shape the market. Product substitutes, primarily traditional brick-and-mortar retail, are facing increasing pressure from the convenience and expanding product selection offered online. End-user trends indicate a growing preference for mobile commerce and omnichannel shopping experiences. M&A activity has been moderate in recent years, with deal values averaging around XX Million. Key examples include [Insert example M&A deals if available, otherwise state "No significant M&A activity reported in recent years."]
- Market Concentration: Moderately concentrated, with a few major players dominating.
- Innovation Ecosystem: Active, driven by technological advancements and startup activity.
- Regulatory Framework: Supportive, with ongoing adjustments for data privacy and consumer protection.
- Product Substitutes: Traditional retail facing increasing competition.
- End-User Trends: Growing preference for mobile and omnichannel shopping.
- M&A Activity: Moderate, with average deal values of approximately XX Million.
Lithuania E-commerce Market Industry Trends & Insights
The Lithuanian e-commerce market demonstrates robust growth, driven by increasing internet and smartphone penetration, rising disposable incomes, and a growing preference for online shopping convenience. The Compound Annual Growth Rate (CAGR) during the historical period (2019-2024) is estimated at XX%, exceeding the regional average. Market penetration currently stands at approximately XX%, with significant potential for further growth. Technological disruptions, such as the rise of social commerce and the adoption of advanced payment solutions, continue to reshape the market. Consumer preferences are shifting towards personalized experiences, fast delivery options, and seamless omnichannel interactions. Intense competition among established players and new entrants fuels innovation and drives down prices, ultimately benefiting consumers.
Dominant Markets & Segments in Lithuania E-commerce Market
The Lithuanian e-commerce market demonstrates broad-based growth across various segments. While precise regional breakdown is not currently available, the Vilnius and Kaunas metropolitan areas are expected to contribute significantly, owing to higher internet penetration and disposable income. Key drivers for the dominance include robust infrastructure, supportive government policies for e-commerce development, and a tech-savvy population.
- Key Drivers of Dominance:
- Strong infrastructure (internet penetration, logistics)
- Supportive government policies
- Tech-savvy population
- High disposable income (in urban areas)
Lithuania E-commerce Market Product Innovations
Recent innovations in the Lithuanian e-commerce market focus on enhancing user experience and expanding product offerings. This includes the integration of AI-powered recommendation engines, improved mobile shopping apps, and the expansion of delivery options, such as same-day delivery and click-and-collect services. Technological advancements, such as blockchain technology for secure payments, also contribute to market innovations. These improvements aim to enhance customer satisfaction, build brand loyalty, and maintain a competitive edge in the increasingly crowded e-commerce market.
Report Segmentation & Scope
This report segments the Lithuania e-commerce market by application [Insert specific application segments here, based on provided data - if no data is given, add example segments such as "Fashion & Apparel," "Electronics & Appliances," "Grocery & Food," and "Other"]. Each segment's growth projections, market sizes, and competitive dynamics are detailed within the full report. For example, the "Fashion & Apparel" segment is expected to exhibit strong growth due to [Explain reason]. Similarly, the "Electronics & Appliances" segment is influenced by [Explain reason].
Key Drivers of Lithuania E-commerce Market Growth
Several factors drive the growth of the Lithuanian e-commerce market. Increasing internet penetration and smartphone usage provide broader access to online shopping. Rising disposable incomes enhance consumer spending power, while government initiatives promoting digitalization and e-commerce further stimulate market expansion. Convenient payment options, including digital wallets and online banking, have also facilitated increased online transactions.
Challenges in the Lithuania E-commerce Market Sector
Despite its potential, the Lithuanian e-commerce market faces challenges. Logistics infrastructure, particularly in rural areas, requires improvement to facilitate efficient deliveries. Competition, both domestic and international, remains intense, putting pressure on margins. Cybersecurity concerns and data privacy regulations also present significant hurdles for e-commerce businesses. These factors can impact the overall growth and profitability of the market.
Leading Players in the Lithuania E-commerce Market Market
- Shopify
- Senukai.lt
- Flipkart
- Amazon.com Inc
- Pigu.lt
- Flatlogic
- Kosmada.lt
- BigCommerce
- Parduotuvevaikams.lt
- Apple Inc
Key Developments in Lithuania E-commerce Market Sector
- May 2022: RippleNet's On-Demand Liquidity (ODL) partners with FINCI, a Lithuanian international money transfer provider, to enable instant and cost-effective cross-border payments. This development significantly improves the efficiency and reduces the cost of international transactions, fostering growth in cross-border e-commerce.
Strategic Lithuania E-commerce Market Market Outlook
The Lithuanian e-commerce market presents significant growth opportunities over the forecast period. Continued expansion of internet and mobile penetration, coupled with rising disposable incomes, will drive substantial market expansion. Strategic investments in logistics infrastructure and technological innovation, alongside supportive government policies, will further accelerate growth. Companies can leverage these opportunities by focusing on personalized customer experiences, efficient logistics, and secure payment gateways. The market's potential is further enhanced by the increasing adoption of mobile commerce and omnichannel strategies.
Lithuania E-commerce Market Segmentation
-
1. Type
- 1.1. B2C E-commerce
- 1.2. B2B E-commerce
Lithuania E-commerce Market Segmentation By Geography
- 1. Lithuania
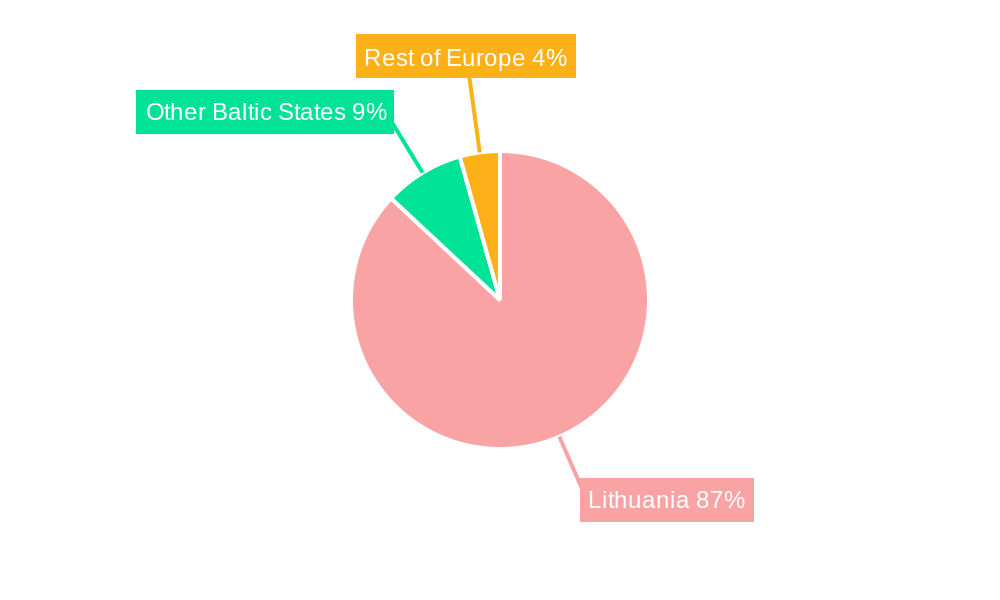
Lithuania E-commerce Market Regional Market Share
Geographic Coverage of Lithuania E-commerce Market
Lithuania E-commerce Market REPORT HIGHLIGHTS
| Aspects | Details |
|---|---|
| Study Period | 2020-2034 |
| Base Year | 2025 |
| Estimated Year | 2026 |
| Forecast Period | 2026-2034 |
| Historical Period | 2020-2025 |
| Growth Rate | CAGR of 15.46% from 2020-2034 |
| Segmentation |
|
Table of Contents
- 1. Introduction
- 1.1. Research Scope
- 1.2. Market Segmentation
- 1.3. Research Methodology
- 1.4. Definitions and Assumptions
- 2. Executive Summary
- 2.1. Introduction
- 3. Market Dynamics
- 3.1. Introduction
- 3.2. Market Drivers
- 3.2.1. Increase developments of 5G Technology; Increased Adoption of Smartphones
- 3.3. Market Restrains
- 3.3.1. Growing Threat of Video Content Piracy
- 3.4. Market Trends
- 3.4.1. 5G Services May Drive the Market
- 4. Market Factor Analysis
- 4.1. Porters Five Forces
- 4.2. Supply/Value Chain
- 4.3. PESTEL analysis
- 4.4. Market Entropy
- 4.5. Patent/Trademark Analysis
- 5. Lithuania E-commerce Market Analysis, Insights and Forecast, 2020-2032
- 5.1. Market Analysis, Insights and Forecast - by Type
- 5.1.1. B2C E-commerce
- 5.1.2. B2B E-commerce
- 5.2. Market Analysis, Insights and Forecast - by Region
- 5.2.1. Lithuania
- 5.1. Market Analysis, Insights and Forecast - by Type
- 6. Competitive Analysis
- 6.1. Market Share Analysis 2025
- 6.2. Company Profiles
- 6.2.1 Shopify
- 6.2.1.1. Overview
- 6.2.1.2. Products
- 6.2.1.3. SWOT Analysis
- 6.2.1.4. Recent Developments
- 6.2.1.5. Financials (Based on Availability)
- 6.2.2 Senukai lt
- 6.2.2.1. Overview
- 6.2.2.2. Products
- 6.2.2.3. SWOT Analysis
- 6.2.2.4. Recent Developments
- 6.2.2.5. Financials (Based on Availability)
- 6.2.3 Flipkart
- 6.2.3.1. Overview
- 6.2.3.2. Products
- 6.2.3.3. SWOT Analysis
- 6.2.3.4. Recent Developments
- 6.2.3.5. Financials (Based on Availability)
- 6.2.4 Amazon com Inc
- 6.2.4.1. Overview
- 6.2.4.2. Products
- 6.2.4.3. SWOT Analysis
- 6.2.4.4. Recent Developments
- 6.2.4.5. Financials (Based on Availability)
- 6.2.5 Pigu lt
- 6.2.5.1. Overview
- 6.2.5.2. Products
- 6.2.5.3. SWOT Analysis
- 6.2.5.4. Recent Developments
- 6.2.5.5. Financials (Based on Availability)
- 6.2.6 Flatlogic
- 6.2.6.1. Overview
- 6.2.6.2. Products
- 6.2.6.3. SWOT Analysis
- 6.2.6.4. Recent Developments
- 6.2.6.5. Financials (Based on Availability)
- 6.2.7 Kosmada lt
- 6.2.7.1. Overview
- 6.2.7.2. Products
- 6.2.7.3. SWOT Analysis
- 6.2.7.4. Recent Developments
- 6.2.7.5. Financials (Based on Availability)
- 6.2.8 BigCommerce
- 6.2.8.1. Overview
- 6.2.8.2. Products
- 6.2.8.3. SWOT Analysis
- 6.2.8.4. Recent Developments
- 6.2.8.5. Financials (Based on Availability)
- 6.2.9 Parduotuvevaikams lt
- 6.2.9.1. Overview
- 6.2.9.2. Products
- 6.2.9.3. SWOT Analysis
- 6.2.9.4. Recent Developments
- 6.2.9.5. Financials (Based on Availability)
- 6.2.10 Apple Inc
- 6.2.10.1. Overview
- 6.2.10.2. Products
- 6.2.10.3. SWOT Analysis
- 6.2.10.4. Recent Developments
- 6.2.10.5. Financials (Based on Availability)
- 6.2.1 Shopify
List of Figures
- Figure 1: Lithuania E-commerce Market Revenue Breakdown (billion, %) by Product 2025 & 2033
- Figure 2: Lithuania E-commerce Market Share (%) by Company 2025
List of Tables
- Table 1: Lithuania E-commerce Market Revenue billion Forecast, by Type 2020 & 2033
- Table 2: Lithuania E-commerce Market Volume K Unit Forecast, by Type 2020 & 2033
- Table 3: Lithuania E-commerce Market Revenue billion Forecast, by Region 2020 & 2033
- Table 4: Lithuania E-commerce Market Volume K Unit Forecast, by Region 2020 & 2033
- Table 5: Lithuania E-commerce Market Revenue billion Forecast, by Type 2020 & 2033
- Table 6: Lithuania E-commerce Market Volume K Unit Forecast, by Type 2020 & 2033
- Table 7: Lithuania E-commerce Market Revenue billion Forecast, by Country 2020 & 2033
- Table 8: Lithuania E-commerce Market Volume K Unit Forecast, by Country 2020 & 2033
Frequently Asked Questions
1. What is the projected Compound Annual Growth Rate (CAGR) of the Lithuania E-commerce Market?
The projected CAGR is approximately 15.46%.
2. Which companies are prominent players in the Lithuania E-commerce Market?
Key companies in the market include Shopify, Senukai lt, Flipkart, Amazon com Inc, Pigu lt, Flatlogic, Kosmada lt, BigCommerce, Parduotuvevaikams lt, Apple Inc.
3. What are the main segments of the Lithuania E-commerce Market?
The market segments include Type .
4. Can you provide details about the market size?
The market size is estimated to be USD 3.18 billion as of 2022.
5. What are some drivers contributing to market growth?
Increase developments of 5G Technology; Increased Adoption of Smartphones.
6. What are the notable trends driving market growth?
5G Services May Drive the Market.
7. Are there any restraints impacting market growth?
Growing Threat of Video Content Piracy.
8. Can you provide examples of recent developments in the market?
May 2022 - RippleNet's On-Demand Liquidity (ODL), which leverages XRP for crypto-enabled cross border payments, has announced a partnership with FINCI, the Lithuanian online international money transfer provider, to deliver instant and cost-effective retail remittances and business to business (B2B) payments via RippleNet's On-Demand Liquidity (ODL).
9. What pricing options are available for accessing the report?
Pricing options include single-user, multi-user, and enterprise licenses priced at USD 3800, USD 4500, and USD 5800 respectively.
10. Is the market size provided in terms of value or volume?
The market size is provided in terms of value, measured in billion and volume, measured in K Unit.
11. Are there any specific market keywords associated with the report?
Yes, the market keyword associated with the report is "Lithuania E-commerce Market," which aids in identifying and referencing the specific market segment covered.
12. How do I determine which pricing option suits my needs best?
The pricing options vary based on user requirements and access needs. Individual users may opt for single-user licenses, while businesses requiring broader access may choose multi-user or enterprise licenses for cost-effective access to the report.
13. Are there any additional resources or data provided in the Lithuania E-commerce Market report?
While the report offers comprehensive insights, it's advisable to review the specific contents or supplementary materials provided to ascertain if additional resources or data are available.
14. How can I stay updated on further developments or reports in the Lithuania E-commerce Market?
To stay informed about further developments, trends, and reports in the Lithuania E-commerce Market, consider subscribing to industry newsletters, following relevant companies and organizations, or regularly checking reputable industry news sources and publications.
Methodology
Step 1 - Identification of Relevant Samples Size from Population Database


Step 2 - Approaches for Defining Global Market Size (Value, Volume* & Price*)

Note*: In applicable scenarios
Step 3 - Data Sources
Primary Research
- Web Analytics
- Survey Reports
- Research Institute
- Latest Research Reports
- Opinion Leaders
Secondary Research
- Annual Reports
- White Paper
- Latest Press Release
- Industry Association
- Paid Database
- Investor Presentations

Step 4 - Data Triangulation
Involves using different sources of information in order to increase the validity of a study
These sources are likely to be stakeholders in a program - participants, other researchers, program staff, other community members, and so on.
Then we put all data in single framework & apply various statistical tools to find out the dynamic on the market.
During the analysis stage, feedback from the stakeholder groups would be compared to determine areas of agreement as well as areas of divergence