
Key Insights
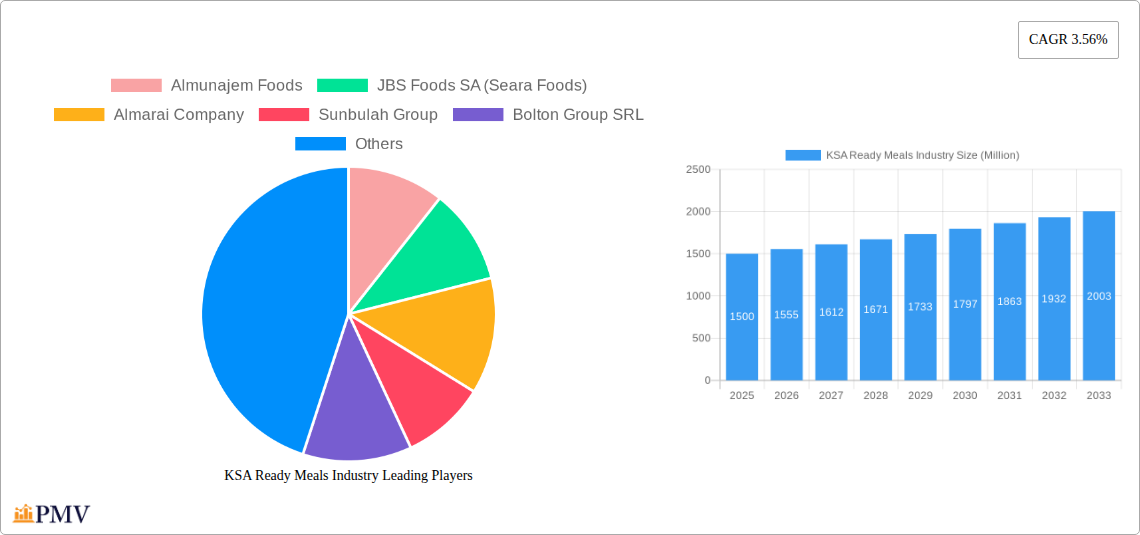
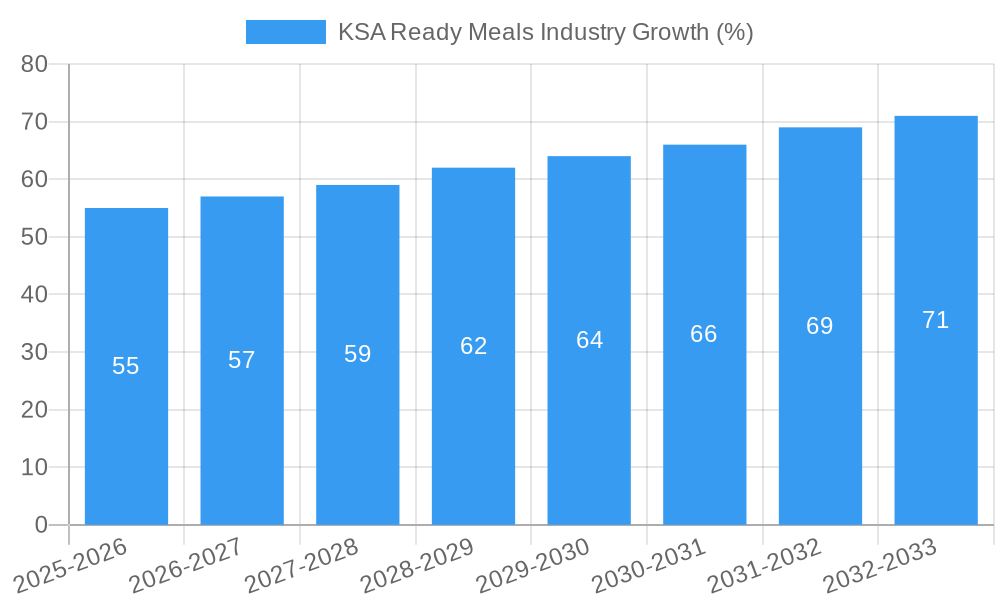
The KSA ready meals market, exhibiting a CAGR of 3.56%, presents a lucrative opportunity for food manufacturers and distributors. Driven by factors such as increasing urbanization, busy lifestyles, and a growing preference for convenience foods, the market is projected to experience significant growth throughout the forecast period (2025-2033). The diverse range of product types, including frozen, chilled, and ambient ready meals, caters to varying consumer needs and preferences. Hypermarkets and supermarkets dominate the distribution channels, although online retail stores are witnessing a surge in popularity, fueled by the expanding e-commerce sector in Saudi Arabia. Key players such as Almunajem Foods, JBS Foods SA (Seara Foods), and Almarai Company are shaping the market landscape through product innovation and strategic partnerships. Growth is further supported by the rising disposable incomes of the Saudi population, enabling higher spending on convenient food options. However, potential restraints include fluctuating raw material prices and the need to adapt offerings to comply with the ever-evolving dietary preferences and regulations within the country. The focus on healthy and Halal-compliant options is a significant trend driving innovation and shaping consumer choices. Given the demographic shifts and economic growth in KSA, the ready meals sector is poised for substantial expansion in the coming years.
The segmentation of the KSA ready meals market reveals key trends. The frozen ready meal segment currently holds a substantial share, due to its longer shelf life and convenience. However, the chilled ready meal segment is predicted to experience faster growth, driven by a rising demand for fresher, healthier options. The online retail channel is expanding its market presence, providing customers with greater accessibility to a broader range of ready meal choices. While hypermarkets and supermarkets remain the dominant distribution channel, their market share may slightly decrease as the online sector expands. Future growth will be influenced by the increasing penetration of e-commerce, the successful implementation of government initiatives to support food processing industries and a greater emphasis on meal customization and delivery services. The competitive landscape remains dynamic, with existing players constantly innovating and new entrants emerging to cater to the growing demand for diverse and convenient food solutions. A successful strategy will hinge on adapting to evolving consumer needs and preferences, adopting efficient distribution channels, and focusing on superior product quality and brand building.
This detailed report provides a comprehensive analysis of the Kingdom of Saudi Arabia (KSA) ready meals industry, offering invaluable insights for businesses, investors, and stakeholders. The report covers the period from 2019 to 2033, with a focus on 2025 as the base and estimated year. We analyze market size, segmentation, competitive dynamics, key players, and future growth potential, incorporating the latest industry developments. The KSA ready meals market, valued at xx Million USD in 2025, is projected to experience significant growth, reaching xx Million USD by 2033.
KSA Ready Meals Industry Market Structure & Competitive Dynamics
The KSA ready meals market exhibits a moderately concentrated structure, with several key players dominating various segments. Market share is influenced by brand recognition, distribution networks, and product innovation. The industry displays a dynamic competitive landscape characterized by mergers & acquisitions (M&A) activity, strategic partnerships, and new product launches. Regulatory frameworks, including food safety standards and labeling requirements, play a significant role in shaping the market. Consumer preferences, particularly towards healthier and more convenient options, are driving innovation and product diversification. The increasing adoption of online retail channels is also transforming the distribution landscape. Key M&A activities have involved investments totaling xx Million USD in the past five years, mostly focused on expanding production capacity and enhancing distribution networks.
- Market Concentration: Moderately concentrated, with top 5 players holding approximately xx% market share (2025).
- Innovation Ecosystems: Growing focus on healthier options, convenience, and diverse cuisines.
- Regulatory Frameworks: Stringent food safety and labeling regulations influencing product development.
- Product Substitutes: Home-cooked meals, restaurant dining, and other convenience foods.
- End-User Trends: Increasing demand for halal-certified, healthier, and convenient ready meals.
- M&A Activities: Significant investment in expansion of production and distribution, with deals totaling xx Million USD in the last 5 years.
KSA Ready Meals Industry Industry Trends & Insights
The KSA ready meals market is experiencing robust growth, driven by several key factors. The rising disposable incomes and changing lifestyles, particularly among young professionals and busy families, are fueling the demand for convenient meal solutions. The increasing adoption of online grocery shopping is expanding the reach of ready meals, while technological advancements in food processing and packaging are enhancing product quality and shelf life. The industry is witnessing a surge in the demand for healthier and more diverse ready-to-eat options, including vegetarian and vegan choices. The market is expected to exhibit a Compound Annual Growth Rate (CAGR) of xx% during the forecast period (2025-2033), with significant market penetration across various segments. Competitive dynamics are intensifying, with companies focusing on product innovation, brand building, and efficient supply chains to gain market share.
Dominant Markets & Segments in KSA Ready Meals Industry
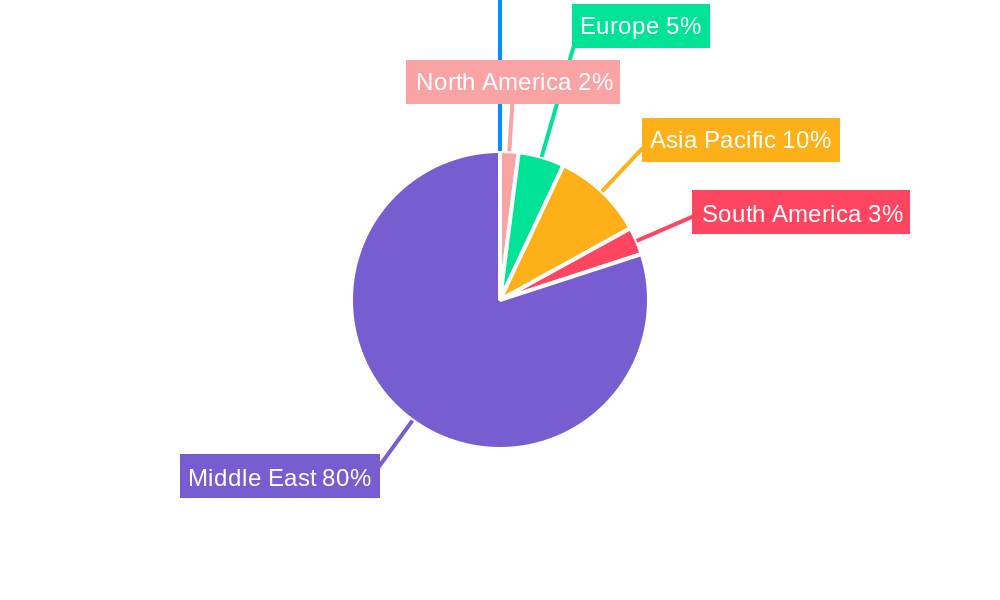
The KSA ready meals market shows strong growth across all regions, with major urban centers like Riyadh, Jeddah, and Dammam driving the highest demand. The frozen ready meal segment currently holds the largest market share, owing to its extended shelf life and convenience.
- Leading Region: Major urban centers (Riyadh, Jeddah, Dammam)
- Product Type:
- Frozen Ready Meals: Dominant segment due to longer shelf life and convenience, xx Million USD market value in 2025. Key drivers include longer shelf life, ease of storage, and consumer preference.
- Chilled Ready Meals: Growing segment driven by increased preference for freshness, xx Million USD market value in 2025.
- Ambient Ready Meals: Smaller segment, but growing steadily, xx Million USD market value in 2025.
- Distribution Channel:
- Hypermarkets/Supermarkets: Largest distribution channel, xx Million USD market value in 2025. Key drivers include established retail infrastructure and broad consumer reach.
- Convenience Stores: Growing rapidly due to increasing consumer demand for immediate access to convenient foods, xx Million USD market value in 2025.
- Online Retail Stores: Rapid expansion driven by e-commerce growth and increasing online grocery shopping, xx Million USD market value in 2025.
- Other Distribution Channels: Includes food service, catering, and direct-to-consumer models, xx Million USD market value in 2025.
KSA Ready Meals Industry Product Innovations
The KSA ready meals sector is witnessing significant product innovation, with companies focusing on healthier ingredients, diverse cuisines, and convenient packaging formats. Technological advancements in food preservation and processing are improving product quality and shelf life. Single-serve packaging and meal kits are gaining popularity, reflecting evolving consumer preferences. Companies are also introducing ready meals catering to specific dietary needs, such as low-sodium, low-fat, and gluten-free options, enhancing market appeal and competitiveness.
Report Segmentation & Scope
This report segments the KSA ready meals market by product type (frozen, chilled, ambient) and distribution channel (hypermarkets, convenience stores, online, other). Each segment's growth projections, market size (in Million USD), and competitive dynamics are analyzed, offering detailed insights into the industry's structure and trends. The report provides a comprehensive overview of the current market landscape, and future growth forecasts, taking into account various factors influencing the industry’s growth.
Key Drivers of KSA Ready Meals Industry Growth
The KSA ready meals market's growth is driven by several key factors: rising disposable incomes, evolving lifestyles (increased working women, busy families), growing urbanization, and the increasing penetration of online retail channels. The government's initiatives to promote the food processing industry and the ongoing development of infrastructure further contribute to this growth. The expanding tourism sector also boosts the demand for convenient and diverse food options.
Challenges in the KSA Ready Meals Industry Sector
The KSA ready meals industry faces certain challenges, including maintaining consistent product quality, managing supply chain complexities, and navigating stringent food safety regulations. Competition from established players and the rising popularity of alternative food options also present challenges. Furthermore, fluctuating raw material costs and maintaining affordability can impact market growth.
Leading Players in the KSA Ready Meals Industry Market
- Almunajem Foods
- JBS Foods SA (Seara Foods)
- Almarai Company
- Sunbulah Group
- Bolton Group SRL
- Americana Group
- Al Karamah Dough Production Co Ltd
- Zen Frozen Foods
- Al Kabeer Group
- The Oetker Group
- *List Not Exhaustive
Key Developments in KSA Ready Meals Industry Sector
- June 2023: Almarai Company signed a memorandum of understanding with the Ministry of Investment to develop the food industry, including ready meals, through new investment opportunities.
- July 2022: BRF Sadia expanded its production capacity to 1,200 tons of food with an investment of USD 18 Million in Al Joody, Dammam.
- June 2022: Siwar Food launched a line of frozen meals and desserts, available online and through vending machines.
Strategic KSA Ready Meals Industry Market Outlook
The KSA ready meals market holds significant growth potential, driven by favorable demographic trends, evolving consumer preferences, and supportive government policies. Strategic opportunities exist for companies focusing on innovation, efficient supply chains, and expanding online distribution channels. The focus on healthy and diverse product offerings will be crucial for success in this dynamic market. Investment in technology and sustainable practices will further enhance market competitiveness and growth.
KSA Ready Meals Industry Segmentation
-
1. Product Type
- 1.1. Frozen Ready Meal
- 1.2. Chilled Ready Meal
- 1.3. Ambient Ready Meal
-
2. Distribution Channel
- 2.1. Hypermarkets/Supermarkets
- 2.2. Convenience Stores
- 2.3. Online Retail Stores
- 2.4. Other Distribution Channels
KSA Ready Meals Industry Segmentation By Geography
-
1. North America
- 1.1. United States
- 1.2. Canada
- 1.3. Mexico
-
2. South America
- 2.1. Brazil
- 2.2. Argentina
- 2.3. Rest of South America
-
3. Europe
- 3.1. United Kingdom
- 3.2. Germany
- 3.3. France
- 3.4. Italy
- 3.5. Spain
- 3.6. Russia
- 3.7. Benelux
- 3.8. Nordics
- 3.9. Rest of Europe
-
4. Middle East & Africa
- 4.1. Turkey
- 4.2. Israel
- 4.3. GCC
- 4.4. North Africa
- 4.5. South Africa
- 4.6. Rest of Middle East & Africa
-
5. Asia Pacific
- 5.1. China
- 5.2. India
- 5.3. Japan
- 5.4. South Korea
- 5.5. ASEAN
- 5.6. Oceania
- 5.7. Rest of Asia Pacific
KSA Ready Meals Industry REPORT HIGHLIGHTS
| Aspects | Details |
|---|---|
| Study Period | 2019-2033 |
| Base Year | 2024 |
| Estimated Year | 2025 |
| Forecast Period | 2025-2033 |
| Historical Period | 2019-2024 |
| Growth Rate | CAGR of 3.56% from 2019-2033 |
| Segmentation |
|
Table of Contents
- 1. Introduction
- 1.1. Research Scope
- 1.2. Market Segmentation
- 1.3. Research Methodology
- 1.4. Definitions and Assumptions
- 2. Executive Summary
- 2.1. Introduction
- 3. Market Dynamics
- 3.1. Introduction
- 3.2. Market Drivers
- 3.2.1. Popularity of Convenient Food Products
- 3.3. Market Restrains
- 3.3.1. High Import Dependency for Food Ingredients
- 3.4. Market Trends
- 3.4.1. Increased Demand for Convenience Food Products
- 4. Market Factor Analysis
- 4.1. Porters Five Forces
- 4.2. Supply/Value Chain
- 4.3. PESTEL analysis
- 4.4. Market Entropy
- 4.5. Patent/Trademark Analysis
- 5. Global KSA Ready Meals Industry Analysis, Insights and Forecast, 2019-2031
- 5.1. Market Analysis, Insights and Forecast - by Product Type
- 5.1.1. Frozen Ready Meal
- 5.1.2. Chilled Ready Meal
- 5.1.3. Ambient Ready Meal
- 5.2. Market Analysis, Insights and Forecast - by Distribution Channel
- 5.2.1. Hypermarkets/Supermarkets
- 5.2.2. Convenience Stores
- 5.2.3. Online Retail Stores
- 5.2.4. Other Distribution Channels
- 5.3. Market Analysis, Insights and Forecast - by Region
- 5.3.1. North America
- 5.3.2. South America
- 5.3.3. Europe
- 5.3.4. Middle East & Africa
- 5.3.5. Asia Pacific
- 5.1. Market Analysis, Insights and Forecast - by Product Type
- 6. North America KSA Ready Meals Industry Analysis, Insights and Forecast, 2019-2031
- 6.1. Market Analysis, Insights and Forecast - by Product Type
- 6.1.1. Frozen Ready Meal
- 6.1.2. Chilled Ready Meal
- 6.1.3. Ambient Ready Meal
- 6.2. Market Analysis, Insights and Forecast - by Distribution Channel
- 6.2.1. Hypermarkets/Supermarkets
- 6.2.2. Convenience Stores
- 6.2.3. Online Retail Stores
- 6.2.4. Other Distribution Channels
- 6.1. Market Analysis, Insights and Forecast - by Product Type
- 7. South America KSA Ready Meals Industry Analysis, Insights and Forecast, 2019-2031
- 7.1. Market Analysis, Insights and Forecast - by Product Type
- 7.1.1. Frozen Ready Meal
- 7.1.2. Chilled Ready Meal
- 7.1.3. Ambient Ready Meal
- 7.2. Market Analysis, Insights and Forecast - by Distribution Channel
- 7.2.1. Hypermarkets/Supermarkets
- 7.2.2. Convenience Stores
- 7.2.3. Online Retail Stores
- 7.2.4. Other Distribution Channels
- 7.1. Market Analysis, Insights and Forecast - by Product Type
- 8. Europe KSA Ready Meals Industry Analysis, Insights and Forecast, 2019-2031
- 8.1. Market Analysis, Insights and Forecast - by Product Type
- 8.1.1. Frozen Ready Meal
- 8.1.2. Chilled Ready Meal
- 8.1.3. Ambient Ready Meal
- 8.2. Market Analysis, Insights and Forecast - by Distribution Channel
- 8.2.1. Hypermarkets/Supermarkets
- 8.2.2. Convenience Stores
- 8.2.3. Online Retail Stores
- 8.2.4. Other Distribution Channels
- 8.1. Market Analysis, Insights and Forecast - by Product Type
- 9. Middle East & Africa KSA Ready Meals Industry Analysis, Insights and Forecast, 2019-2031
- 9.1. Market Analysis, Insights and Forecast - by Product Type
- 9.1.1. Frozen Ready Meal
- 9.1.2. Chilled Ready Meal
- 9.1.3. Ambient Ready Meal
- 9.2. Market Analysis, Insights and Forecast - by Distribution Channel
- 9.2.1. Hypermarkets/Supermarkets
- 9.2.2. Convenience Stores
- 9.2.3. Online Retail Stores
- 9.2.4. Other Distribution Channels
- 9.1. Market Analysis, Insights and Forecast - by Product Type
- 10. Asia Pacific KSA Ready Meals Industry Analysis, Insights and Forecast, 2019-2031
- 10.1. Market Analysis, Insights and Forecast - by Product Type
- 10.1.1. Frozen Ready Meal
- 10.1.2. Chilled Ready Meal
- 10.1.3. Ambient Ready Meal
- 10.2. Market Analysis, Insights and Forecast - by Distribution Channel
- 10.2.1. Hypermarkets/Supermarkets
- 10.2.2. Convenience Stores
- 10.2.3. Online Retail Stores
- 10.2.4. Other Distribution Channels
- 10.1. Market Analysis, Insights and Forecast - by Product Type
- 11. North America KSA Ready Meals Industry Analysis, Insights and Forecast, 2019-2031
- 11.1. Market Analysis, Insights and Forecast - By Country/Sub-region
- 11.1.1 United States
- 11.1.2 Canada
- 11.1.3 Mexico
- 11.1.4 Rest of North America
- 12. Europe KSA Ready Meals Industry Analysis, Insights and Forecast, 2019-2031
- 12.1. Market Analysis, Insights and Forecast - By Country/Sub-region
- 12.1.1 Spain
- 12.1.2 United Kingdom
- 12.1.3 France
- 12.1.4 Germany
- 12.1.5 Russia
- 12.1.6 Italy
- 12.1.7 Rest of Europe
- 13. Asia Pacific KSA Ready Meals Industry Analysis, Insights and Forecast, 2019-2031
- 13.1. Market Analysis, Insights and Forecast - By Country/Sub-region
- 13.1.1 China
- 13.1.2 Japan
- 13.1.3 India
- 13.1.4 Australia
- 13.1.5 Rest of Asia Pacific
- 14. South America KSA Ready Meals Industry Analysis, Insights and Forecast, 2019-2031
- 14.1. Market Analysis, Insights and Forecast - By Country/Sub-region
- 14.1.1 Brazil
- 14.1.2 Argentina
- 14.1.3 Rest of South America
- 15. Middle East KSA Ready Meals Industry Analysis, Insights and Forecast, 2019-2031
- 15.1. Market Analysis, Insights and Forecast - By Country/Sub-region
- 15.1.1.
- 16. South Africa KSA Ready Meals Industry Analysis, Insights and Forecast, 2019-2031
- 16.1. Market Analysis, Insights and Forecast - By Country/Sub-region
- 16.1.1 Saudi Arabia
- 16.1.2 Rest of Middle East
- 17. Competitive Analysis
- 17.1. Global Market Share Analysis 2024
- 17.2. Company Profiles
- 17.2.1 Almunajem Foods
- 17.2.1.1. Overview
- 17.2.1.2. Products
- 17.2.1.3. SWOT Analysis
- 17.2.1.4. Recent Developments
- 17.2.1.5. Financials (Based on Availability)
- 17.2.2 JBS Foods SA (Seara Foods)
- 17.2.2.1. Overview
- 17.2.2.2. Products
- 17.2.2.3. SWOT Analysis
- 17.2.2.4. Recent Developments
- 17.2.2.5. Financials (Based on Availability)
- 17.2.3 Almarai Company
- 17.2.3.1. Overview
- 17.2.3.2. Products
- 17.2.3.3. SWOT Analysis
- 17.2.3.4. Recent Developments
- 17.2.3.5. Financials (Based on Availability)
- 17.2.4 Sunbulah Group
- 17.2.4.1. Overview
- 17.2.4.2. Products
- 17.2.4.3. SWOT Analysis
- 17.2.4.4. Recent Developments
- 17.2.4.5. Financials (Based on Availability)
- 17.2.5 Bolton Group SRL
- 17.2.5.1. Overview
- 17.2.5.2. Products
- 17.2.5.3. SWOT Analysis
- 17.2.5.4. Recent Developments
- 17.2.5.5. Financials (Based on Availability)
- 17.2.6 Americana Group
- 17.2.6.1. Overview
- 17.2.6.2. Products
- 17.2.6.3. SWOT Analysis
- 17.2.6.4. Recent Developments
- 17.2.6.5. Financials (Based on Availability)
- 17.2.7 Al Karamah Dough Production Co Ltd
- 17.2.7.1. Overview
- 17.2.7.2. Products
- 17.2.7.3. SWOT Analysis
- 17.2.7.4. Recent Developments
- 17.2.7.5. Financials (Based on Availability)
- 17.2.8 Zen Frozen Foods
- 17.2.8.1. Overview
- 17.2.8.2. Products
- 17.2.8.3. SWOT Analysis
- 17.2.8.4. Recent Developments
- 17.2.8.5. Financials (Based on Availability)
- 17.2.9 Al Kabeer Group
- 17.2.9.1. Overview
- 17.2.9.2. Products
- 17.2.9.3. SWOT Analysis
- 17.2.9.4. Recent Developments
- 17.2.9.5. Financials (Based on Availability)
- 17.2.10 The Oetker Group *List Not Exhaustive
- 17.2.10.1. Overview
- 17.2.10.2. Products
- 17.2.10.3. SWOT Analysis
- 17.2.10.4. Recent Developments
- 17.2.10.5. Financials (Based on Availability)
- 17.2.1 Almunajem Foods
List of Figures
- Figure 1: Global KSA Ready Meals Industry Revenue Breakdown (Million, %) by Region 2024 & 2032
- Figure 2: North America KSA Ready Meals Industry Revenue (Million), by Country 2024 & 2032
- Figure 3: North America KSA Ready Meals Industry Revenue Share (%), by Country 2024 & 2032
- Figure 4: Europe KSA Ready Meals Industry Revenue (Million), by Country 2024 & 2032
- Figure 5: Europe KSA Ready Meals Industry Revenue Share (%), by Country 2024 & 2032
- Figure 6: Asia Pacific KSA Ready Meals Industry Revenue (Million), by Country 2024 & 2032
- Figure 7: Asia Pacific KSA Ready Meals Industry Revenue Share (%), by Country 2024 & 2032
- Figure 8: South America KSA Ready Meals Industry Revenue (Million), by Country 2024 & 2032
- Figure 9: South America KSA Ready Meals Industry Revenue Share (%), by Country 2024 & 2032
- Figure 10: Middle East KSA Ready Meals Industry Revenue (Million), by Country 2024 & 2032
- Figure 11: Middle East KSA Ready Meals Industry Revenue Share (%), by Country 2024 & 2032
- Figure 12: South Africa KSA Ready Meals Industry Revenue (Million), by Country 2024 & 2032
- Figure 13: South Africa KSA Ready Meals Industry Revenue Share (%), by Country 2024 & 2032
- Figure 14: North America KSA Ready Meals Industry Revenue (Million), by Product Type 2024 & 2032
- Figure 15: North America KSA Ready Meals Industry Revenue Share (%), by Product Type 2024 & 2032
- Figure 16: North America KSA Ready Meals Industry Revenue (Million), by Distribution Channel 2024 & 2032
- Figure 17: North America KSA Ready Meals Industry Revenue Share (%), by Distribution Channel 2024 & 2032
- Figure 18: North America KSA Ready Meals Industry Revenue (Million), by Country 2024 & 2032
- Figure 19: North America KSA Ready Meals Industry Revenue Share (%), by Country 2024 & 2032
- Figure 20: South America KSA Ready Meals Industry Revenue (Million), by Product Type 2024 & 2032
- Figure 21: South America KSA Ready Meals Industry Revenue Share (%), by Product Type 2024 & 2032
- Figure 22: South America KSA Ready Meals Industry Revenue (Million), by Distribution Channel 2024 & 2032
- Figure 23: South America KSA Ready Meals Industry Revenue Share (%), by Distribution Channel 2024 & 2032
- Figure 24: South America KSA Ready Meals Industry Revenue (Million), by Country 2024 & 2032
- Figure 25: South America KSA Ready Meals Industry Revenue Share (%), by Country 2024 & 2032
- Figure 26: Europe KSA Ready Meals Industry Revenue (Million), by Product Type 2024 & 2032
- Figure 27: Europe KSA Ready Meals Industry Revenue Share (%), by Product Type 2024 & 2032
- Figure 28: Europe KSA Ready Meals Industry Revenue (Million), by Distribution Channel 2024 & 2032
- Figure 29: Europe KSA Ready Meals Industry Revenue Share (%), by Distribution Channel 2024 & 2032
- Figure 30: Europe KSA Ready Meals Industry Revenue (Million), by Country 2024 & 2032
- Figure 31: Europe KSA Ready Meals Industry Revenue Share (%), by Country 2024 & 2032
- Figure 32: Middle East & Africa KSA Ready Meals Industry Revenue (Million), by Product Type 2024 & 2032
- Figure 33: Middle East & Africa KSA Ready Meals Industry Revenue Share (%), by Product Type 2024 & 2032
- Figure 34: Middle East & Africa KSA Ready Meals Industry Revenue (Million), by Distribution Channel 2024 & 2032
- Figure 35: Middle East & Africa KSA Ready Meals Industry Revenue Share (%), by Distribution Channel 2024 & 2032
- Figure 36: Middle East & Africa KSA Ready Meals Industry Revenue (Million), by Country 2024 & 2032
- Figure 37: Middle East & Africa KSA Ready Meals Industry Revenue Share (%), by Country 2024 & 2032
- Figure 38: Asia Pacific KSA Ready Meals Industry Revenue (Million), by Product Type 2024 & 2032
- Figure 39: Asia Pacific KSA Ready Meals Industry Revenue Share (%), by Product Type 2024 & 2032
- Figure 40: Asia Pacific KSA Ready Meals Industry Revenue (Million), by Distribution Channel 2024 & 2032
- Figure 41: Asia Pacific KSA Ready Meals Industry Revenue Share (%), by Distribution Channel 2024 & 2032
- Figure 42: Asia Pacific KSA Ready Meals Industry Revenue (Million), by Country 2024 & 2032
- Figure 43: Asia Pacific KSA Ready Meals Industry Revenue Share (%), by Country 2024 & 2032
List of Tables
- Table 1: Global KSA Ready Meals Industry Revenue Million Forecast, by Region 2019 & 2032
- Table 2: Global KSA Ready Meals Industry Revenue Million Forecast, by Product Type 2019 & 2032
- Table 3: Global KSA Ready Meals Industry Revenue Million Forecast, by Distribution Channel 2019 & 2032
- Table 4: Global KSA Ready Meals Industry Revenue Million Forecast, by Region 2019 & 2032
- Table 5: Global KSA Ready Meals Industry Revenue Million Forecast, by Country 2019 & 2032
- Table 6: United States KSA Ready Meals Industry Revenue (Million) Forecast, by Application 2019 & 2032
- Table 7: Canada KSA Ready Meals Industry Revenue (Million) Forecast, by Application 2019 & 2032
- Table 8: Mexico KSA Ready Meals Industry Revenue (Million) Forecast, by Application 2019 & 2032
- Table 9: Rest of North America KSA Ready Meals Industry Revenue (Million) Forecast, by Application 2019 & 2032
- Table 10: Global KSA Ready Meals Industry Revenue Million Forecast, by Country 2019 & 2032
- Table 11: Spain KSA Ready Meals Industry Revenue (Million) Forecast, by Application 2019 & 2032
- Table 12: United Kingdom KSA Ready Meals Industry Revenue (Million) Forecast, by Application 2019 & 2032
- Table 13: France KSA Ready Meals Industry Revenue (Million) Forecast, by Application 2019 & 2032
- Table 14: Germany KSA Ready Meals Industry Revenue (Million) Forecast, by Application 2019 & 2032
- Table 15: Russia KSA Ready Meals Industry Revenue (Million) Forecast, by Application 2019 & 2032
- Table 16: Italy KSA Ready Meals Industry Revenue (Million) Forecast, by Application 2019 & 2032
- Table 17: Rest of Europe KSA Ready Meals Industry Revenue (Million) Forecast, by Application 2019 & 2032
- Table 18: Global KSA Ready Meals Industry Revenue Million Forecast, by Country 2019 & 2032
- Table 19: China KSA Ready Meals Industry Revenue (Million) Forecast, by Application 2019 & 2032
- Table 20: Japan KSA Ready Meals Industry Revenue (Million) Forecast, by Application 2019 & 2032
- Table 21: India KSA Ready Meals Industry Revenue (Million) Forecast, by Application 2019 & 2032
- Table 22: Australia KSA Ready Meals Industry Revenue (Million) Forecast, by Application 2019 & 2032
- Table 23: Rest of Asia Pacific KSA Ready Meals Industry Revenue (Million) Forecast, by Application 2019 & 2032
- Table 24: Global KSA Ready Meals Industry Revenue Million Forecast, by Country 2019 & 2032
- Table 25: Brazil KSA Ready Meals Industry Revenue (Million) Forecast, by Application 2019 & 2032
- Table 26: Argentina KSA Ready Meals Industry Revenue (Million) Forecast, by Application 2019 & 2032
- Table 27: Rest of South America KSA Ready Meals Industry Revenue (Million) Forecast, by Application 2019 & 2032
- Table 28: Global KSA Ready Meals Industry Revenue Million Forecast, by Country 2019 & 2032
- Table 29: KSA Ready Meals Industry Revenue (Million) Forecast, by Application 2019 & 2032
- Table 30: Global KSA Ready Meals Industry Revenue Million Forecast, by Country 2019 & 2032
- Table 31: Saudi Arabia KSA Ready Meals Industry Revenue (Million) Forecast, by Application 2019 & 2032
- Table 32: Rest of Middle East KSA Ready Meals Industry Revenue (Million) Forecast, by Application 2019 & 2032
- Table 33: Global KSA Ready Meals Industry Revenue Million Forecast, by Product Type 2019 & 2032
- Table 34: Global KSA Ready Meals Industry Revenue Million Forecast, by Distribution Channel 2019 & 2032
- Table 35: Global KSA Ready Meals Industry Revenue Million Forecast, by Country 2019 & 2032
- Table 36: United States KSA Ready Meals Industry Revenue (Million) Forecast, by Application 2019 & 2032
- Table 37: Canada KSA Ready Meals Industry Revenue (Million) Forecast, by Application 2019 & 2032
- Table 38: Mexico KSA Ready Meals Industry Revenue (Million) Forecast, by Application 2019 & 2032
- Table 39: Global KSA Ready Meals Industry Revenue Million Forecast, by Product Type 2019 & 2032
- Table 40: Global KSA Ready Meals Industry Revenue Million Forecast, by Distribution Channel 2019 & 2032
- Table 41: Global KSA Ready Meals Industry Revenue Million Forecast, by Country 2019 & 2032
- Table 42: Brazil KSA Ready Meals Industry Revenue (Million) Forecast, by Application 2019 & 2032
- Table 43: Argentina KSA Ready Meals Industry Revenue (Million) Forecast, by Application 2019 & 2032
- Table 44: Rest of South America KSA Ready Meals Industry Revenue (Million) Forecast, by Application 2019 & 2032
- Table 45: Global KSA Ready Meals Industry Revenue Million Forecast, by Product Type 2019 & 2032
- Table 46: Global KSA Ready Meals Industry Revenue Million Forecast, by Distribution Channel 2019 & 2032
- Table 47: Global KSA Ready Meals Industry Revenue Million Forecast, by Country 2019 & 2032
- Table 48: United Kingdom KSA Ready Meals Industry Revenue (Million) Forecast, by Application 2019 & 2032
- Table 49: Germany KSA Ready Meals Industry Revenue (Million) Forecast, by Application 2019 & 2032
- Table 50: France KSA Ready Meals Industry Revenue (Million) Forecast, by Application 2019 & 2032
- Table 51: Italy KSA Ready Meals Industry Revenue (Million) Forecast, by Application 2019 & 2032
- Table 52: Spain KSA Ready Meals Industry Revenue (Million) Forecast, by Application 2019 & 2032
- Table 53: Russia KSA Ready Meals Industry Revenue (Million) Forecast, by Application 2019 & 2032
- Table 54: Benelux KSA Ready Meals Industry Revenue (Million) Forecast, by Application 2019 & 2032
- Table 55: Nordics KSA Ready Meals Industry Revenue (Million) Forecast, by Application 2019 & 2032
- Table 56: Rest of Europe KSA Ready Meals Industry Revenue (Million) Forecast, by Application 2019 & 2032
- Table 57: Global KSA Ready Meals Industry Revenue Million Forecast, by Product Type 2019 & 2032
- Table 58: Global KSA Ready Meals Industry Revenue Million Forecast, by Distribution Channel 2019 & 2032
- Table 59: Global KSA Ready Meals Industry Revenue Million Forecast, by Country 2019 & 2032
- Table 60: Turkey KSA Ready Meals Industry Revenue (Million) Forecast, by Application 2019 & 2032
- Table 61: Israel KSA Ready Meals Industry Revenue (Million) Forecast, by Application 2019 & 2032
- Table 62: GCC KSA Ready Meals Industry Revenue (Million) Forecast, by Application 2019 & 2032
- Table 63: North Africa KSA Ready Meals Industry Revenue (Million) Forecast, by Application 2019 & 2032
- Table 64: South Africa KSA Ready Meals Industry Revenue (Million) Forecast, by Application 2019 & 2032
- Table 65: Rest of Middle East & Africa KSA Ready Meals Industry Revenue (Million) Forecast, by Application 2019 & 2032
- Table 66: Global KSA Ready Meals Industry Revenue Million Forecast, by Product Type 2019 & 2032
- Table 67: Global KSA Ready Meals Industry Revenue Million Forecast, by Distribution Channel 2019 & 2032
- Table 68: Global KSA Ready Meals Industry Revenue Million Forecast, by Country 2019 & 2032
- Table 69: China KSA Ready Meals Industry Revenue (Million) Forecast, by Application 2019 & 2032
- Table 70: India KSA Ready Meals Industry Revenue (Million) Forecast, by Application 2019 & 2032
- Table 71: Japan KSA Ready Meals Industry Revenue (Million) Forecast, by Application 2019 & 2032
- Table 72: South Korea KSA Ready Meals Industry Revenue (Million) Forecast, by Application 2019 & 2032
- Table 73: ASEAN KSA Ready Meals Industry Revenue (Million) Forecast, by Application 2019 & 2032
- Table 74: Oceania KSA Ready Meals Industry Revenue (Million) Forecast, by Application 2019 & 2032
- Table 75: Rest of Asia Pacific KSA Ready Meals Industry Revenue (Million) Forecast, by Application 2019 & 2032
Frequently Asked Questions
1. What is the projected Compound Annual Growth Rate (CAGR) of the KSA Ready Meals Industry?
The projected CAGR is approximately 3.56%.
2. Which companies are prominent players in the KSA Ready Meals Industry?
Key companies in the market include Almunajem Foods, JBS Foods SA (Seara Foods), Almarai Company, Sunbulah Group, Bolton Group SRL, Americana Group, Al Karamah Dough Production Co Ltd, Zen Frozen Foods, Al Kabeer Group, The Oetker Group *List Not Exhaustive.
3. What are the main segments of the KSA Ready Meals Industry?
The market segments include Product Type, Distribution Channel.
4. Can you provide details about the market size?
The market size is estimated to be USD XX Million as of 2022.
5. What are some drivers contributing to market growth?
Popularity of Convenient Food Products.
6. What are the notable trends driving market growth?
Increased Demand for Convenience Food Products.
7. Are there any restraints impacting market growth?
High Import Dependency for Food Ingredients.
8. Can you provide examples of recent developments in the market?
In June 2023, Almarai Company signed a memorandum of understanding with the Ministry of Investment on June 6, 2023, to discuss ways to develop the food industry (including ready meals) in the country through new investment opportunities in the food sector, which has great potential that has contributed significantly to the arrival of these products to various regions of the country and contributing to increasing exports, regionally and internationally.
9. What pricing options are available for accessing the report?
Pricing options include single-user, multi-user, and enterprise licenses priced at USD 3800, USD 4500, and USD 5800 respectively.
10. Is the market size provided in terms of value or volume?
The market size is provided in terms of value, measured in Million.
11. Are there any specific market keywords associated with the report?
Yes, the market keyword associated with the report is "KSA Ready Meals Industry," which aids in identifying and referencing the specific market segment covered.
12. How do I determine which pricing option suits my needs best?
The pricing options vary based on user requirements and access needs. Individual users may opt for single-user licenses, while businesses requiring broader access may choose multi-user or enterprise licenses for cost-effective access to the report.
13. Are there any additional resources or data provided in the KSA Ready Meals Industry report?
While the report offers comprehensive insights, it's advisable to review the specific contents or supplementary materials provided to ascertain if additional resources or data are available.
14. How can I stay updated on further developments or reports in the KSA Ready Meals Industry?
To stay informed about further developments, trends, and reports in the KSA Ready Meals Industry, consider subscribing to industry newsletters, following relevant companies and organizations, or regularly checking reputable industry news sources and publications.
Methodology
Step 1 - Identification of Relevant Samples Size from Population Database


Step 2 - Approaches for Defining Global Market Size (Value, Volume* & Price*)

Note*: In applicable scenarios
Step 3 - Data Sources
Primary Research
- Web Analytics
- Survey Reports
- Research Institute
- Latest Research Reports
- Opinion Leaders
Secondary Research
- Annual Reports
- White Paper
- Latest Press Release
- Industry Association
- Paid Database
- Investor Presentations

Step 4 - Data Triangulation
Involves using different sources of information in order to increase the validity of a study
These sources are likely to be stakeholders in a program - participants, other researchers, program staff, other community members, and so on.
Then we put all data in single framework & apply various statistical tools to find out the dynamic on the market.
During the analysis stage, feedback from the stakeholder groups would be compared to determine areas of agreement as well as areas of divergence


