
Key Insights
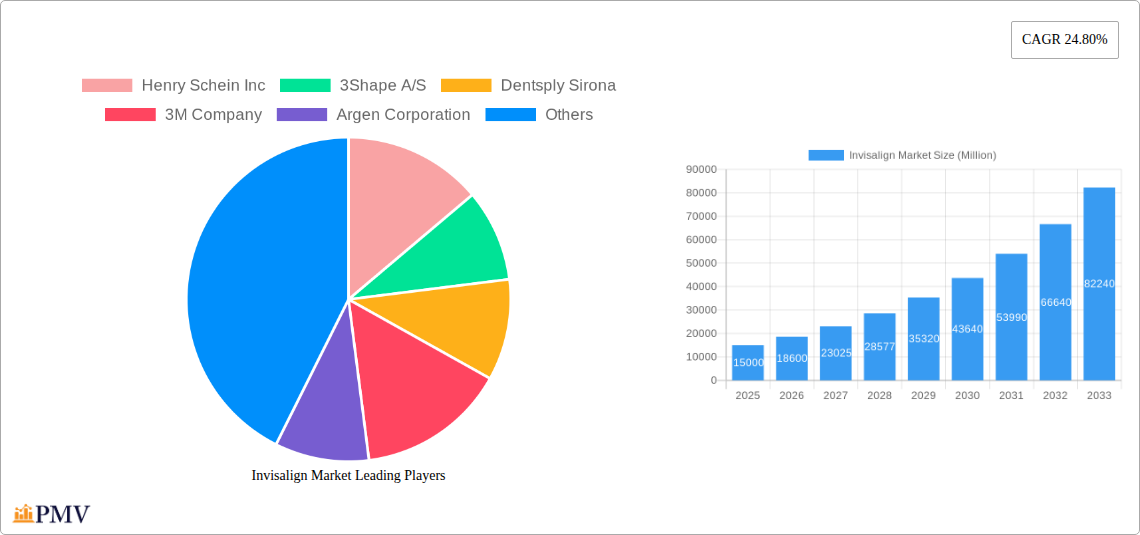
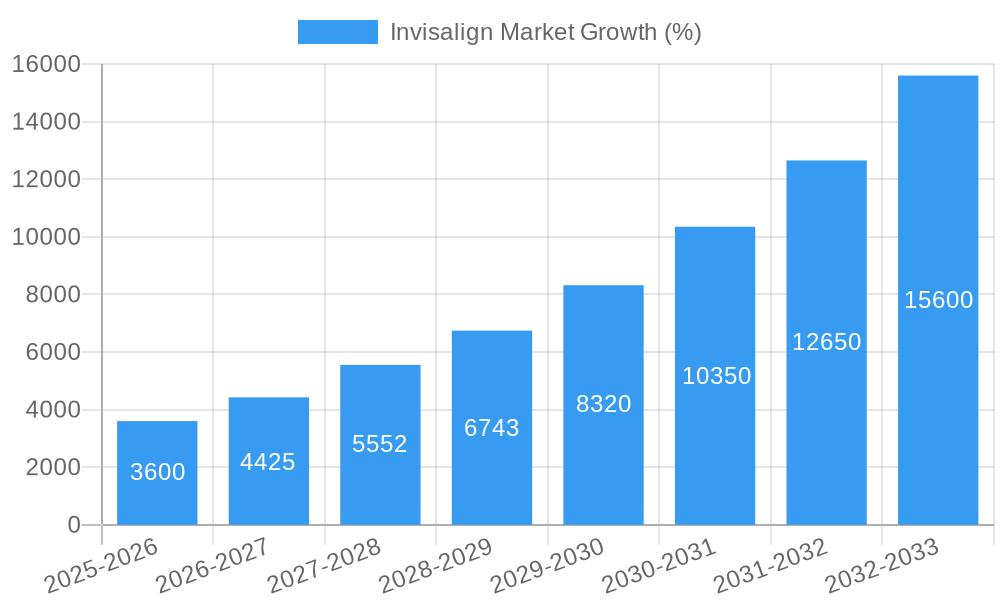
The Invisalign market, exhibiting a robust Compound Annual Growth Rate (CAGR) of 24.80%, is poised for significant expansion from 2025 to 2033. This growth is fueled by several key factors. The increasing prevalence of malocclusion (improper bite) and the rising demand for aesthetically pleasing orthodontic solutions are major drivers. Technological advancements in aligner technology, leading to improved comfort, shorter treatment times, and more predictable results, further contribute to market expansion. The growing awareness among consumers about the benefits of clear aligners over traditional braces, coupled with increased disposable incomes, especially in developing economies, is also driving adoption. Furthermore, the expanding network of dental clinics and orthodontists offering Invisalign treatment, along with favorable reimbursement policies in certain regions, facilitates market growth. Segmentation reveals strong demand across adult and teen demographics, with hospitals and dental/orthodontic clinics constituting the primary end-users. Major players like Align Technology, 3M, and Dentsply Sirona are strategically investing in research and development, product innovation, and expanding their global reach, thereby intensifying competition and driving market expansion.
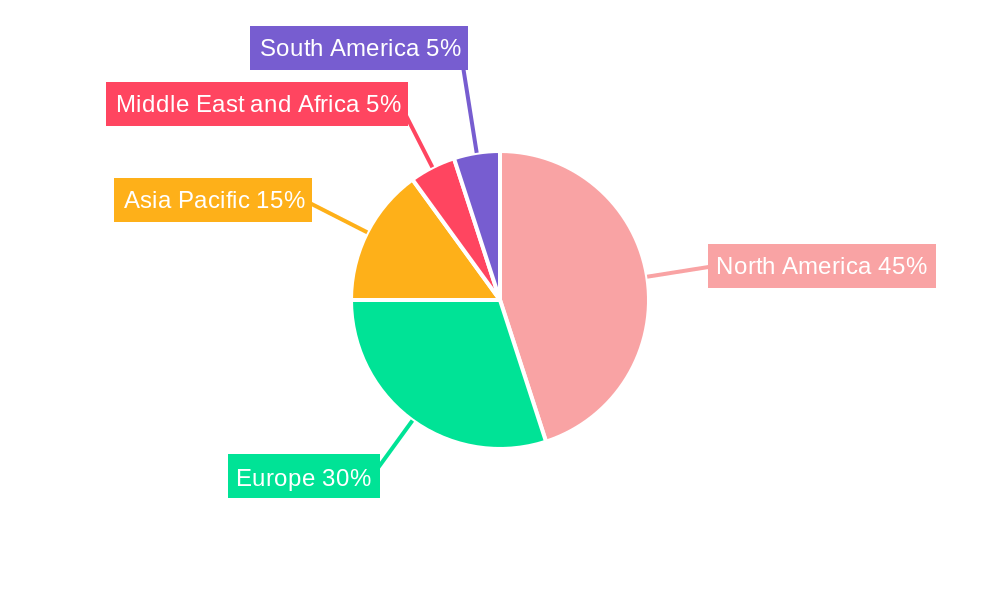
The geographic distribution of the Invisalign market reveals North America as a dominant region, driven by high adoption rates and advanced healthcare infrastructure. Europe follows closely, with significant growth potential in emerging markets within the Asia-Pacific region. While the market faces certain restraints such as the high cost of treatment and potential complications, the overall positive growth trajectory suggests substantial future opportunities. The increasing integration of digital technologies like 3D printing and AI in treatment planning and manufacturing further enhances the market outlook. This combination of consumer demand, technological innovation, and strategic corporate actions points to a consistent and considerable expansion of the Invisalign market throughout the forecast period.
Invisalign Market: A Comprehensive Report (2019-2033)
This comprehensive report provides an in-depth analysis of the Invisalign market, encompassing market structure, competitive dynamics, industry trends, and future growth prospects. The study period covers 2019-2033, with 2025 as the base and estimated year. The forecast period spans from 2025 to 2033, while the historical period covers 2019-2024. This report is crucial for businesses, investors, and stakeholders seeking a detailed understanding of this dynamic market. The global Invisalign market is projected to reach xx Million by 2033, exhibiting a CAGR of xx% during the forecast period.
Invisalign Market Structure & Competitive Dynamics
The Invisalign market is characterized by a moderately concentrated structure, with key players holding significant market share. Align Technology Inc. currently dominates the market, commanding an estimated xx% share in 2025. Other prominent players include Henry Schein Inc., 3Shape A/S, Dentsply Sirona, 3M Company, Argen Corporation, Angelalign Technology, TP Orthodontics Inc., Patterson Companies Inc., and Institut Straumann AG. These companies compete primarily on product innovation, technology, distribution networks, and pricing strategies.
The market exhibits a robust innovation ecosystem, with ongoing advancements in aligner technology, software, and treatment planning. Regulatory frameworks vary across different regions, impacting market entry and product approval processes. Clear aligners face competition from traditional orthodontic treatments like braces, but the preference for aesthetic and convenient alternatives fuels market growth. M&A activities are relatively frequent, with recent deals focused on expanding product portfolios and market reach. The total value of M&A deals in the Invisalign market from 2019-2024 is estimated at xx Million. Key trends include a growing preference for digital workflows and increased adoption of telehealth for consultations and remote monitoring.
Invisalign Market Industry Trends & Insights
The Invisalign market is experiencing robust growth driven by several factors. The increasing prevalence of malocclusion, rising awareness of cosmetic dentistry, and a growing preference for aesthetic orthodontic solutions are key drivers. Technological advancements, particularly in 3D printing and digital imaging, are improving treatment accuracy and efficiency. The market is witnessing a shift towards personalized treatment plans and customized aligner designs, catering to individual patient needs. Consumer preferences are evolving towards minimally invasive, comfortable, and removable aligners. The market penetration of Invisalign aligners is estimated at xx% in 2025, with projections for significant growth in the coming years. The competitive landscape remains dynamic, with existing players continuously innovating and new entrants challenging the market leadership. The global market is expected to exhibit a compound annual growth rate (CAGR) of xx% from 2025 to 2033.
Dominant Markets & Segments in Invisalign Market
The North American market currently dominates the global Invisalign market, driven by high disposable incomes, advanced healthcare infrastructure, and high adoption rates of aesthetic dentistry. Within this market, the United States holds the largest share.
- Key Drivers in North America:
- High disposable incomes and healthcare expenditure.
- Strong adoption of advanced dental technologies.
- Extensive network of dental clinics and orthodontic practices.
- Favorable regulatory environment.
The adult segment represents the largest share of the Invisalign market, followed by the teen segment. The demand for aesthetic solutions and improved self-confidence among adults drives this significant segment growth. Dental and Orthodontic Clinics are the dominant end-users, accounting for the majority of Invisalign treatments.
Key Drivers for Adult Segment:
- Growing awareness of cosmetic dentistry and improved aesthetics.
- Increased disposable incomes and willingness to invest in premium dental solutions.
- Convenience and discretion offered by clear aligners.
Key Drivers for Teen Segment:
- Increasing parental awareness and willingness to invest in their children's oral health.
- Peer pressure and social acceptance of clear aligners.
Invisalign Market Product Innovations
Recent product innovations focus on enhanced aligner materials, improved treatment planning software, and integrated digital workflows. Manufacturers are increasingly incorporating artificial intelligence (AI) and machine learning (ML) to optimize treatment plans and predict outcomes. The focus is on improving comfort, reducing treatment time, and increasing overall patient satisfaction. These advancements contribute to competitive advantages by providing superior treatment outcomes and enhanced patient experiences.
Report Segmentation & Scope
This report segments the Invisalign market by age group (Adults and Teens) and end-user (Hospitals and Dental & Orthodontic Clinics). The adult segment is expected to show faster growth compared to the teen segment due to increasing disposable income and awareness about aesthetics. Dental and Orthodontic Clinics constitute the primary end-users, with a projected xx% market share in 2025. Hospitals hold a smaller market share due to limited specialized orthodontic facilities. Competitive dynamics differ across segments, with variations in pricing strategies, marketing approaches, and product offerings catering to specific patient demographics and end-user needs.
Key Drivers of Invisalign Market Growth
Technological advancements, particularly in 3D printing, CAD/CAM technology, and AI-powered treatment planning, have significantly boosted market growth. Rising disposable incomes in developed economies fuel demand for aesthetic dental solutions. Favorable regulatory frameworks, encouraging adoption of innovative orthodontic techniques, further contribute to market expansion. The increasing prevalence of malocclusion globally is another key driver.
Challenges in the Invisalign Market Sector
High initial costs of Invisalign treatment can pose a barrier for price-sensitive consumers. Supply chain disruptions and material shortages can impact production and delivery. Intense competition among established players and new market entrants adds pressure on pricing and profitability. Stringent regulatory approval processes in some regions can also delay product launches and market entry. These factors together may result in a projected xx Million loss in revenue by 2033.
Leading Players in the Invisalign Market Market
- Henry Schein Inc.
- 3Shape A/S
- Dentsply Sirona
- 3M Company
- Argen Corporation
- Angelalign Technology
- Align Technology Inc.
- TP Orthodontics Inc.
- Patterson Companies Inc.
- Institut Straumann AG
Key Developments in Invisalign Market Sector
August 2022: Orthobrain launched SimplyClear, a comprehensive orthodontic solution combining high-quality clear aligners with a proven support model, aiming to drive program success and long-term revenue growth.
February 2022: Bausch Health Companies Inc. launched OraFit, a custom clear aligner system using three-layer high-performance materials, targeting dental professionals and patients seeking improved aligner technology for malocclusion correction.
Strategic Invisalign Market Outlook
The Invisalign market presents significant growth opportunities in emerging economies, driven by increasing affordability and rising awareness of aesthetic dentistry. Strategic partnerships, focused on expanding distribution networks and integrating digital technologies, will be crucial for sustained success. Personalized treatment plans, combined with advanced diagnostic tools and AI-powered solutions, are poised to further propel market expansion. The future success hinges on continuous innovation, cost optimization, and adapting to evolving consumer preferences.
Invisalign Market Segmentation
-
1. Age
- 1.1. Adult
- 1.2. Teens
-
2. End User
- 2.1. Hospitals
- 2.2. Dental and Orthodontic Clinics
Invisalign Market Segmentation By Geography
-
1. North America
- 1.1. United States
- 1.2. Canada
- 1.3. Mexico
-
2. Europe
- 2.1. Germany
- 2.2. United Kingdom
- 2.3. France
- 2.4. Italy
- 2.5. Spain
- 2.6. Rest of Europe
-
3. Asia Pacific
- 3.1. China
- 3.2. Japan
- 3.3. India
- 3.4. Australia
- 3.5. South Korea
- 3.6. Rest of Asia Pacific
-
4. Middle East and Africa
- 4.1. GCC
- 4.2. South Africa
- 4.3. Rest of Middle East and Africa
-
5. South America
- 5.1. Brazil
- 5.2. Argentina
- 5.3. Rest of South America
Invisalign Market REPORT HIGHLIGHTS
| Aspects | Details |
|---|---|
| Study Period | 2019-2033 |
| Base Year | 2024 |
| Estimated Year | 2025 |
| Forecast Period | 2025-2033 |
| Historical Period | 2019-2024 |
| Growth Rate | CAGR of 24.80% from 2019-2033 |
| Segmentation |
|
Table of Contents
- 1. Introduction
- 1.1. Research Scope
- 1.2. Market Segmentation
- 1.3. Research Methodology
- 1.4. Definitions and Assumptions
- 2. Executive Summary
- 2.1. Introduction
- 3. Market Dynamics
- 3.1. Introduction
- 3.2. Market Drivers
- 3.2.1 Increasing Dental Problems like Malocclusions
- 3.2.2 Crowding
- 3.2.3 etc.; Rising Digital Technologies in Dentistry
- 3.3. Market Restrains
- 3.3.1. Huge Cost of Clear Aligners
- 3.4. Market Trends
- 3.4.1. Adult Segment is Expected to Have the Significant Market Share
- 4. Market Factor Analysis
- 4.1. Porters Five Forces
- 4.2. Supply/Value Chain
- 4.3. PESTEL analysis
- 4.4. Market Entropy
- 4.5. Patent/Trademark Analysis
- 5. Global Invisalign Market Analysis, Insights and Forecast, 2019-2031
- 5.1. Market Analysis, Insights and Forecast - by Age
- 5.1.1. Adult
- 5.1.2. Teens
- 5.2. Market Analysis, Insights and Forecast - by End User
- 5.2.1. Hospitals
- 5.2.2. Dental and Orthodontic Clinics
- 5.3. Market Analysis, Insights and Forecast - by Region
- 5.3.1. North America
- 5.3.2. Europe
- 5.3.3. Asia Pacific
- 5.3.4. Middle East and Africa
- 5.3.5. South America
- 5.1. Market Analysis, Insights and Forecast - by Age
- 6. North America Invisalign Market Analysis, Insights and Forecast, 2019-2031
- 6.1. Market Analysis, Insights and Forecast - by Age
- 6.1.1. Adult
- 6.1.2. Teens
- 6.2. Market Analysis, Insights and Forecast - by End User
- 6.2.1. Hospitals
- 6.2.2. Dental and Orthodontic Clinics
- 6.1. Market Analysis, Insights and Forecast - by Age
- 7. Europe Invisalign Market Analysis, Insights and Forecast, 2019-2031
- 7.1. Market Analysis, Insights and Forecast - by Age
- 7.1.1. Adult
- 7.1.2. Teens
- 7.2. Market Analysis, Insights and Forecast - by End User
- 7.2.1. Hospitals
- 7.2.2. Dental and Orthodontic Clinics
- 7.1. Market Analysis, Insights and Forecast - by Age
- 8. Asia Pacific Invisalign Market Analysis, Insights and Forecast, 2019-2031
- 8.1. Market Analysis, Insights and Forecast - by Age
- 8.1.1. Adult
- 8.1.2. Teens
- 8.2. Market Analysis, Insights and Forecast - by End User
- 8.2.1. Hospitals
- 8.2.2. Dental and Orthodontic Clinics
- 8.1. Market Analysis, Insights and Forecast - by Age
- 9. Middle East and Africa Invisalign Market Analysis, Insights and Forecast, 2019-2031
- 9.1. Market Analysis, Insights and Forecast - by Age
- 9.1.1. Adult
- 9.1.2. Teens
- 9.2. Market Analysis, Insights and Forecast - by End User
- 9.2.1. Hospitals
- 9.2.2. Dental and Orthodontic Clinics
- 9.1. Market Analysis, Insights and Forecast - by Age
- 10. South America Invisalign Market Analysis, Insights and Forecast, 2019-2031
- 10.1. Market Analysis, Insights and Forecast - by Age
- 10.1.1. Adult
- 10.1.2. Teens
- 10.2. Market Analysis, Insights and Forecast - by End User
- 10.2.1. Hospitals
- 10.2.2. Dental and Orthodontic Clinics
- 10.1. Market Analysis, Insights and Forecast - by Age
- 11. North America Invisalign Market Analysis, Insights and Forecast, 2019-2031
- 11.1. Market Analysis, Insights and Forecast - By Country/Sub-region
- 11.1.1 United States
- 11.1.2 Canada
- 11.1.3 Mexico
- 12. Europe Invisalign Market Analysis, Insights and Forecast, 2019-2031
- 12.1. Market Analysis, Insights and Forecast - By Country/Sub-region
- 12.1.1 Germany
- 12.1.2 United Kingdom
- 12.1.3 France
- 12.1.4 Italy
- 12.1.5 Spain
- 12.1.6 Rest of Europe
- 13. Asia Pacific Invisalign Market Analysis, Insights and Forecast, 2019-2031
- 13.1. Market Analysis, Insights and Forecast - By Country/Sub-region
- 13.1.1 China
- 13.1.2 Japan
- 13.1.3 India
- 13.1.4 Australia
- 13.1.5 South Korea
- 13.1.6 Rest of Asia Pacific
- 14. Middle East and Africa Invisalign Market Analysis, Insights and Forecast, 2019-2031
- 14.1. Market Analysis, Insights and Forecast - By Country/Sub-region
- 14.1.1 GCC
- 14.1.2 South Africa
- 14.1.3 Rest of Middle East and Africa
- 15. South America Invisalign Market Analysis, Insights and Forecast, 2019-2031
- 15.1. Market Analysis, Insights and Forecast - By Country/Sub-region
- 15.1.1 Brazil
- 15.1.2 Argentina
- 15.1.3 Rest of South America
- 16. Competitive Analysis
- 16.1. Global Market Share Analysis 2024
- 16.2. Company Profiles
- 16.2.1 Henry Schein Inc
- 16.2.1.1. Overview
- 16.2.1.2. Products
- 16.2.1.3. SWOT Analysis
- 16.2.1.4. Recent Developments
- 16.2.1.5. Financials (Based on Availability)
- 16.2.2 3Shape A/S
- 16.2.2.1. Overview
- 16.2.2.2. Products
- 16.2.2.3. SWOT Analysis
- 16.2.2.4. Recent Developments
- 16.2.2.5. Financials (Based on Availability)
- 16.2.3 Dentsply Sirona
- 16.2.3.1. Overview
- 16.2.3.2. Products
- 16.2.3.3. SWOT Analysis
- 16.2.3.4. Recent Developments
- 16.2.3.5. Financials (Based on Availability)
- 16.2.4 3M Company
- 16.2.4.1. Overview
- 16.2.4.2. Products
- 16.2.4.3. SWOT Analysis
- 16.2.4.4. Recent Developments
- 16.2.4.5. Financials (Based on Availability)
- 16.2.5 Argen Corporation
- 16.2.5.1. Overview
- 16.2.5.2. Products
- 16.2.5.3. SWOT Analysis
- 16.2.5.4. Recent Developments
- 16.2.5.5. Financials (Based on Availability)
- 16.2.6 Angelalign Technology
- 16.2.6.1. Overview
- 16.2.6.2. Products
- 16.2.6.3. SWOT Analysis
- 16.2.6.4. Recent Developments
- 16.2.6.5. Financials (Based on Availability)
- 16.2.7 Align Technology Inc
- 16.2.7.1. Overview
- 16.2.7.2. Products
- 16.2.7.3. SWOT Analysis
- 16.2.7.4. Recent Developments
- 16.2.7.5. Financials (Based on Availability)
- 16.2.8 TP Orthodontics Inc
- 16.2.8.1. Overview
- 16.2.8.2. Products
- 16.2.8.3. SWOT Analysis
- 16.2.8.4. Recent Developments
- 16.2.8.5. Financials (Based on Availability)
- 16.2.9 Patterson Companies Inc
- 16.2.9.1. Overview
- 16.2.9.2. Products
- 16.2.9.3. SWOT Analysis
- 16.2.9.4. Recent Developments
- 16.2.9.5. Financials (Based on Availability)
- 16.2.10 Institut Straumann AG
- 16.2.10.1. Overview
- 16.2.10.2. Products
- 16.2.10.3. SWOT Analysis
- 16.2.10.4. Recent Developments
- 16.2.10.5. Financials (Based on Availability)
- 16.2.1 Henry Schein Inc
List of Figures
- Figure 1: Global Invisalign Market Revenue Breakdown (Million, %) by Region 2024 & 2032
- Figure 2: Global Invisalign Market Volume Breakdown (K Unit, %) by Region 2024 & 2032
- Figure 3: North America Invisalign Market Revenue (Million), by Country 2024 & 2032
- Figure 4: North America Invisalign Market Volume (K Unit), by Country 2024 & 2032
- Figure 5: North America Invisalign Market Revenue Share (%), by Country 2024 & 2032
- Figure 6: North America Invisalign Market Volume Share (%), by Country 2024 & 2032
- Figure 7: Europe Invisalign Market Revenue (Million), by Country 2024 & 2032
- Figure 8: Europe Invisalign Market Volume (K Unit), by Country 2024 & 2032
- Figure 9: Europe Invisalign Market Revenue Share (%), by Country 2024 & 2032
- Figure 10: Europe Invisalign Market Volume Share (%), by Country 2024 & 2032
- Figure 11: Asia Pacific Invisalign Market Revenue (Million), by Country 2024 & 2032
- Figure 12: Asia Pacific Invisalign Market Volume (K Unit), by Country 2024 & 2032
- Figure 13: Asia Pacific Invisalign Market Revenue Share (%), by Country 2024 & 2032
- Figure 14: Asia Pacific Invisalign Market Volume Share (%), by Country 2024 & 2032
- Figure 15: Middle East and Africa Invisalign Market Revenue (Million), by Country 2024 & 2032
- Figure 16: Middle East and Africa Invisalign Market Volume (K Unit), by Country 2024 & 2032
- Figure 17: Middle East and Africa Invisalign Market Revenue Share (%), by Country 2024 & 2032
- Figure 18: Middle East and Africa Invisalign Market Volume Share (%), by Country 2024 & 2032
- Figure 19: South America Invisalign Market Revenue (Million), by Country 2024 & 2032
- Figure 20: South America Invisalign Market Volume (K Unit), by Country 2024 & 2032
- Figure 21: South America Invisalign Market Revenue Share (%), by Country 2024 & 2032
- Figure 22: South America Invisalign Market Volume Share (%), by Country 2024 & 2032
- Figure 23: North America Invisalign Market Revenue (Million), by Age 2024 & 2032
- Figure 24: North America Invisalign Market Volume (K Unit), by Age 2024 & 2032
- Figure 25: North America Invisalign Market Revenue Share (%), by Age 2024 & 2032
- Figure 26: North America Invisalign Market Volume Share (%), by Age 2024 & 2032
- Figure 27: North America Invisalign Market Revenue (Million), by End User 2024 & 2032
- Figure 28: North America Invisalign Market Volume (K Unit), by End User 2024 & 2032
- Figure 29: North America Invisalign Market Revenue Share (%), by End User 2024 & 2032
- Figure 30: North America Invisalign Market Volume Share (%), by End User 2024 & 2032
- Figure 31: North America Invisalign Market Revenue (Million), by Country 2024 & 2032
- Figure 32: North America Invisalign Market Volume (K Unit), by Country 2024 & 2032
- Figure 33: North America Invisalign Market Revenue Share (%), by Country 2024 & 2032
- Figure 34: North America Invisalign Market Volume Share (%), by Country 2024 & 2032
- Figure 35: Europe Invisalign Market Revenue (Million), by Age 2024 & 2032
- Figure 36: Europe Invisalign Market Volume (K Unit), by Age 2024 & 2032
- Figure 37: Europe Invisalign Market Revenue Share (%), by Age 2024 & 2032
- Figure 38: Europe Invisalign Market Volume Share (%), by Age 2024 & 2032
- Figure 39: Europe Invisalign Market Revenue (Million), by End User 2024 & 2032
- Figure 40: Europe Invisalign Market Volume (K Unit), by End User 2024 & 2032
- Figure 41: Europe Invisalign Market Revenue Share (%), by End User 2024 & 2032
- Figure 42: Europe Invisalign Market Volume Share (%), by End User 2024 & 2032
- Figure 43: Europe Invisalign Market Revenue (Million), by Country 2024 & 2032
- Figure 44: Europe Invisalign Market Volume (K Unit), by Country 2024 & 2032
- Figure 45: Europe Invisalign Market Revenue Share (%), by Country 2024 & 2032
- Figure 46: Europe Invisalign Market Volume Share (%), by Country 2024 & 2032
- Figure 47: Asia Pacific Invisalign Market Revenue (Million), by Age 2024 & 2032
- Figure 48: Asia Pacific Invisalign Market Volume (K Unit), by Age 2024 & 2032
- Figure 49: Asia Pacific Invisalign Market Revenue Share (%), by Age 2024 & 2032
- Figure 50: Asia Pacific Invisalign Market Volume Share (%), by Age 2024 & 2032
- Figure 51: Asia Pacific Invisalign Market Revenue (Million), by End User 2024 & 2032
- Figure 52: Asia Pacific Invisalign Market Volume (K Unit), by End User 2024 & 2032
- Figure 53: Asia Pacific Invisalign Market Revenue Share (%), by End User 2024 & 2032
- Figure 54: Asia Pacific Invisalign Market Volume Share (%), by End User 2024 & 2032
- Figure 55: Asia Pacific Invisalign Market Revenue (Million), by Country 2024 & 2032
- Figure 56: Asia Pacific Invisalign Market Volume (K Unit), by Country 2024 & 2032
- Figure 57: Asia Pacific Invisalign Market Revenue Share (%), by Country 2024 & 2032
- Figure 58: Asia Pacific Invisalign Market Volume Share (%), by Country 2024 & 2032
- Figure 59: Middle East and Africa Invisalign Market Revenue (Million), by Age 2024 & 2032
- Figure 60: Middle East and Africa Invisalign Market Volume (K Unit), by Age 2024 & 2032
- Figure 61: Middle East and Africa Invisalign Market Revenue Share (%), by Age 2024 & 2032
- Figure 62: Middle East and Africa Invisalign Market Volume Share (%), by Age 2024 & 2032
- Figure 63: Middle East and Africa Invisalign Market Revenue (Million), by End User 2024 & 2032
- Figure 64: Middle East and Africa Invisalign Market Volume (K Unit), by End User 2024 & 2032
- Figure 65: Middle East and Africa Invisalign Market Revenue Share (%), by End User 2024 & 2032
- Figure 66: Middle East and Africa Invisalign Market Volume Share (%), by End User 2024 & 2032
- Figure 67: Middle East and Africa Invisalign Market Revenue (Million), by Country 2024 & 2032
- Figure 68: Middle East and Africa Invisalign Market Volume (K Unit), by Country 2024 & 2032
- Figure 69: Middle East and Africa Invisalign Market Revenue Share (%), by Country 2024 & 2032
- Figure 70: Middle East and Africa Invisalign Market Volume Share (%), by Country 2024 & 2032
- Figure 71: South America Invisalign Market Revenue (Million), by Age 2024 & 2032
- Figure 72: South America Invisalign Market Volume (K Unit), by Age 2024 & 2032
- Figure 73: South America Invisalign Market Revenue Share (%), by Age 2024 & 2032
- Figure 74: South America Invisalign Market Volume Share (%), by Age 2024 & 2032
- Figure 75: South America Invisalign Market Revenue (Million), by End User 2024 & 2032
- Figure 76: South America Invisalign Market Volume (K Unit), by End User 2024 & 2032
- Figure 77: South America Invisalign Market Revenue Share (%), by End User 2024 & 2032
- Figure 78: South America Invisalign Market Volume Share (%), by End User 2024 & 2032
- Figure 79: South America Invisalign Market Revenue (Million), by Country 2024 & 2032
- Figure 80: South America Invisalign Market Volume (K Unit), by Country 2024 & 2032
- Figure 81: South America Invisalign Market Revenue Share (%), by Country 2024 & 2032
- Figure 82: South America Invisalign Market Volume Share (%), by Country 2024 & 2032
List of Tables
- Table 1: Global Invisalign Market Revenue Million Forecast, by Region 2019 & 2032
- Table 2: Global Invisalign Market Volume K Unit Forecast, by Region 2019 & 2032
- Table 3: Global Invisalign Market Revenue Million Forecast, by Age 2019 & 2032
- Table 4: Global Invisalign Market Volume K Unit Forecast, by Age 2019 & 2032
- Table 5: Global Invisalign Market Revenue Million Forecast, by End User 2019 & 2032
- Table 6: Global Invisalign Market Volume K Unit Forecast, by End User 2019 & 2032
- Table 7: Global Invisalign Market Revenue Million Forecast, by Region 2019 & 2032
- Table 8: Global Invisalign Market Volume K Unit Forecast, by Region 2019 & 2032
- Table 9: Global Invisalign Market Revenue Million Forecast, by Country 2019 & 2032
- Table 10: Global Invisalign Market Volume K Unit Forecast, by Country 2019 & 2032
- Table 11: United States Invisalign Market Revenue (Million) Forecast, by Application 2019 & 2032
- Table 12: United States Invisalign Market Volume (K Unit) Forecast, by Application 2019 & 2032
- Table 13: Canada Invisalign Market Revenue (Million) Forecast, by Application 2019 & 2032
- Table 14: Canada Invisalign Market Volume (K Unit) Forecast, by Application 2019 & 2032
- Table 15: Mexico Invisalign Market Revenue (Million) Forecast, by Application 2019 & 2032
- Table 16: Mexico Invisalign Market Volume (K Unit) Forecast, by Application 2019 & 2032
- Table 17: Global Invisalign Market Revenue Million Forecast, by Country 2019 & 2032
- Table 18: Global Invisalign Market Volume K Unit Forecast, by Country 2019 & 2032
- Table 19: Germany Invisalign Market Revenue (Million) Forecast, by Application 2019 & 2032
- Table 20: Germany Invisalign Market Volume (K Unit) Forecast, by Application 2019 & 2032
- Table 21: United Kingdom Invisalign Market Revenue (Million) Forecast, by Application 2019 & 2032
- Table 22: United Kingdom Invisalign Market Volume (K Unit) Forecast, by Application 2019 & 2032
- Table 23: France Invisalign Market Revenue (Million) Forecast, by Application 2019 & 2032
- Table 24: France Invisalign Market Volume (K Unit) Forecast, by Application 2019 & 2032
- Table 25: Italy Invisalign Market Revenue (Million) Forecast, by Application 2019 & 2032
- Table 26: Italy Invisalign Market Volume (K Unit) Forecast, by Application 2019 & 2032
- Table 27: Spain Invisalign Market Revenue (Million) Forecast, by Application 2019 & 2032
- Table 28: Spain Invisalign Market Volume (K Unit) Forecast, by Application 2019 & 2032
- Table 29: Rest of Europe Invisalign Market Revenue (Million) Forecast, by Application 2019 & 2032
- Table 30: Rest of Europe Invisalign Market Volume (K Unit) Forecast, by Application 2019 & 2032
- Table 31: Global Invisalign Market Revenue Million Forecast, by Country 2019 & 2032
- Table 32: Global Invisalign Market Volume K Unit Forecast, by Country 2019 & 2032
- Table 33: China Invisalign Market Revenue (Million) Forecast, by Application 2019 & 2032
- Table 34: China Invisalign Market Volume (K Unit) Forecast, by Application 2019 & 2032
- Table 35: Japan Invisalign Market Revenue (Million) Forecast, by Application 2019 & 2032
- Table 36: Japan Invisalign Market Volume (K Unit) Forecast, by Application 2019 & 2032
- Table 37: India Invisalign Market Revenue (Million) Forecast, by Application 2019 & 2032
- Table 38: India Invisalign Market Volume (K Unit) Forecast, by Application 2019 & 2032
- Table 39: Australia Invisalign Market Revenue (Million) Forecast, by Application 2019 & 2032
- Table 40: Australia Invisalign Market Volume (K Unit) Forecast, by Application 2019 & 2032
- Table 41: South Korea Invisalign Market Revenue (Million) Forecast, by Application 2019 & 2032
- Table 42: South Korea Invisalign Market Volume (K Unit) Forecast, by Application 2019 & 2032
- Table 43: Rest of Asia Pacific Invisalign Market Revenue (Million) Forecast, by Application 2019 & 2032
- Table 44: Rest of Asia Pacific Invisalign Market Volume (K Unit) Forecast, by Application 2019 & 2032
- Table 45: Global Invisalign Market Revenue Million Forecast, by Country 2019 & 2032
- Table 46: Global Invisalign Market Volume K Unit Forecast, by Country 2019 & 2032
- Table 47: GCC Invisalign Market Revenue (Million) Forecast, by Application 2019 & 2032
- Table 48: GCC Invisalign Market Volume (K Unit) Forecast, by Application 2019 & 2032
- Table 49: South Africa Invisalign Market Revenue (Million) Forecast, by Application 2019 & 2032
- Table 50: South Africa Invisalign Market Volume (K Unit) Forecast, by Application 2019 & 2032
- Table 51: Rest of Middle East and Africa Invisalign Market Revenue (Million) Forecast, by Application 2019 & 2032
- Table 52: Rest of Middle East and Africa Invisalign Market Volume (K Unit) Forecast, by Application 2019 & 2032
- Table 53: Global Invisalign Market Revenue Million Forecast, by Country 2019 & 2032
- Table 54: Global Invisalign Market Volume K Unit Forecast, by Country 2019 & 2032
- Table 55: Brazil Invisalign Market Revenue (Million) Forecast, by Application 2019 & 2032
- Table 56: Brazil Invisalign Market Volume (K Unit) Forecast, by Application 2019 & 2032
- Table 57: Argentina Invisalign Market Revenue (Million) Forecast, by Application 2019 & 2032
- Table 58: Argentina Invisalign Market Volume (K Unit) Forecast, by Application 2019 & 2032
- Table 59: Rest of South America Invisalign Market Revenue (Million) Forecast, by Application 2019 & 2032
- Table 60: Rest of South America Invisalign Market Volume (K Unit) Forecast, by Application 2019 & 2032
- Table 61: Global Invisalign Market Revenue Million Forecast, by Age 2019 & 2032
- Table 62: Global Invisalign Market Volume K Unit Forecast, by Age 2019 & 2032
- Table 63: Global Invisalign Market Revenue Million Forecast, by End User 2019 & 2032
- Table 64: Global Invisalign Market Volume K Unit Forecast, by End User 2019 & 2032
- Table 65: Global Invisalign Market Revenue Million Forecast, by Country 2019 & 2032
- Table 66: Global Invisalign Market Volume K Unit Forecast, by Country 2019 & 2032
- Table 67: United States Invisalign Market Revenue (Million) Forecast, by Application 2019 & 2032
- Table 68: United States Invisalign Market Volume (K Unit) Forecast, by Application 2019 & 2032
- Table 69: Canada Invisalign Market Revenue (Million) Forecast, by Application 2019 & 2032
- Table 70: Canada Invisalign Market Volume (K Unit) Forecast, by Application 2019 & 2032
- Table 71: Mexico Invisalign Market Revenue (Million) Forecast, by Application 2019 & 2032
- Table 72: Mexico Invisalign Market Volume (K Unit) Forecast, by Application 2019 & 2032
- Table 73: Global Invisalign Market Revenue Million Forecast, by Age 2019 & 2032
- Table 74: Global Invisalign Market Volume K Unit Forecast, by Age 2019 & 2032
- Table 75: Global Invisalign Market Revenue Million Forecast, by End User 2019 & 2032
- Table 76: Global Invisalign Market Volume K Unit Forecast, by End User 2019 & 2032
- Table 77: Global Invisalign Market Revenue Million Forecast, by Country 2019 & 2032
- Table 78: Global Invisalign Market Volume K Unit Forecast, by Country 2019 & 2032
- Table 79: Germany Invisalign Market Revenue (Million) Forecast, by Application 2019 & 2032
- Table 80: Germany Invisalign Market Volume (K Unit) Forecast, by Application 2019 & 2032
- Table 81: United Kingdom Invisalign Market Revenue (Million) Forecast, by Application 2019 & 2032
- Table 82: United Kingdom Invisalign Market Volume (K Unit) Forecast, by Application 2019 & 2032
- Table 83: France Invisalign Market Revenue (Million) Forecast, by Application 2019 & 2032
- Table 84: France Invisalign Market Volume (K Unit) Forecast, by Application 2019 & 2032
- Table 85: Italy Invisalign Market Revenue (Million) Forecast, by Application 2019 & 2032
- Table 86: Italy Invisalign Market Volume (K Unit) Forecast, by Application 2019 & 2032
- Table 87: Spain Invisalign Market Revenue (Million) Forecast, by Application 2019 & 2032
- Table 88: Spain Invisalign Market Volume (K Unit) Forecast, by Application 2019 & 2032
- Table 89: Rest of Europe Invisalign Market Revenue (Million) Forecast, by Application 2019 & 2032
- Table 90: Rest of Europe Invisalign Market Volume (K Unit) Forecast, by Application 2019 & 2032
- Table 91: Global Invisalign Market Revenue Million Forecast, by Age 2019 & 2032
- Table 92: Global Invisalign Market Volume K Unit Forecast, by Age 2019 & 2032
- Table 93: Global Invisalign Market Revenue Million Forecast, by End User 2019 & 2032
- Table 94: Global Invisalign Market Volume K Unit Forecast, by End User 2019 & 2032
- Table 95: Global Invisalign Market Revenue Million Forecast, by Country 2019 & 2032
- Table 96: Global Invisalign Market Volume K Unit Forecast, by Country 2019 & 2032
- Table 97: China Invisalign Market Revenue (Million) Forecast, by Application 2019 & 2032
- Table 98: China Invisalign Market Volume (K Unit) Forecast, by Application 2019 & 2032
- Table 99: Japan Invisalign Market Revenue (Million) Forecast, by Application 2019 & 2032
- Table 100: Japan Invisalign Market Volume (K Unit) Forecast, by Application 2019 & 2032
- Table 101: India Invisalign Market Revenue (Million) Forecast, by Application 2019 & 2032
- Table 102: India Invisalign Market Volume (K Unit) Forecast, by Application 2019 & 2032
- Table 103: Australia Invisalign Market Revenue (Million) Forecast, by Application 2019 & 2032
- Table 104: Australia Invisalign Market Volume (K Unit) Forecast, by Application 2019 & 2032
- Table 105: South Korea Invisalign Market Revenue (Million) Forecast, by Application 2019 & 2032
- Table 106: South Korea Invisalign Market Volume (K Unit) Forecast, by Application 2019 & 2032
- Table 107: Rest of Asia Pacific Invisalign Market Revenue (Million) Forecast, by Application 2019 & 2032
- Table 108: Rest of Asia Pacific Invisalign Market Volume (K Unit) Forecast, by Application 2019 & 2032
- Table 109: Global Invisalign Market Revenue Million Forecast, by Age 2019 & 2032
- Table 110: Global Invisalign Market Volume K Unit Forecast, by Age 2019 & 2032
- Table 111: Global Invisalign Market Revenue Million Forecast, by End User 2019 & 2032
- Table 112: Global Invisalign Market Volume K Unit Forecast, by End User 2019 & 2032
- Table 113: Global Invisalign Market Revenue Million Forecast, by Country 2019 & 2032
- Table 114: Global Invisalign Market Volume K Unit Forecast, by Country 2019 & 2032
- Table 115: GCC Invisalign Market Revenue (Million) Forecast, by Application 2019 & 2032
- Table 116: GCC Invisalign Market Volume (K Unit) Forecast, by Application 2019 & 2032
- Table 117: South Africa Invisalign Market Revenue (Million) Forecast, by Application 2019 & 2032
- Table 118: South Africa Invisalign Market Volume (K Unit) Forecast, by Application 2019 & 2032
- Table 119: Rest of Middle East and Africa Invisalign Market Revenue (Million) Forecast, by Application 2019 & 2032
- Table 120: Rest of Middle East and Africa Invisalign Market Volume (K Unit) Forecast, by Application 2019 & 2032
- Table 121: Global Invisalign Market Revenue Million Forecast, by Age 2019 & 2032
- Table 122: Global Invisalign Market Volume K Unit Forecast, by Age 2019 & 2032
- Table 123: Global Invisalign Market Revenue Million Forecast, by End User 2019 & 2032
- Table 124: Global Invisalign Market Volume K Unit Forecast, by End User 2019 & 2032
- Table 125: Global Invisalign Market Revenue Million Forecast, by Country 2019 & 2032
- Table 126: Global Invisalign Market Volume K Unit Forecast, by Country 2019 & 2032
- Table 127: Brazil Invisalign Market Revenue (Million) Forecast, by Application 2019 & 2032
- Table 128: Brazil Invisalign Market Volume (K Unit) Forecast, by Application 2019 & 2032
- Table 129: Argentina Invisalign Market Revenue (Million) Forecast, by Application 2019 & 2032
- Table 130: Argentina Invisalign Market Volume (K Unit) Forecast, by Application 2019 & 2032
- Table 131: Rest of South America Invisalign Market Revenue (Million) Forecast, by Application 2019 & 2032
- Table 132: Rest of South America Invisalign Market Volume (K Unit) Forecast, by Application 2019 & 2032
Frequently Asked Questions
1. What is the projected Compound Annual Growth Rate (CAGR) of the Invisalign Market?
The projected CAGR is approximately 24.80%.
2. Which companies are prominent players in the Invisalign Market?
Key companies in the market include Henry Schein Inc, 3Shape A/S, Dentsply Sirona, 3M Company, Argen Corporation, Angelalign Technology, Align Technology Inc, TP Orthodontics Inc, Patterson Companies Inc, Institut Straumann AG.
3. What are the main segments of the Invisalign Market?
The market segments include Age, End User.
4. Can you provide details about the market size?
The market size is estimated to be USD XX Million as of 2022.
5. What are some drivers contributing to market growth?
Increasing Dental Problems like Malocclusions. Crowding. etc.; Rising Digital Technologies in Dentistry.
6. What are the notable trends driving market growth?
Adult Segment is Expected to Have the Significant Market Share.
7. Are there any restraints impacting market growth?
Huge Cost of Clear Aligners.
8. Can you provide examples of recent developments in the market?
August 2022: Orthobrain, an Ohio-based orthodontic growth system, launched SimplyClear, a total solution for orthodontic growth that combines high-quality clear aligners with the proven support model that drives successful orthodontic programs and long-term revenue growth.
9. What pricing options are available for accessing the report?
Pricing options include single-user, multi-user, and enterprise licenses priced at USD 4750, USD 5250, and USD 8750 respectively.
10. Is the market size provided in terms of value or volume?
The market size is provided in terms of value, measured in Million and volume, measured in K Unit.
11. Are there any specific market keywords associated with the report?
Yes, the market keyword associated with the report is "Invisalign Market," which aids in identifying and referencing the specific market segment covered.
12. How do I determine which pricing option suits my needs best?
The pricing options vary based on user requirements and access needs. Individual users may opt for single-user licenses, while businesses requiring broader access may choose multi-user or enterprise licenses for cost-effective access to the report.
13. Are there any additional resources or data provided in the Invisalign Market report?
While the report offers comprehensive insights, it's advisable to review the specific contents or supplementary materials provided to ascertain if additional resources or data are available.
14. How can I stay updated on further developments or reports in the Invisalign Market?
To stay informed about further developments, trends, and reports in the Invisalign Market, consider subscribing to industry newsletters, following relevant companies and organizations, or regularly checking reputable industry news sources and publications.
Methodology
Step 1 - Identification of Relevant Samples Size from Population Database


Step 2 - Approaches for Defining Global Market Size (Value, Volume* & Price*)

Note*: In applicable scenarios
Step 3 - Data Sources
Primary Research
- Web Analytics
- Survey Reports
- Research Institute
- Latest Research Reports
- Opinion Leaders
Secondary Research
- Annual Reports
- White Paper
- Latest Press Release
- Industry Association
- Paid Database
- Investor Presentations

Step 4 - Data Triangulation
Involves using different sources of information in order to increase the validity of a study
These sources are likely to be stakeholders in a program - participants, other researchers, program staff, other community members, and so on.
Then we put all data in single framework & apply various statistical tools to find out the dynamic on the market.
During the analysis stage, feedback from the stakeholder groups would be compared to determine areas of agreement as well as areas of divergence


