
Key Insights
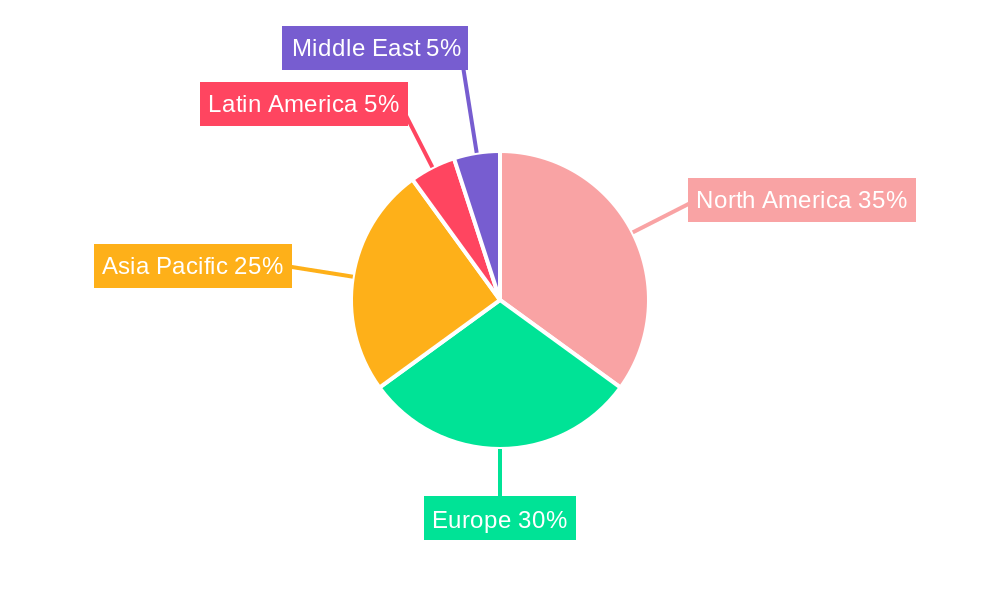
The intrinsically safe equipment market, valued at $3.61 billion in 2025, is projected to experience robust growth, driven by increasing demand across diverse industries. The market's Compound Annual Growth Rate (CAGR) of 7.45% from 2025 to 2033 indicates a significant expansion, fueled by several key factors. The rising adoption of automation and digitization in hazardous environments, particularly within the oil and gas, mining, and chemical sectors, is a primary driver. Stringent safety regulations and increasing awareness of workplace safety are also compelling industries to invest in intrinsically safe equipment, ensuring worker protection and minimizing risks of explosions or fires. Further growth is anticipated from technological advancements, such as the development of more efficient and reliable sensors and improved communication technologies within intrinsically safe systems. Regional variations will likely be observed, with North America and Europe maintaining strong market positions due to established industrial bases and strict safety standards. However, rapid industrialization and infrastructure development in Asia-Pacific are projected to fuel substantial growth in this region over the forecast period. The market segmentation by end-user, zone, class, and product type further underscores the diverse applications and growth potential within specific niches.
The competitive landscape is characterized by a mix of established players and emerging companies. Key players are constantly innovating to offer advanced solutions, focusing on enhanced safety features, improved durability, and more efficient energy consumption. Strategic partnerships, mergers, and acquisitions are expected to shape the market landscape, driving consolidation and fostering technological advancements. Despite the positive growth outlook, challenges such as high initial investment costs and the need for specialized expertise in installation and maintenance could potentially restrain market expansion. However, the long-term benefits of safety and operational efficiency are expected to outweigh these challenges, ensuring sustained growth of the intrinsically safe equipment market throughout the forecast period. The market's future trajectory will be significantly influenced by technological progress, regulatory changes, and evolving industry dynamics across key geographical regions.

Intrinsically Safe Equipment Market: A Comprehensive Report (2019-2033)
This in-depth report provides a comprehensive analysis of the Intrinsically Safe Equipment market, offering valuable insights into market dynamics, competitive landscape, and future growth potential. Covering the period from 2019 to 2033, with a focus on 2025, this report is an essential resource for industry professionals, investors, and anyone seeking to understand this crucial sector. The market is projected to reach xx Million by 2033, exhibiting a significant CAGR of xx% during the forecast period (2025-2033).
Intrinsically Safe Equipment Market Structure & Competitive Dynamics
The intrinsically safe equipment market is characterized by a moderately concentrated landscape with several key players holding significant market share. The market structure is influenced by factors such as stringent regulatory frameworks, technological innovation, and the increasing demand for safety in hazardous environments. Key players engage in intense competition, driven by product differentiation, technological advancements, and strategic partnerships. Market share analysis reveals that R Stahl AG, Honeywell International Inc, and Pepperl + Fuchs are among the leading players, each commanding a substantial portion of the market, although precise figures are proprietary to the full report.
Mergers and acquisitions (M&A) activities play a crucial role in shaping the market dynamics. Over the historical period (2019-2024), the total value of M&A deals in the intrinsically safe equipment sector reached an estimated xx Million, with several significant transactions contributing to market consolidation. These activities are driven by the desire to expand product portfolios, enhance technological capabilities, and gain access to new markets. The report provides a detailed analysis of these transactions and their impact on the market landscape. Innovation ecosystems are crucial for maintaining a competitive edge. Collaboration between manufacturers, research institutions, and end-users plays a vital role in developing advanced technologies and enhancing product safety. The rise of Industry 4.0 and the increasing adoption of IoT devices further contribute to the innovation in the sector. Product substitutes remain limited, given the critical safety requirements of intrinsically safe equipment. End-user trends, however, are significantly shaping the demand for these solutions with preference towards cost-effective, versatile, and technologically advanced devices.
Intrinsically Safe Equipment Market Industry Trends & Insights
The intrinsically safe equipment market is experiencing robust growth, driven by a confluence of factors. Stringent safety regulations across various industries, coupled with the increasing awareness of workplace safety, are key drivers. The expanding use of intrinsically safe equipment in hazardous environments, such as oil and gas, mining, and chemical processing, is fueling market expansion. Technological advancements, particularly in sensor technology, wireless communication, and data analytics, are significantly impacting the market. The integration of IoT and cloud-based solutions enhances data collection, monitoring, and predictive maintenance capabilities, leading to improved operational efficiency and reduced downtime. Consumer preferences are shifting towards solutions offering superior reliability, enhanced safety features, and reduced maintenance requirements. Competitive dynamics are intensely shaped by innovation, pricing strategies, and strategic partnerships. The market shows significant potential in emerging economies with substantial investment in industrial infrastructure. The CAGR of the market is projected to remain xx% over the forecast period (2025-2033), indicating sustained growth. Market penetration in several key regions is also expected to increase significantly with increased infrastructure spending.

Dominant Markets & Segments in Intrinsically Safe Equipment Market
By End User: The Oil and Gas sector currently holds the largest market share, driven by stringent safety regulations and the inherent risks associated with hydrocarbon extraction and processing. The Mining sector also presents a substantial market, owing to the hazardous nature of underground mining operations. The Chemical and Petrochemical industry is another significant contributor due to the potential for explosions and fires in chemical processing plants. Growth is further seen in the power generation sector, given the risk involved in power production, distribution, and maintenance.
By Zone: The exact breakdown by Zone (e.g., Zone 0, Zone 1, Zone 2) is specific to the full report, but the demand varies based on the risk level associated with each zone, with higher risk zones commanding greater investment in intrinsically safe equipment.
By Class: The specific breakdown by Class (e.g., Class I, Class II, Class III) is detailed in the full report, reflecting the varied levels of hazardous atmospheres requiring different safety levels.
By Products: Sensors and detectors hold the largest market share among the product segments, driven by their widespread use in monitoring various parameters in hazardous environments. Transmitters also see a high demand for effective data transmission for remote monitoring. The continued growth of the market is propelled by increasing demand in other product categories such as Isolators and LED indicators due to their improved safety features and reliability in hazardous environments.
Intrinsically Safe Equipment Market Product Innovations
Recent innovations in intrinsically safe equipment focus on enhancing safety, improving reliability, and integrating advanced technologies. Miniaturization of devices, improved wireless communication, and the integration of data analytics capabilities for predictive maintenance are significant trends. Products are designed to meet the ever-evolving safety standards, focusing on simplified operation and ease of maintenance for increased user acceptance. The introduction of IoT-enabled devices enhances real-time monitoring and remote diagnostics, leading to improved operational efficiency and reduced downtime. These innovations cater to the growing market demand for advanced, user-friendly, and cost-effective solutions that meet the stringent safety standards of hazardous environments.
Report Segmentation & Scope
This report segments the intrinsically safe equipment market across various parameters, providing a detailed analysis of each segment. The end-user segment includes Oil and Gas, Mining, Power, Chemical and Petrochemical, Processing, and Other End Users, each with specific growth projections and competitive dynamics. The report also provides a detailed analysis of the market segmented by Zones (specific zones are detailed in the full report), providing insights into the varying risk levels and corresponding demand for intrinsically safe equipment within each zone. Additionally, the report analyses the market according to different equipment classes (Class details in the full report), emphasizing the distinct safety requirements and related market opportunities. Finally, the report also segments the market based on product type, including Sensors, Detectors, Switches, Transmitters, Isolators, LED Indicators, and Others Products, highlighting the growth potential within each product segment.
Key Drivers of Intrinsically Safe Equipment Market Growth
The growth of the intrinsically safe equipment market is primarily fueled by stringent government regulations mandating the use of such equipment in hazardous areas to minimize workplace accidents. The increasing adoption of these equipment across several industrial sectors, including oil & gas, mining, and chemical processing, adds to the market growth. Furthermore, technological advancements, including the integration of IoT and advanced sensors, improve operational efficiency and safety, further stimulating market growth. Economic growth in several developing countries coupled with significant infrastructural investments also bolster the market demand.
Challenges in the Intrinsically Safe Equipment Market Sector
The intrinsically safe equipment market faces several challenges. High initial investment costs can be a barrier to entry for smaller companies. Maintaining a reliable supply chain, especially considering the specialized components involved, presents another hurdle. The market is also subject to stringent regulatory compliance requirements, requiring manufacturers to invest heavily in certifications and approvals. Intense competition from established players further poses a challenge for new entrants. These factors can collectively impact market growth and profitability.
Leading Players in the Intrinsically Safe Equipment Market Market
- R Stahl AG
- Honeywell International Inc (Honeywell International Inc)
- Georgi
- CorDEX Instruments Ltd
- Kyland Technology Co Ltd
- Eaton Corporation PLC (Eaton Corporation PLC)
- Fluke Corporation (Fortive Corporation) (Fluke Corporation)
- Bayco Products Inc
- Banner Engineering Corp (Banner Engineering Corp)
- Pepperl + Fuchs (Pepperl + Fuchs)
- OMEGA Engineering (Spectris PLC) (OMEGA Engineering)
Key Developments in Intrinsically Safe Equipment Market Sector
November 2023: Amazon Inc. launched AWS Monitron, an ML-powered solution for predictive maintenance using wireless sensors, cloud data analysis, and a mobile app. This significantly enhances the capabilities of intrinsically safe equipment monitoring and maintenance.
September 2023: Red Sky Lighting partnered with Daly Middle East to distribute ATEX and IEC compliant lighting solutions across the GCC, expanding the availability of intrinsically safe lighting products in a key region.
Strategic Intrinsically Safe Equipment Market Outlook
The intrinsically safe equipment market is poised for significant growth, driven by technological advancements and increasing safety regulations. Strategic opportunities lie in developing innovative, cost-effective solutions with enhanced features such as IoT integration and predictive maintenance capabilities. Expanding into emerging markets and focusing on specialized applications will be crucial for players to gain a competitive edge. The market's future trajectory is positive, indicating substantial growth potential for companies that can adapt to evolving technologies and meet the growing demand for safer and more efficient equipment in hazardous environments.
Intrinsically Safe Equipment Market Segmentation
-
1. Zone
- 1.1. Zone 0
- 1.2. Zone 20
- 1.3. Zone 1
- 1.4. Zone 21
- 1.5. Zone 22
-
2. Class
- 2.1. Class 1
- 2.2. Class 2
- 2.3. Class 3
-
3. Products
- 3.1. Sensors
- 3.2. Detectors
- 3.3. Switches
- 3.4. Transmitters
- 3.5. Isolators
- 3.6. LED Indicators
- 3.7. Others Products
-
4. End User
- 4.1. Oil and Gas
- 4.2. Mining
- 4.3. Power
- 4.4. Chemical and Petrochemical
- 4.5. Processing
- 4.6. Other End Users
Intrinsically Safe Equipment Market Segmentation By Geography
-
1. North America
- 1.1. United States
- 1.2. Canada
-
2. Europe
- 2.1. Germany
- 2.2. United Kingdom
- 2.3. France
- 2.4. Rest of Europe
-
3. Asia Pacific
- 3.1. China
- 3.2. Japan
- 3.3. India
- 3.4. Rest of Asia Pacific
-
4. Latin America
- 4.1. Brazil
- 4.2. Mexico
- 4.3. Argentina
- 4.4. Rest of Latin America
- 5. Middle East
-
6. Saudi Arabia
- 6.1. United Arab Emirates
- 6.2. Rest of Middle East
Intrinsically Safe Equipment Market REPORT HIGHLIGHTS
| Aspects | Details |
|---|---|
| Study Period | 2019-2033 |
| Base Year | 2024 |
| Estimated Year | 2025 |
| Forecast Period | 2025-2033 |
| Historical Period | 2019-2024 |
| Growth Rate | CAGR of 7.45% from 2019-2033 |
| Segmentation |
|
Table of Contents
- 1. Introduction
- 1.1. Research Scope
- 1.2. Market Segmentation
- 1.3. Research Methodology
- 1.4. Definitions and Assumptions
- 2. Executive Summary
- 2.1. Introduction
- 3. Market Dynamics
- 3.1. Introduction
- 3.2. Market Drivers
- 3.2.1 Increasing Number of Government Regulations; Growing Energy Requirements
- 3.2.2 Driving the Demand for Exploration of New Mines and Oil and Gas Resources
- 3.3. Market Restrains
- 3.3.1. ; High Cost of Energy-efficient Pumps; Fluctuations in the Price of Raw Materials
- 3.4. Market Trends
- 3.4.1. Oil and Gas End User Segment is Expected to Hold a Significant Market Share
- 4. Market Factor Analysis
- 4.1. Porters Five Forces
- 4.2. Supply/Value Chain
- 4.3. PESTEL analysis
- 4.4. Market Entropy
- 4.5. Patent/Trademark Analysis
- 5. Global Intrinsically Safe Equipment Market Analysis, Insights and Forecast, 2019-2031
- 5.1. Market Analysis, Insights and Forecast - by Zone
- 5.1.1. Zone 0
- 5.1.2. Zone 20
- 5.1.3. Zone 1
- 5.1.4. Zone 21
- 5.1.5. Zone 22
- 5.2. Market Analysis, Insights and Forecast - by Class
- 5.2.1. Class 1
- 5.2.2. Class 2
- 5.2.3. Class 3
- 5.3. Market Analysis, Insights and Forecast - by Products
- 5.3.1. Sensors
- 5.3.2. Detectors
- 5.3.3. Switches
- 5.3.4. Transmitters
- 5.3.5. Isolators
- 5.3.6. LED Indicators
- 5.3.7. Others Products
- 5.4. Market Analysis, Insights and Forecast - by End User
- 5.4.1. Oil and Gas
- 5.4.2. Mining
- 5.4.3. Power
- 5.4.4. Chemical and Petrochemical
- 5.4.5. Processing
- 5.4.6. Other End Users
- 5.5. Market Analysis, Insights and Forecast - by Region
- 5.5.1. North America
- 5.5.2. Europe
- 5.5.3. Asia Pacific
- 5.5.4. Latin America
- 5.5.5. Middle East
- 5.5.6. Saudi Arabia
- 5.1. Market Analysis, Insights and Forecast - by Zone
- 6. North America Intrinsically Safe Equipment Market Analysis, Insights and Forecast, 2019-2031
- 6.1. Market Analysis, Insights and Forecast - by Zone
- 6.1.1. Zone 0
- 6.1.2. Zone 20
- 6.1.3. Zone 1
- 6.1.4. Zone 21
- 6.1.5. Zone 22
- 6.2. Market Analysis, Insights and Forecast - by Class
- 6.2.1. Class 1
- 6.2.2. Class 2
- 6.2.3. Class 3
- 6.3. Market Analysis, Insights and Forecast - by Products
- 6.3.1. Sensors
- 6.3.2. Detectors
- 6.3.3. Switches
- 6.3.4. Transmitters
- 6.3.5. Isolators
- 6.3.6. LED Indicators
- 6.3.7. Others Products
- 6.4. Market Analysis, Insights and Forecast - by End User
- 6.4.1. Oil and Gas
- 6.4.2. Mining
- 6.4.3. Power
- 6.4.4. Chemical and Petrochemical
- 6.4.5. Processing
- 6.4.6. Other End Users
- 6.1. Market Analysis, Insights and Forecast - by Zone
- 7. Europe Intrinsically Safe Equipment Market Analysis, Insights and Forecast, 2019-2031
- 7.1. Market Analysis, Insights and Forecast - by Zone
- 7.1.1. Zone 0
- 7.1.2. Zone 20
- 7.1.3. Zone 1
- 7.1.4. Zone 21
- 7.1.5. Zone 22
- 7.2. Market Analysis, Insights and Forecast - by Class
- 7.2.1. Class 1
- 7.2.2. Class 2
- 7.2.3. Class 3
- 7.3. Market Analysis, Insights and Forecast - by Products
- 7.3.1. Sensors
- 7.3.2. Detectors
- 7.3.3. Switches
- 7.3.4. Transmitters
- 7.3.5. Isolators
- 7.3.6. LED Indicators
- 7.3.7. Others Products
- 7.4. Market Analysis, Insights and Forecast - by End User
- 7.4.1. Oil and Gas
- 7.4.2. Mining
- 7.4.3. Power
- 7.4.4. Chemical and Petrochemical
- 7.4.5. Processing
- 7.4.6. Other End Users
- 7.1. Market Analysis, Insights and Forecast - by Zone
- 8. Asia Pacific Intrinsically Safe Equipment Market Analysis, Insights and Forecast, 2019-2031
- 8.1. Market Analysis, Insights and Forecast - by Zone
- 8.1.1. Zone 0
- 8.1.2. Zone 20
- 8.1.3. Zone 1
- 8.1.4. Zone 21
- 8.1.5. Zone 22
- 8.2. Market Analysis, Insights and Forecast - by Class
- 8.2.1. Class 1
- 8.2.2. Class 2
- 8.2.3. Class 3
- 8.3. Market Analysis, Insights and Forecast - by Products
- 8.3.1. Sensors
- 8.3.2. Detectors
- 8.3.3. Switches
- 8.3.4. Transmitters
- 8.3.5. Isolators
- 8.3.6. LED Indicators
- 8.3.7. Others Products
- 8.4. Market Analysis, Insights and Forecast - by End User
- 8.4.1. Oil and Gas
- 8.4.2. Mining
- 8.4.3. Power
- 8.4.4. Chemical and Petrochemical
- 8.4.5. Processing
- 8.4.6. Other End Users
- 8.1. Market Analysis, Insights and Forecast - by Zone
- 9. Latin America Intrinsically Safe Equipment Market Analysis, Insights and Forecast, 2019-2031
- 9.1. Market Analysis, Insights and Forecast - by Zone
- 9.1.1. Zone 0
- 9.1.2. Zone 20
- 9.1.3. Zone 1
- 9.1.4. Zone 21
- 9.1.5. Zone 22
- 9.2. Market Analysis, Insights and Forecast - by Class
- 9.2.1. Class 1
- 9.2.2. Class 2
- 9.2.3. Class 3
- 9.3. Market Analysis, Insights and Forecast - by Products
- 9.3.1. Sensors
- 9.3.2. Detectors
- 9.3.3. Switches
- 9.3.4. Transmitters
- 9.3.5. Isolators
- 9.3.6. LED Indicators
- 9.3.7. Others Products
- 9.4. Market Analysis, Insights and Forecast - by End User
- 9.4.1. Oil and Gas
- 9.4.2. Mining
- 9.4.3. Power
- 9.4.4. Chemical and Petrochemical
- 9.4.5. Processing
- 9.4.6. Other End Users
- 9.1. Market Analysis, Insights and Forecast - by Zone
- 10. Middle East Intrinsically Safe Equipment Market Analysis, Insights and Forecast, 2019-2031
- 10.1. Market Analysis, Insights and Forecast - by Zone
- 10.1.1. Zone 0
- 10.1.2. Zone 20
- 10.1.3. Zone 1
- 10.1.4. Zone 21
- 10.1.5. Zone 22
- 10.2. Market Analysis, Insights and Forecast - by Class
- 10.2.1. Class 1
- 10.2.2. Class 2
- 10.2.3. Class 3
- 10.3. Market Analysis, Insights and Forecast - by Products
- 10.3.1. Sensors
- 10.3.2. Detectors
- 10.3.3. Switches
- 10.3.4. Transmitters
- 10.3.5. Isolators
- 10.3.6. LED Indicators
- 10.3.7. Others Products
- 10.4. Market Analysis, Insights and Forecast - by End User
- 10.4.1. Oil and Gas
- 10.4.2. Mining
- 10.4.3. Power
- 10.4.4. Chemical and Petrochemical
- 10.4.5. Processing
- 10.4.6. Other End Users
- 10.1. Market Analysis, Insights and Forecast - by Zone
- 11. Saudi Arabia Intrinsically Safe Equipment Market Analysis, Insights and Forecast, 2019-2031
- 11.1. Market Analysis, Insights and Forecast - by Zone
- 11.1.1. Zone 0
- 11.1.2. Zone 20
- 11.1.3. Zone 1
- 11.1.4. Zone 21
- 11.1.5. Zone 22
- 11.2. Market Analysis, Insights and Forecast - by Class
- 11.2.1. Class 1
- 11.2.2. Class 2
- 11.2.3. Class 3
- 11.3. Market Analysis, Insights and Forecast - by Products
- 11.3.1. Sensors
- 11.3.2. Detectors
- 11.3.3. Switches
- 11.3.4. Transmitters
- 11.3.5. Isolators
- 11.3.6. LED Indicators
- 11.3.7. Others Products
- 11.4. Market Analysis, Insights and Forecast - by End User
- 11.4.1. Oil and Gas
- 11.4.2. Mining
- 11.4.3. Power
- 11.4.4. Chemical and Petrochemical
- 11.4.5. Processing
- 11.4.6. Other End Users
- 11.1. Market Analysis, Insights and Forecast - by Zone
- 12. North America Intrinsically Safe Equipment Market Analysis, Insights and Forecast, 2019-2031
- 12.1. Market Analysis, Insights and Forecast - By Country/Sub-region
- 12.1.1 United States
- 12.1.2 Canada
- 13. Europe Intrinsically Safe Equipment Market Analysis, Insights and Forecast, 2019-2031
- 13.1. Market Analysis, Insights and Forecast - By Country/Sub-region
- 13.1.1 Germany
- 13.1.2 United Kingdom
- 13.1.3 France
- 13.1.4 Rest of Europe
- 14. Asia Pacific Intrinsically Safe Equipment Market Analysis, Insights and Forecast, 2019-2031
- 14.1. Market Analysis, Insights and Forecast - By Country/Sub-region
- 14.1.1 China
- 14.1.2 Japan
- 14.1.3 India
- 14.1.4 Rest of Asia Pacific
- 15. Latin America Intrinsically Safe Equipment Market Analysis, Insights and Forecast, 2019-2031
- 15.1. Market Analysis, Insights and Forecast - By Country/Sub-region
- 15.1.1 Brazil
- 15.1.2 Mexico
- 15.1.3 Argentina
- 15.1.4 Rest of Latin America
- 16. Middle East Intrinsically Safe Equipment Market Analysis, Insights and Forecast, 2019-2031
- 16.1. Market Analysis, Insights and Forecast - By Country/Sub-region
- 16.1.1.
- 17. Saudi Arabia Intrinsically Safe Equipment Market Analysis, Insights and Forecast, 2019-2031
- 17.1. Market Analysis, Insights and Forecast - By Country/Sub-region
- 17.1.1 United Arab Emirates
- 17.1.2 Rest of Middle East
- 18. Competitive Analysis
- 18.1. Global Market Share Analysis 2024
- 18.2. Company Profiles
- 18.2.1 R Stahl AG
- 18.2.1.1. Overview
- 18.2.1.2. Products
- 18.2.1.3. SWOT Analysis
- 18.2.1.4. Recent Developments
- 18.2.1.5. Financials (Based on Availability)
- 18.2.2 Honeywell International Inc
- 18.2.2.1. Overview
- 18.2.2.2. Products
- 18.2.2.3. SWOT Analysis
- 18.2.2.4. Recent Developments
- 18.2.2.5. Financials (Based on Availability)
- 18.2.3 Georgi
- 18.2.3.1. Overview
- 18.2.3.2. Products
- 18.2.3.3. SWOT Analysis
- 18.2.3.4. Recent Developments
- 18.2.3.5. Financials (Based on Availability)
- 18.2.4 CorDEX Instruments Ltd
- 18.2.4.1. Overview
- 18.2.4.2. Products
- 18.2.4.3. SWOT Analysis
- 18.2.4.4. Recent Developments
- 18.2.4.5. Financials (Based on Availability)
- 18.2.5 Kyland Technology Co Ltd
- 18.2.5.1. Overview
- 18.2.5.2. Products
- 18.2.5.3. SWOT Analysis
- 18.2.5.4. Recent Developments
- 18.2.5.5. Financials (Based on Availability)
- 18.2.6 Eaton Corporation PLC
- 18.2.6.1. Overview
- 18.2.6.2. Products
- 18.2.6.3. SWOT Analysis
- 18.2.6.4. Recent Developments
- 18.2.6.5. Financials (Based on Availability)
- 18.2.7 Fluke Corporation (Fortive Corporation)
- 18.2.7.1. Overview
- 18.2.7.2. Products
- 18.2.7.3. SWOT Analysis
- 18.2.7.4. Recent Developments
- 18.2.7.5. Financials (Based on Availability)
- 18.2.8 Bayco Products Inc
- 18.2.8.1. Overview
- 18.2.8.2. Products
- 18.2.8.3. SWOT Analysis
- 18.2.8.4. Recent Developments
- 18.2.8.5. Financials (Based on Availability)
- 18.2.9 Banner Engineering Corp
- 18.2.9.1. Overview
- 18.2.9.2. Products
- 18.2.9.3. SWOT Analysis
- 18.2.9.4. Recent Developments
- 18.2.9.5. Financials (Based on Availability)
- 18.2.10 Pepperl + Fuchs
- 18.2.10.1. Overview
- 18.2.10.2. Products
- 18.2.10.3. SWOT Analysis
- 18.2.10.4. Recent Developments
- 18.2.10.5. Financials (Based on Availability)
- 18.2.11 OMEGA Engineering (Spectris PLC)
- 18.2.11.1. Overview
- 18.2.11.2. Products
- 18.2.11.3. SWOT Analysis
- 18.2.11.4. Recent Developments
- 18.2.11.5. Financials (Based on Availability)
- 18.2.1 R Stahl AG
List of Figures
- Figure 1: Global Intrinsically Safe Equipment Market Revenue Breakdown (Million, %) by Region 2024 & 2032
- Figure 2: North America Intrinsically Safe Equipment Market Revenue (Million), by Country 2024 & 2032
- Figure 3: North America Intrinsically Safe Equipment Market Revenue Share (%), by Country 2024 & 2032
- Figure 4: Europe Intrinsically Safe Equipment Market Revenue (Million), by Country 2024 & 2032
- Figure 5: Europe Intrinsically Safe Equipment Market Revenue Share (%), by Country 2024 & 2032
- Figure 6: Asia Pacific Intrinsically Safe Equipment Market Revenue (Million), by Country 2024 & 2032
- Figure 7: Asia Pacific Intrinsically Safe Equipment Market Revenue Share (%), by Country 2024 & 2032
- Figure 8: Latin America Intrinsically Safe Equipment Market Revenue (Million), by Country 2024 & 2032
- Figure 9: Latin America Intrinsically Safe Equipment Market Revenue Share (%), by Country 2024 & 2032
- Figure 10: Middle East Intrinsically Safe Equipment Market Revenue (Million), by Country 2024 & 2032
- Figure 11: Middle East Intrinsically Safe Equipment Market Revenue Share (%), by Country 2024 & 2032
- Figure 12: Saudi Arabia Intrinsically Safe Equipment Market Revenue (Million), by Country 2024 & 2032
- Figure 13: Saudi Arabia Intrinsically Safe Equipment Market Revenue Share (%), by Country 2024 & 2032
- Figure 14: North America Intrinsically Safe Equipment Market Revenue (Million), by Zone 2024 & 2032
- Figure 15: North America Intrinsically Safe Equipment Market Revenue Share (%), by Zone 2024 & 2032
- Figure 16: North America Intrinsically Safe Equipment Market Revenue (Million), by Class 2024 & 2032
- Figure 17: North America Intrinsically Safe Equipment Market Revenue Share (%), by Class 2024 & 2032
- Figure 18: North America Intrinsically Safe Equipment Market Revenue (Million), by Products 2024 & 2032
- Figure 19: North America Intrinsically Safe Equipment Market Revenue Share (%), by Products 2024 & 2032
- Figure 20: North America Intrinsically Safe Equipment Market Revenue (Million), by End User 2024 & 2032
- Figure 21: North America Intrinsically Safe Equipment Market Revenue Share (%), by End User 2024 & 2032
- Figure 22: North America Intrinsically Safe Equipment Market Revenue (Million), by Country 2024 & 2032
- Figure 23: North America Intrinsically Safe Equipment Market Revenue Share (%), by Country 2024 & 2032
- Figure 24: Europe Intrinsically Safe Equipment Market Revenue (Million), by Zone 2024 & 2032
- Figure 25: Europe Intrinsically Safe Equipment Market Revenue Share (%), by Zone 2024 & 2032
- Figure 26: Europe Intrinsically Safe Equipment Market Revenue (Million), by Class 2024 & 2032
- Figure 27: Europe Intrinsically Safe Equipment Market Revenue Share (%), by Class 2024 & 2032
- Figure 28: Europe Intrinsically Safe Equipment Market Revenue (Million), by Products 2024 & 2032
- Figure 29: Europe Intrinsically Safe Equipment Market Revenue Share (%), by Products 2024 & 2032
- Figure 30: Europe Intrinsically Safe Equipment Market Revenue (Million), by End User 2024 & 2032
- Figure 31: Europe Intrinsically Safe Equipment Market Revenue Share (%), by End User 2024 & 2032
- Figure 32: Europe Intrinsically Safe Equipment Market Revenue (Million), by Country 2024 & 2032
- Figure 33: Europe Intrinsically Safe Equipment Market Revenue Share (%), by Country 2024 & 2032
- Figure 34: Asia Pacific Intrinsically Safe Equipment Market Revenue (Million), by Zone 2024 & 2032
- Figure 35: Asia Pacific Intrinsically Safe Equipment Market Revenue Share (%), by Zone 2024 & 2032
- Figure 36: Asia Pacific Intrinsically Safe Equipment Market Revenue (Million), by Class 2024 & 2032
- Figure 37: Asia Pacific Intrinsically Safe Equipment Market Revenue Share (%), by Class 2024 & 2032
- Figure 38: Asia Pacific Intrinsically Safe Equipment Market Revenue (Million), by Products 2024 & 2032
- Figure 39: Asia Pacific Intrinsically Safe Equipment Market Revenue Share (%), by Products 2024 & 2032
- Figure 40: Asia Pacific Intrinsically Safe Equipment Market Revenue (Million), by End User 2024 & 2032
- Figure 41: Asia Pacific Intrinsically Safe Equipment Market Revenue Share (%), by End User 2024 & 2032
- Figure 42: Asia Pacific Intrinsically Safe Equipment Market Revenue (Million), by Country 2024 & 2032
- Figure 43: Asia Pacific Intrinsically Safe Equipment Market Revenue Share (%), by Country 2024 & 2032
- Figure 44: Latin America Intrinsically Safe Equipment Market Revenue (Million), by Zone 2024 & 2032
- Figure 45: Latin America Intrinsically Safe Equipment Market Revenue Share (%), by Zone 2024 & 2032
- Figure 46: Latin America Intrinsically Safe Equipment Market Revenue (Million), by Class 2024 & 2032
- Figure 47: Latin America Intrinsically Safe Equipment Market Revenue Share (%), by Class 2024 & 2032
- Figure 48: Latin America Intrinsically Safe Equipment Market Revenue (Million), by Products 2024 & 2032
- Figure 49: Latin America Intrinsically Safe Equipment Market Revenue Share (%), by Products 2024 & 2032
- Figure 50: Latin America Intrinsically Safe Equipment Market Revenue (Million), by End User 2024 & 2032
- Figure 51: Latin America Intrinsically Safe Equipment Market Revenue Share (%), by End User 2024 & 2032
- Figure 52: Latin America Intrinsically Safe Equipment Market Revenue (Million), by Country 2024 & 2032
- Figure 53: Latin America Intrinsically Safe Equipment Market Revenue Share (%), by Country 2024 & 2032
- Figure 54: Middle East Intrinsically Safe Equipment Market Revenue (Million), by Zone 2024 & 2032
- Figure 55: Middle East Intrinsically Safe Equipment Market Revenue Share (%), by Zone 2024 & 2032
- Figure 56: Middle East Intrinsically Safe Equipment Market Revenue (Million), by Class 2024 & 2032
- Figure 57: Middle East Intrinsically Safe Equipment Market Revenue Share (%), by Class 2024 & 2032
- Figure 58: Middle East Intrinsically Safe Equipment Market Revenue (Million), by Products 2024 & 2032
- Figure 59: Middle East Intrinsically Safe Equipment Market Revenue Share (%), by Products 2024 & 2032
- Figure 60: Middle East Intrinsically Safe Equipment Market Revenue (Million), by End User 2024 & 2032
- Figure 61: Middle East Intrinsically Safe Equipment Market Revenue Share (%), by End User 2024 & 2032
- Figure 62: Middle East Intrinsically Safe Equipment Market Revenue (Million), by Country 2024 & 2032
- Figure 63: Middle East Intrinsically Safe Equipment Market Revenue Share (%), by Country 2024 & 2032
- Figure 64: Saudi Arabia Intrinsically Safe Equipment Market Revenue (Million), by Zone 2024 & 2032
- Figure 65: Saudi Arabia Intrinsically Safe Equipment Market Revenue Share (%), by Zone 2024 & 2032
- Figure 66: Saudi Arabia Intrinsically Safe Equipment Market Revenue (Million), by Class 2024 & 2032
- Figure 67: Saudi Arabia Intrinsically Safe Equipment Market Revenue Share (%), by Class 2024 & 2032
- Figure 68: Saudi Arabia Intrinsically Safe Equipment Market Revenue (Million), by Products 2024 & 2032
- Figure 69: Saudi Arabia Intrinsically Safe Equipment Market Revenue Share (%), by Products 2024 & 2032
- Figure 70: Saudi Arabia Intrinsically Safe Equipment Market Revenue (Million), by End User 2024 & 2032
- Figure 71: Saudi Arabia Intrinsically Safe Equipment Market Revenue Share (%), by End User 2024 & 2032
- Figure 72: Saudi Arabia Intrinsically Safe Equipment Market Revenue (Million), by Country 2024 & 2032
- Figure 73: Saudi Arabia Intrinsically Safe Equipment Market Revenue Share (%), by Country 2024 & 2032
List of Tables
- Table 1: Global Intrinsically Safe Equipment Market Revenue Million Forecast, by Region 2019 & 2032
- Table 2: Global Intrinsically Safe Equipment Market Revenue Million Forecast, by Zone 2019 & 2032
- Table 3: Global Intrinsically Safe Equipment Market Revenue Million Forecast, by Class 2019 & 2032
- Table 4: Global Intrinsically Safe Equipment Market Revenue Million Forecast, by Products 2019 & 2032
- Table 5: Global Intrinsically Safe Equipment Market Revenue Million Forecast, by End User 2019 & 2032
- Table 6: Global Intrinsically Safe Equipment Market Revenue Million Forecast, by Region 2019 & 2032
- Table 7: Global Intrinsically Safe Equipment Market Revenue Million Forecast, by Country 2019 & 2032
- Table 8: United States Intrinsically Safe Equipment Market Revenue (Million) Forecast, by Application 2019 & 2032
- Table 9: Canada Intrinsically Safe Equipment Market Revenue (Million) Forecast, by Application 2019 & 2032
- Table 10: Global Intrinsically Safe Equipment Market Revenue Million Forecast, by Country 2019 & 2032
- Table 11: Germany Intrinsically Safe Equipment Market Revenue (Million) Forecast, by Application 2019 & 2032
- Table 12: United Kingdom Intrinsically Safe Equipment Market Revenue (Million) Forecast, by Application 2019 & 2032
- Table 13: France Intrinsically Safe Equipment Market Revenue (Million) Forecast, by Application 2019 & 2032
- Table 14: Rest of Europe Intrinsically Safe Equipment Market Revenue (Million) Forecast, by Application 2019 & 2032
- Table 15: Global Intrinsically Safe Equipment Market Revenue Million Forecast, by Country 2019 & 2032
- Table 16: China Intrinsically Safe Equipment Market Revenue (Million) Forecast, by Application 2019 & 2032
- Table 17: Japan Intrinsically Safe Equipment Market Revenue (Million) Forecast, by Application 2019 & 2032
- Table 18: India Intrinsically Safe Equipment Market Revenue (Million) Forecast, by Application 2019 & 2032
- Table 19: Rest of Asia Pacific Intrinsically Safe Equipment Market Revenue (Million) Forecast, by Application 2019 & 2032
- Table 20: Global Intrinsically Safe Equipment Market Revenue Million Forecast, by Country 2019 & 2032
- Table 21: Brazil Intrinsically Safe Equipment Market Revenue (Million) Forecast, by Application 2019 & 2032
- Table 22: Mexico Intrinsically Safe Equipment Market Revenue (Million) Forecast, by Application 2019 & 2032
- Table 23: Argentina Intrinsically Safe Equipment Market Revenue (Million) Forecast, by Application 2019 & 2032
- Table 24: Rest of Latin America Intrinsically Safe Equipment Market Revenue (Million) Forecast, by Application 2019 & 2032
- Table 25: Global Intrinsically Safe Equipment Market Revenue Million Forecast, by Country 2019 & 2032
- Table 26: Intrinsically Safe Equipment Market Revenue (Million) Forecast, by Application 2019 & 2032
- Table 27: Global Intrinsically Safe Equipment Market Revenue Million Forecast, by Country 2019 & 2032
- Table 28: United Arab Emirates Intrinsically Safe Equipment Market Revenue (Million) Forecast, by Application 2019 & 2032
- Table 29: Rest of Middle East Intrinsically Safe Equipment Market Revenue (Million) Forecast, by Application 2019 & 2032
- Table 30: Global Intrinsically Safe Equipment Market Revenue Million Forecast, by Zone 2019 & 2032
- Table 31: Global Intrinsically Safe Equipment Market Revenue Million Forecast, by Class 2019 & 2032
- Table 32: Global Intrinsically Safe Equipment Market Revenue Million Forecast, by Products 2019 & 2032
- Table 33: Global Intrinsically Safe Equipment Market Revenue Million Forecast, by End User 2019 & 2032
- Table 34: Global Intrinsically Safe Equipment Market Revenue Million Forecast, by Country 2019 & 2032
- Table 35: United States Intrinsically Safe Equipment Market Revenue (Million) Forecast, by Application 2019 & 2032
- Table 36: Canada Intrinsically Safe Equipment Market Revenue (Million) Forecast, by Application 2019 & 2032
- Table 37: Global Intrinsically Safe Equipment Market Revenue Million Forecast, by Zone 2019 & 2032
- Table 38: Global Intrinsically Safe Equipment Market Revenue Million Forecast, by Class 2019 & 2032
- Table 39: Global Intrinsically Safe Equipment Market Revenue Million Forecast, by Products 2019 & 2032
- Table 40: Global Intrinsically Safe Equipment Market Revenue Million Forecast, by End User 2019 & 2032
- Table 41: Global Intrinsically Safe Equipment Market Revenue Million Forecast, by Country 2019 & 2032
- Table 42: Germany Intrinsically Safe Equipment Market Revenue (Million) Forecast, by Application 2019 & 2032
- Table 43: United Kingdom Intrinsically Safe Equipment Market Revenue (Million) Forecast, by Application 2019 & 2032
- Table 44: France Intrinsically Safe Equipment Market Revenue (Million) Forecast, by Application 2019 & 2032
- Table 45: Rest of Europe Intrinsically Safe Equipment Market Revenue (Million) Forecast, by Application 2019 & 2032
- Table 46: Global Intrinsically Safe Equipment Market Revenue Million Forecast, by Zone 2019 & 2032
- Table 47: Global Intrinsically Safe Equipment Market Revenue Million Forecast, by Class 2019 & 2032
- Table 48: Global Intrinsically Safe Equipment Market Revenue Million Forecast, by Products 2019 & 2032
- Table 49: Global Intrinsically Safe Equipment Market Revenue Million Forecast, by End User 2019 & 2032
- Table 50: Global Intrinsically Safe Equipment Market Revenue Million Forecast, by Country 2019 & 2032
- Table 51: China Intrinsically Safe Equipment Market Revenue (Million) Forecast, by Application 2019 & 2032
- Table 52: Japan Intrinsically Safe Equipment Market Revenue (Million) Forecast, by Application 2019 & 2032
- Table 53: India Intrinsically Safe Equipment Market Revenue (Million) Forecast, by Application 2019 & 2032
- Table 54: Rest of Asia Pacific Intrinsically Safe Equipment Market Revenue (Million) Forecast, by Application 2019 & 2032
- Table 55: Global Intrinsically Safe Equipment Market Revenue Million Forecast, by Zone 2019 & 2032
- Table 56: Global Intrinsically Safe Equipment Market Revenue Million Forecast, by Class 2019 & 2032
- Table 57: Global Intrinsically Safe Equipment Market Revenue Million Forecast, by Products 2019 & 2032
- Table 58: Global Intrinsically Safe Equipment Market Revenue Million Forecast, by End User 2019 & 2032
- Table 59: Global Intrinsically Safe Equipment Market Revenue Million Forecast, by Country 2019 & 2032
- Table 60: Brazil Intrinsically Safe Equipment Market Revenue (Million) Forecast, by Application 2019 & 2032
- Table 61: Mexico Intrinsically Safe Equipment Market Revenue (Million) Forecast, by Application 2019 & 2032
- Table 62: Argentina Intrinsically Safe Equipment Market Revenue (Million) Forecast, by Application 2019 & 2032
- Table 63: Rest of Latin America Intrinsically Safe Equipment Market Revenue (Million) Forecast, by Application 2019 & 2032
- Table 64: Global Intrinsically Safe Equipment Market Revenue Million Forecast, by Zone 2019 & 2032
- Table 65: Global Intrinsically Safe Equipment Market Revenue Million Forecast, by Class 2019 & 2032
- Table 66: Global Intrinsically Safe Equipment Market Revenue Million Forecast, by Products 2019 & 2032
- Table 67: Global Intrinsically Safe Equipment Market Revenue Million Forecast, by End User 2019 & 2032
- Table 68: Global Intrinsically Safe Equipment Market Revenue Million Forecast, by Country 2019 & 2032
- Table 69: Global Intrinsically Safe Equipment Market Revenue Million Forecast, by Zone 2019 & 2032
- Table 70: Global Intrinsically Safe Equipment Market Revenue Million Forecast, by Class 2019 & 2032
- Table 71: Global Intrinsically Safe Equipment Market Revenue Million Forecast, by Products 2019 & 2032
- Table 72: Global Intrinsically Safe Equipment Market Revenue Million Forecast, by End User 2019 & 2032
- Table 73: Global Intrinsically Safe Equipment Market Revenue Million Forecast, by Country 2019 & 2032
- Table 74: United Arab Emirates Intrinsically Safe Equipment Market Revenue (Million) Forecast, by Application 2019 & 2032
- Table 75: Rest of Middle East Intrinsically Safe Equipment Market Revenue (Million) Forecast, by Application 2019 & 2032
Frequently Asked Questions
1. What is the projected Compound Annual Growth Rate (CAGR) of the Intrinsically Safe Equipment Market?
The projected CAGR is approximately 7.45%.
2. Which companies are prominent players in the Intrinsically Safe Equipment Market?
Key companies in the market include R Stahl AG, Honeywell International Inc, Georgi, CorDEX Instruments Ltd, Kyland Technology Co Ltd, Eaton Corporation PLC, Fluke Corporation (Fortive Corporation), Bayco Products Inc, Banner Engineering Corp, Pepperl + Fuchs, OMEGA Engineering (Spectris PLC).
3. What are the main segments of the Intrinsically Safe Equipment Market?
The market segments include Zone, Class, Products, End User.
4. Can you provide details about the market size?
The market size is estimated to be USD 3.61 Million as of 2022.
5. What are some drivers contributing to market growth?
Increasing Number of Government Regulations; Growing Energy Requirements. Driving the Demand for Exploration of New Mines and Oil and Gas Resources.
6. What are the notable trends driving market growth?
Oil and Gas End User Segment is Expected to Hold a Significant Market Share.
7. Are there any restraints impacting market growth?
; High Cost of Energy-efficient Pumps; Fluctuations in the Price of Raw Materials.
8. Can you provide examples of recent developments in the market?
November 2023 - Amazon Inc. launched an AWS Monitron solution that uses machine learning (ML) to identify anomalies in industrial equipment for predictive maintenance. It includes wireless sensors for vibration and temperature monitoring; gateways for automatic data transfer to AWS Cloud, a service that analyses the data for anomalies using ML; and an accompanying mobile app to configure the devices and get operating behavior reports and machine failure alerts.
9. What pricing options are available for accessing the report?
Pricing options include single-user, multi-user, and enterprise licenses priced at USD 4750, USD 5250, and USD 8750 respectively.
10. Is the market size provided in terms of value or volume?
The market size is provided in terms of value, measured in Million.
11. Are there any specific market keywords associated with the report?
Yes, the market keyword associated with the report is "Intrinsically Safe Equipment Market," which aids in identifying and referencing the specific market segment covered.
12. How do I determine which pricing option suits my needs best?
The pricing options vary based on user requirements and access needs. Individual users may opt for single-user licenses, while businesses requiring broader access may choose multi-user or enterprise licenses for cost-effective access to the report.
13. Are there any additional resources or data provided in the Intrinsically Safe Equipment Market report?
While the report offers comprehensive insights, it's advisable to review the specific contents or supplementary materials provided to ascertain if additional resources or data are available.
14. How can I stay updated on further developments or reports in the Intrinsically Safe Equipment Market?
To stay informed about further developments, trends, and reports in the Intrinsically Safe Equipment Market, consider subscribing to industry newsletters, following relevant companies and organizations, or regularly checking reputable industry news sources and publications.
Methodology
Step 1 - Identification of Relevant Samples Size from Population Database


Step 2 - Approaches for Defining Global Market Size (Value, Volume* & Price*)

Note*: In applicable scenarios
Step 3 - Data Sources
Primary Research
- Web Analytics
- Survey Reports
- Research Institute
- Latest Research Reports
- Opinion Leaders
Secondary Research
- Annual Reports
- White Paper
- Latest Press Release
- Industry Association
- Paid Database
- Investor Presentations

Step 4 - Data Triangulation
Involves using different sources of information in order to increase the validity of a study
These sources are likely to be stakeholders in a program - participants, other researchers, program staff, other community members, and so on.
Then we put all data in single framework & apply various statistical tools to find out the dynamic on the market.
During the analysis stage, feedback from the stakeholder groups would be compared to determine areas of agreement as well as areas of divergence


