
Key Insights
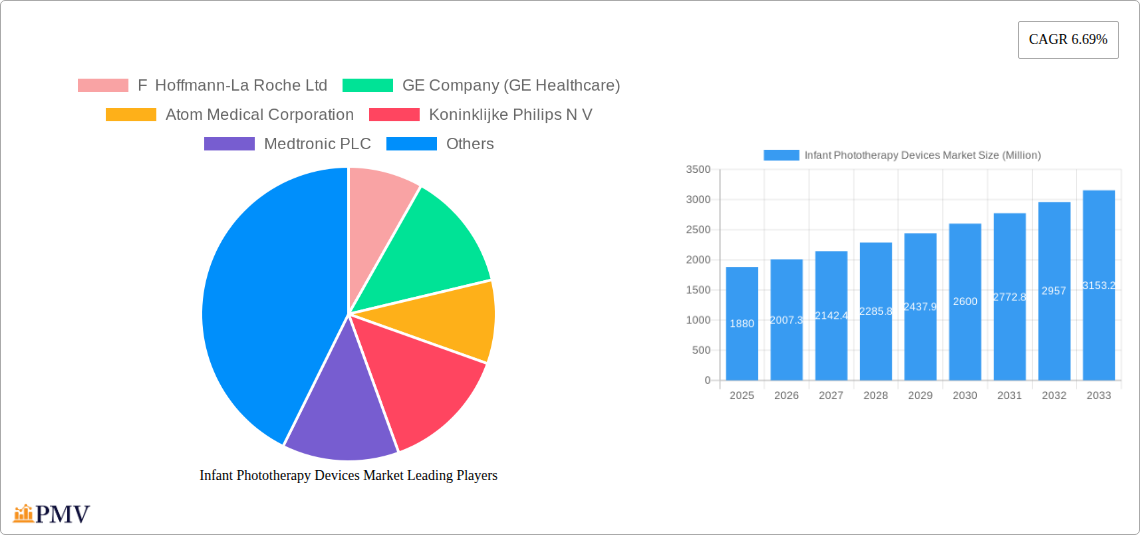
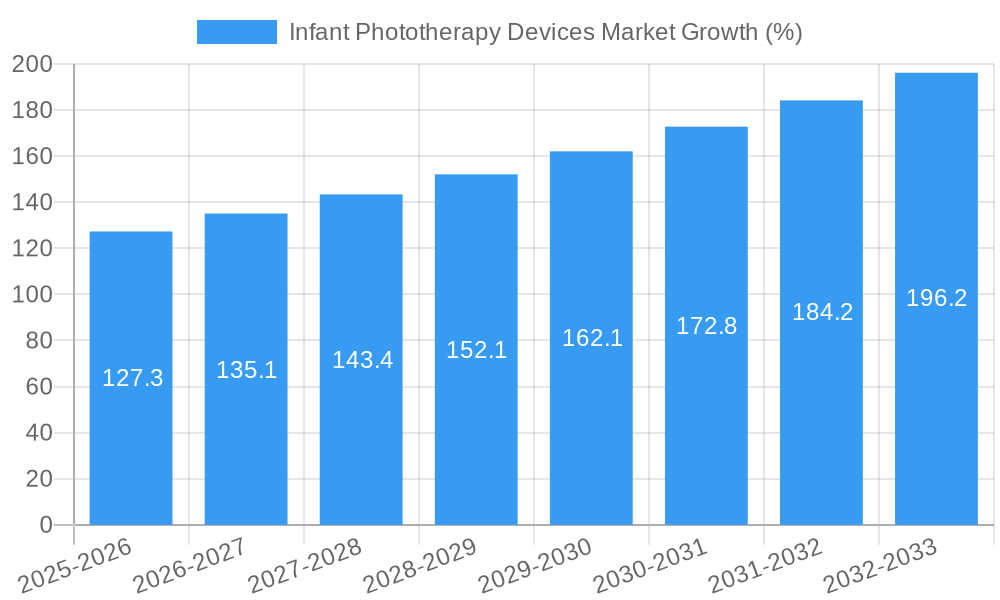
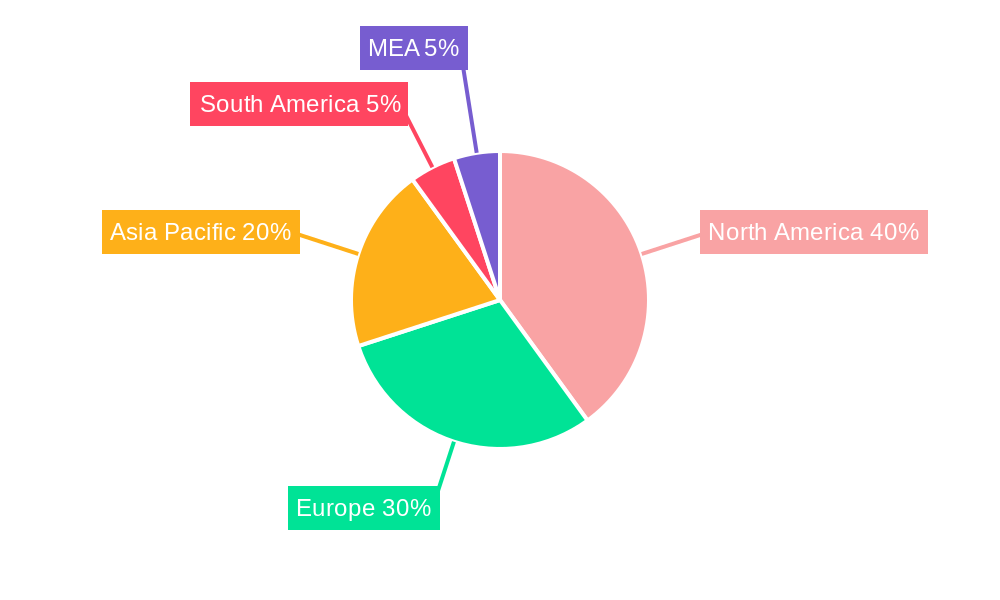
The global infant phototherapy devices market, currently valued at $1.88 billion in 2025, is projected to experience robust growth, driven by a 6.69% CAGR from 2025 to 2033. This expansion is fueled by several key factors. Rising premature birth rates globally necessitate increased neonatal care, significantly boosting demand for phototherapy devices to treat hyperbilirubinemia, a common condition in newborns. Technological advancements leading to the development of more efficient and portable devices, such as LED-based systems, are also contributing to market growth. Furthermore, increasing awareness among healthcare professionals and parents regarding the benefits of early intervention and phototherapy treatment is driving adoption. However, market growth may face some constraints, including the high cost of advanced phototherapy devices and the availability of alternative treatment methods in certain regions. The market is segmented by product type (fetal care equipment and neonatal care equipment), with neonatal care equipment, specifically phototherapy devices, forming the larger segment. Key players like F. Hoffmann-La Roche, GE Healthcare, and Medtronic are shaping the market landscape through continuous innovation and strategic partnerships. Geographic analysis shows strong market presence in North America and Europe, driven by high healthcare expenditure and advanced medical infrastructure. However, Asia-Pacific is expected to witness significant growth in the coming years, fueled by rising birth rates and increasing healthcare investment in developing economies.
The competitive landscape is characterized by a mix of established multinational corporations and specialized medical device manufacturers. These companies are focused on product diversification, strategic collaborations, and technological advancements to enhance market share and cater to the evolving needs of healthcare providers. Future market trends indicate an increasing preference for portable and home-based phototherapy units, which enhance patient comfort and reduce hospital stay durations. The integration of advanced features like real-time bilirubin monitoring and automated intensity control is also expected to propel market growth. The focus on improving treatment efficacy and safety, alongside regulatory approvals for newer technologies, will shape the future trajectory of the infant phototherapy devices market. The market is poised for considerable growth, driven by technological advancements and an increasing global demand for efficient and cost-effective neonatal care solutions.
Infant Phototherapy Devices Market: A Comprehensive Report (2019-2033)
This comprehensive report provides an in-depth analysis of the global Infant Phototherapy Devices market, offering valuable insights for stakeholders across the healthcare industry. The study period spans from 2019 to 2033, with 2025 serving as both the base and estimated year. The forecast period covers 2025-2033, while historical data encompasses 2019-2024. The market is segmented by product type, encompassing Fetal Care Equipment and Neonatal Care Equipment, and geographical regions. Key players analyzed include F Hoffmann-La Roche Ltd, GE Company (GE Healthcare), Atom Medical Corporation, Koninklijke Philips N V, Medtronic PLC, Siemens Healthineers AG, Gentinge AB, Becton Dickinson and Company, Dragerwerk AG & Co KGaA, and Fisher & Paykel Healthcare Ltd. The report projects a market size of xx Million by 2033.
Infant Phototherapy Devices Market Market Structure & Competitive Dynamics
The Infant Phototherapy Devices market exhibits a moderately concentrated structure, with a few major players holding significant market share. The market's competitive landscape is characterized by ongoing innovation, strategic acquisitions, and regulatory compliance. The leading companies invest heavily in R&D to develop advanced phototherapy devices with improved efficacy and user-friendliness.
- Market Concentration: The top five players collectively hold an estimated xx% market share in 2025, indicating moderate concentration. This is expected to slightly decrease to xx% by 2033 due to increased competition from smaller players.
- Innovation Ecosystems: Strong collaborations between device manufacturers, research institutions, and healthcare providers fuel innovation. The focus is on developing portable, efficient, and cost-effective devices.
- Regulatory Frameworks: Stringent regulatory approvals (e.g., FDA, CE marking) influence market entry and product development. Compliance with safety and efficacy standards is paramount.
- Product Substitutes: While no direct substitutes exist, alternative treatments for hyperbilirubinemia could indirectly impact market growth.
- End-User Trends: The increasing prevalence of neonatal jaundice and a growing preference for advanced medical technologies drive market demand.
- M&A Activities: Several strategic mergers and acquisitions have occurred in recent years, with deal values totaling approximately xx Million in the past five years. These activities aim to expand product portfolios and enhance market reach. For example, in 2022, Company A acquired Company B for xx Million, expanding its neonatal care product line.
Infant Phototherapy Devices Market Industry Trends & Insights
The Infant Phototherapy Devices market is experiencing robust growth, driven by several factors. The market is projected to witness a CAGR of xx% during the forecast period (2025-2033). This growth is fueled by a rise in preterm births, increased awareness of neonatal jaundice, technological advancements leading to more efficient and user-friendly devices, and expanding healthcare infrastructure, particularly in developing economies. The market penetration rate for phototherapy devices in neonatal intensive care units (NICUs) is currently estimated at xx% and is projected to increase to xx% by 2033. Furthermore, the rising adoption of LED-based phototherapy devices is transforming the market due to their superior efficacy and energy efficiency. The increasing adoption of telemedicine and remote patient monitoring is also contributing to the growth of the market, allowing for improved patient care and reduced hospital readmissions. Competitive dynamics are shaping the market through continuous product innovation, strategic partnerships, and expansion into emerging markets. The increasing demand for technologically advanced and cost-effective phototherapy devices presents both opportunities and challenges for market players.
Dominant Markets & Segments in Infant Phototherapy Devices Market
North America currently holds the largest market share in the Infant Phototherapy Devices market, followed by Europe. The dominance of these regions is attributed to several factors:
North America:
- High prevalence of preterm births and neonatal jaundice: Leading to increased demand for advanced phototherapy devices.
- Well-established healthcare infrastructure: Facilitating easy market access and adoption of new technologies.
- High healthcare expenditure: Supporting investment in advanced medical equipment.
Europe:
- Rising geriatric population: Indirectly contributing to increased preterm births and neonatal jaundice cases.
- Government initiatives promoting healthcare advancements: Driving market growth.
- Technological advancements in phototherapy device development: Attracting investments from major players.
Within the product type segment, Neonatal Care Equipment holds a significantly larger market share compared to Fetal Care Equipment due to the higher prevalence of neonatal jaundice requiring phototherapy. This segment is expected to maintain its dominance throughout the forecast period. Key drivers of this dominance include:
- Increased awareness and early diagnosis of hyperbilirubinemia: Leading to a higher demand for neonatal phototherapy devices.
- Technological advancements leading to improved device efficacy and safety: Resulting in increased adoption.
- Growing number of neonatal intensive care units (NICUs) globally: Providing increased capacity to utilize phototherapy devices.
Infant Phototherapy Devices Market Product Innovations
Recent innovations in Infant Phototherapy Devices focus on improving device efficacy, portability, and ease of use. LED-based devices are gaining popularity due to their energy efficiency and reduced heat generation. Portable and flexible fiber-optic systems are also emerging, allowing for more comfortable and convenient treatment options. These advancements are expanding market access, leading to higher patient satisfaction and improved treatment outcomes. The integration of smart features like remote monitoring and data analytics is also gaining traction, promising improved efficiency and personalized treatment approaches.
Report Segmentation & Scope
This report segments the Infant Phototherapy Devices market primarily by product type:
Fetal Care Equipment: This segment encompasses devices used during pregnancy for fetal monitoring and care. The market size for this segment is relatively smaller compared to Neonatal Care Equipment, and it is projected to grow at a CAGR of xx% during the forecast period, primarily driven by technological advancements and increased awareness of fetal health monitoring.
Neonatal Care Equipment: This segment constitutes the bulk of the market, including various phototherapy devices for treating neonatal jaundice. It is projected to grow at a CAGR of xx% during the forecast period. The competitive landscape is intensely competitive, with leading players constantly striving to enhance product offerings.
Key Drivers of Infant Phototherapy Devices Market Growth
Several factors fuel the growth of the Infant Phototherapy Devices market. The rising prevalence of neonatal jaundice globally is a primary driver. Technological advancements, leading to more efficient and user-friendly devices, further propel market expansion. Government initiatives and healthcare policies supporting improved neonatal care also play a significant role. Increased healthcare expenditure in developing economies further contributes to market growth by creating a larger demand for affordable yet efficient phototherapy devices.
Challenges in the Infant Phototherapy Devices Market Sector
The market faces challenges such as stringent regulatory requirements that increase product development costs and time to market. Supply chain disruptions can impact device availability and pricing. The high cost of advanced phototherapy devices can limit accessibility in low-income regions. Intense competition from established players also presents a challenge for new entrants. These factors, if not properly managed, can hinder overall market growth.
Leading Players in the Infant Phototherapy Devices Market Market
- F Hoffmann-La Roche Ltd
- GE Company (GE Healthcare)
- Atom Medical Corporation
- Koninklijke Philips N V
- Medtronic PLC
- Siemens Healthineers AG
- Gentinge AB
- Becton Dickinson and Company
- Dragerwerk AG & Co KGaA
- Fisher & Paykel Healthcare Ltd
Key Developments in Infant Phototherapy Devices Market Sector
- 2022 (Q3): Company X launched a new portable LED phototherapy device with improved energy efficiency.
- 2021 (Q4): Company Y announced a strategic partnership with a research institute to develop next-generation phototherapy technologies.
- 2020 (Q1): Company Z received FDA approval for its innovative fiber-optic phototherapy system.
- 2019 (Q2): A significant merger between two leading players expanded the market presence of the combined entity. (Further details on specific companies and mergers would be included in the full report).
Strategic Infant Phototherapy Devices Market Market Outlook
The Infant Phototherapy Devices market is poised for sustained growth driven by continuous technological innovation, increasing awareness of neonatal jaundice, and expanding healthcare infrastructure. Strategic opportunities lie in developing cost-effective, portable, and user-friendly devices, particularly for emerging markets. Focus on integrating smart features like remote monitoring and data analytics can enhance patient care and create new revenue streams. Strategic partnerships and acquisitions will continue to shape the market landscape, leading to a more consolidated yet innovative market.
Infant Phototherapy Devices Market Segmentation
-
1. Product Type
-
1.1. Fetal Care Equipment
- 1.1.1. Fetal Dopplers
- 1.1.2. Fetal Magnetic Resonance Imaging (MRI) Devices
- 1.1.3. Ultrasound Devices
- 1.1.4. Fetal Pulse Oximeters
- 1.1.5. Other Fetal Care Equipment
-
1.2. Neonatal Care Equipment
- 1.2.1. Incubators
- 1.2.2. Neonatal Monitoring Devices
- 1.2.3. Phototherapy Equipment
- 1.2.4. Respiratory Assistance and Monitoring Devices
- 1.2.5. Other Neonatal Care Equipment
-
1.1. Fetal Care Equipment
Infant Phototherapy Devices Market Segmentation By Geography
- 1. Germany
- 2. United Kingdom
- 3. France
- 4. Italy
- 5. Spain
- 6. Rest of Europe
Infant Phototherapy Devices Market REPORT HIGHLIGHTS
| Aspects | Details |
|---|---|
| Study Period | 2019-2033 |
| Base Year | 2024 |
| Estimated Year | 2025 |
| Forecast Period | 2025-2033 |
| Historical Period | 2019-2024 |
| Growth Rate | CAGR of 6.69% from 2019-2033 |
| Segmentation |
|
Table of Contents
- 1. Introduction
- 1.1. Research Scope
- 1.2. Market Segmentation
- 1.3. Research Methodology
- 1.4. Definitions and Assumptions
- 2. Executive Summary
- 2.1. Introduction
- 3. Market Dynamics
- 3.1. Introduction
- 3.2. Market Drivers
- 3.2.1. Increasing Number of Preterm and Low-weight Births; Rise in Demand and Technological Advancement in Infant and Maternal Care Products
- 3.3. Market Restrains
- 3.3.1. High Cost Associated with Neonatal Care; Stringent Regulatory Policies for New Devices Approval
- 3.4. Market Trends
- 3.4.1. Neonatal Monitoring Devices Sub-segment in Neonatal Care Equipment is Expected to Witness the Highest CAGR over the Forecast Period
- 4. Market Factor Analysis
- 4.1. Porters Five Forces
- 4.2. Supply/Value Chain
- 4.3. PESTEL analysis
- 4.4. Market Entropy
- 4.5. Patent/Trademark Analysis
- 5. Global Infant Phototherapy Devices Market Analysis, Insights and Forecast, 2019-2031
- 5.1. Market Analysis, Insights and Forecast - by Product Type
- 5.1.1. Fetal Care Equipment
- 5.1.1.1. Fetal Dopplers
- 5.1.1.2. Fetal Magnetic Resonance Imaging (MRI) Devices
- 5.1.1.3. Ultrasound Devices
- 5.1.1.4. Fetal Pulse Oximeters
- 5.1.1.5. Other Fetal Care Equipment
- 5.1.2. Neonatal Care Equipment
- 5.1.2.1. Incubators
- 5.1.2.2. Neonatal Monitoring Devices
- 5.1.2.3. Phototherapy Equipment
- 5.1.2.4. Respiratory Assistance and Monitoring Devices
- 5.1.2.5. Other Neonatal Care Equipment
- 5.1.1. Fetal Care Equipment
- 5.2. Market Analysis, Insights and Forecast - by Region
- 5.2.1. Germany
- 5.2.2. United Kingdom
- 5.2.3. France
- 5.2.4. Italy
- 5.2.5. Spain
- 5.2.6. Rest of Europe
- 5.1. Market Analysis, Insights and Forecast - by Product Type
- 6. Germany Infant Phototherapy Devices Market Analysis, Insights and Forecast, 2019-2031
- 6.1. Market Analysis, Insights and Forecast - by Product Type
- 6.1.1. Fetal Care Equipment
- 6.1.1.1. Fetal Dopplers
- 6.1.1.2. Fetal Magnetic Resonance Imaging (MRI) Devices
- 6.1.1.3. Ultrasound Devices
- 6.1.1.4. Fetal Pulse Oximeters
- 6.1.1.5. Other Fetal Care Equipment
- 6.1.2. Neonatal Care Equipment
- 6.1.2.1. Incubators
- 6.1.2.2. Neonatal Monitoring Devices
- 6.1.2.3. Phototherapy Equipment
- 6.1.2.4. Respiratory Assistance and Monitoring Devices
- 6.1.2.5. Other Neonatal Care Equipment
- 6.1.1. Fetal Care Equipment
- 6.1. Market Analysis, Insights and Forecast - by Product Type
- 7. United Kingdom Infant Phototherapy Devices Market Analysis, Insights and Forecast, 2019-2031
- 7.1. Market Analysis, Insights and Forecast - by Product Type
- 7.1.1. Fetal Care Equipment
- 7.1.1.1. Fetal Dopplers
- 7.1.1.2. Fetal Magnetic Resonance Imaging (MRI) Devices
- 7.1.1.3. Ultrasound Devices
- 7.1.1.4. Fetal Pulse Oximeters
- 7.1.1.5. Other Fetal Care Equipment
- 7.1.2. Neonatal Care Equipment
- 7.1.2.1. Incubators
- 7.1.2.2. Neonatal Monitoring Devices
- 7.1.2.3. Phototherapy Equipment
- 7.1.2.4. Respiratory Assistance and Monitoring Devices
- 7.1.2.5. Other Neonatal Care Equipment
- 7.1.1. Fetal Care Equipment
- 7.1. Market Analysis, Insights and Forecast - by Product Type
- 8. France Infant Phototherapy Devices Market Analysis, Insights and Forecast, 2019-2031
- 8.1. Market Analysis, Insights and Forecast - by Product Type
- 8.1.1. Fetal Care Equipment
- 8.1.1.1. Fetal Dopplers
- 8.1.1.2. Fetal Magnetic Resonance Imaging (MRI) Devices
- 8.1.1.3. Ultrasound Devices
- 8.1.1.4. Fetal Pulse Oximeters
- 8.1.1.5. Other Fetal Care Equipment
- 8.1.2. Neonatal Care Equipment
- 8.1.2.1. Incubators
- 8.1.2.2. Neonatal Monitoring Devices
- 8.1.2.3. Phototherapy Equipment
- 8.1.2.4. Respiratory Assistance and Monitoring Devices
- 8.1.2.5. Other Neonatal Care Equipment
- 8.1.1. Fetal Care Equipment
- 8.1. Market Analysis, Insights and Forecast - by Product Type
- 9. Italy Infant Phototherapy Devices Market Analysis, Insights and Forecast, 2019-2031
- 9.1. Market Analysis, Insights and Forecast - by Product Type
- 9.1.1. Fetal Care Equipment
- 9.1.1.1. Fetal Dopplers
- 9.1.1.2. Fetal Magnetic Resonance Imaging (MRI) Devices
- 9.1.1.3. Ultrasound Devices
- 9.1.1.4. Fetal Pulse Oximeters
- 9.1.1.5. Other Fetal Care Equipment
- 9.1.2. Neonatal Care Equipment
- 9.1.2.1. Incubators
- 9.1.2.2. Neonatal Monitoring Devices
- 9.1.2.3. Phototherapy Equipment
- 9.1.2.4. Respiratory Assistance and Monitoring Devices
- 9.1.2.5. Other Neonatal Care Equipment
- 9.1.1. Fetal Care Equipment
- 9.1. Market Analysis, Insights and Forecast - by Product Type
- 10. Spain Infant Phototherapy Devices Market Analysis, Insights and Forecast, 2019-2031
- 10.1. Market Analysis, Insights and Forecast - by Product Type
- 10.1.1. Fetal Care Equipment
- 10.1.1.1. Fetal Dopplers
- 10.1.1.2. Fetal Magnetic Resonance Imaging (MRI) Devices
- 10.1.1.3. Ultrasound Devices
- 10.1.1.4. Fetal Pulse Oximeters
- 10.1.1.5. Other Fetal Care Equipment
- 10.1.2. Neonatal Care Equipment
- 10.1.2.1. Incubators
- 10.1.2.2. Neonatal Monitoring Devices
- 10.1.2.3. Phototherapy Equipment
- 10.1.2.4. Respiratory Assistance and Monitoring Devices
- 10.1.2.5. Other Neonatal Care Equipment
- 10.1.1. Fetal Care Equipment
- 10.1. Market Analysis, Insights and Forecast - by Product Type
- 11. Rest of Europe Infant Phototherapy Devices Market Analysis, Insights and Forecast, 2019-2031
- 11.1. Market Analysis, Insights and Forecast - by Product Type
- 11.1.1. Fetal Care Equipment
- 11.1.1.1. Fetal Dopplers
- 11.1.1.2. Fetal Magnetic Resonance Imaging (MRI) Devices
- 11.1.1.3. Ultrasound Devices
- 11.1.1.4. Fetal Pulse Oximeters
- 11.1.1.5. Other Fetal Care Equipment
- 11.1.2. Neonatal Care Equipment
- 11.1.2.1. Incubators
- 11.1.2.2. Neonatal Monitoring Devices
- 11.1.2.3. Phototherapy Equipment
- 11.1.2.4. Respiratory Assistance and Monitoring Devices
- 11.1.2.5. Other Neonatal Care Equipment
- 11.1.1. Fetal Care Equipment
- 11.1. Market Analysis, Insights and Forecast - by Product Type
- 12. North America Infant Phototherapy Devices Market Analysis, Insights and Forecast, 2019-2031
- 12.1. Market Analysis, Insights and Forecast - By Country/Sub-region
- 12.1.1 United States
- 12.1.2 Canada
- 12.1.3 Mexico
- 13. Europe Infant Phototherapy Devices Market Analysis, Insights and Forecast, 2019-2031
- 13.1. Market Analysis, Insights and Forecast - By Country/Sub-region
- 13.1.1 Germany
- 13.1.2 United Kingdom
- 13.1.3 France
- 13.1.4 Spain
- 13.1.5 Italy
- 13.1.6 Spain
- 13.1.7 Belgium
- 13.1.8 Netherland
- 13.1.9 Nordics
- 13.1.10 Rest of Europe
- 14. Asia Pacific Infant Phototherapy Devices Market Analysis, Insights and Forecast, 2019-2031
- 14.1. Market Analysis, Insights and Forecast - By Country/Sub-region
- 14.1.1 China
- 14.1.2 Japan
- 14.1.3 India
- 14.1.4 South Korea
- 14.1.5 Southeast Asia
- 14.1.6 Australia
- 14.1.7 Indonesia
- 14.1.8 Phillipes
- 14.1.9 Singapore
- 14.1.10 Thailandc
- 14.1.11 Rest of Asia Pacific
- 15. South America Infant Phototherapy Devices Market Analysis, Insights and Forecast, 2019-2031
- 15.1. Market Analysis, Insights and Forecast - By Country/Sub-region
- 15.1.1 Brazil
- 15.1.2 Argentina
- 15.1.3 Peru
- 15.1.4 Chile
- 15.1.5 Colombia
- 15.1.6 Ecuador
- 15.1.7 Venezuela
- 15.1.8 Rest of South America
- 16. MEA Infant Phototherapy Devices Market Analysis, Insights and Forecast, 2019-2031
- 16.1. Market Analysis, Insights and Forecast - By Country/Sub-region
- 16.1.1 United Arab Emirates
- 16.1.2 Saudi Arabia
- 16.1.3 South Africa
- 16.1.4 Rest of Middle East and Africa
- 17. Competitive Analysis
- 17.1. Global Market Share Analysis 2024
- 17.2. Company Profiles
- 17.2.1 F Hoffmann-La Roche Ltd
- 17.2.1.1. Overview
- 17.2.1.2. Products
- 17.2.1.3. SWOT Analysis
- 17.2.1.4. Recent Developments
- 17.2.1.5. Financials (Based on Availability)
- 17.2.2 GE Company (GE Healthcare)
- 17.2.2.1. Overview
- 17.2.2.2. Products
- 17.2.2.3. SWOT Analysis
- 17.2.2.4. Recent Developments
- 17.2.2.5. Financials (Based on Availability)
- 17.2.3 Atom Medical Corporation
- 17.2.3.1. Overview
- 17.2.3.2. Products
- 17.2.3.3. SWOT Analysis
- 17.2.3.4. Recent Developments
- 17.2.3.5. Financials (Based on Availability)
- 17.2.4 Koninklijke Philips N V
- 17.2.4.1. Overview
- 17.2.4.2. Products
- 17.2.4.3. SWOT Analysis
- 17.2.4.4. Recent Developments
- 17.2.4.5. Financials (Based on Availability)
- 17.2.5 Medtronic PLC
- 17.2.5.1. Overview
- 17.2.5.2. Products
- 17.2.5.3. SWOT Analysis
- 17.2.5.4. Recent Developments
- 17.2.5.5. Financials (Based on Availability)
- 17.2.6 Siemens Healthineers AG
- 17.2.6.1. Overview
- 17.2.6.2. Products
- 17.2.6.3. SWOT Analysis
- 17.2.6.4. Recent Developments
- 17.2.6.5. Financials (Based on Availability)
- 17.2.7 Gentinge AB
- 17.2.7.1. Overview
- 17.2.7.2. Products
- 17.2.7.3. SWOT Analysis
- 17.2.7.4. Recent Developments
- 17.2.7.5. Financials (Based on Availability)
- 17.2.8 Becton Dickinson and Company
- 17.2.8.1. Overview
- 17.2.8.2. Products
- 17.2.8.3. SWOT Analysis
- 17.2.8.4. Recent Developments
- 17.2.8.5. Financials (Based on Availability)
- 17.2.9 Dragerwerk AG & Co KGaA
- 17.2.9.1. Overview
- 17.2.9.2. Products
- 17.2.9.3. SWOT Analysis
- 17.2.9.4. Recent Developments
- 17.2.9.5. Financials (Based on Availability)
- 17.2.10 Fisher & Paykel Healthcare Ltd
- 17.2.10.1. Overview
- 17.2.10.2. Products
- 17.2.10.3. SWOT Analysis
- 17.2.10.4. Recent Developments
- 17.2.10.5. Financials (Based on Availability)
- 17.2.1 F Hoffmann-La Roche Ltd
List of Figures
- Figure 1: Global Infant Phototherapy Devices Market Revenue Breakdown (Million, %) by Region 2024 & 2032
- Figure 2: Global Infant Phototherapy Devices Market Volume Breakdown (K Unit, %) by Region 2024 & 2032
- Figure 3: North America Infant Phototherapy Devices Market Revenue (Million), by Country 2024 & 2032
- Figure 4: North America Infant Phototherapy Devices Market Volume (K Unit), by Country 2024 & 2032
- Figure 5: North America Infant Phototherapy Devices Market Revenue Share (%), by Country 2024 & 2032
- Figure 6: North America Infant Phototherapy Devices Market Volume Share (%), by Country 2024 & 2032
- Figure 7: Europe Infant Phototherapy Devices Market Revenue (Million), by Country 2024 & 2032
- Figure 8: Europe Infant Phototherapy Devices Market Volume (K Unit), by Country 2024 & 2032
- Figure 9: Europe Infant Phototherapy Devices Market Revenue Share (%), by Country 2024 & 2032
- Figure 10: Europe Infant Phototherapy Devices Market Volume Share (%), by Country 2024 & 2032
- Figure 11: Asia Pacific Infant Phototherapy Devices Market Revenue (Million), by Country 2024 & 2032
- Figure 12: Asia Pacific Infant Phototherapy Devices Market Volume (K Unit), by Country 2024 & 2032
- Figure 13: Asia Pacific Infant Phototherapy Devices Market Revenue Share (%), by Country 2024 & 2032
- Figure 14: Asia Pacific Infant Phototherapy Devices Market Volume Share (%), by Country 2024 & 2032
- Figure 15: South America Infant Phototherapy Devices Market Revenue (Million), by Country 2024 & 2032
- Figure 16: South America Infant Phototherapy Devices Market Volume (K Unit), by Country 2024 & 2032
- Figure 17: South America Infant Phototherapy Devices Market Revenue Share (%), by Country 2024 & 2032
- Figure 18: South America Infant Phototherapy Devices Market Volume Share (%), by Country 2024 & 2032
- Figure 19: MEA Infant Phototherapy Devices Market Revenue (Million), by Country 2024 & 2032
- Figure 20: MEA Infant Phototherapy Devices Market Volume (K Unit), by Country 2024 & 2032
- Figure 21: MEA Infant Phototherapy Devices Market Revenue Share (%), by Country 2024 & 2032
- Figure 22: MEA Infant Phototherapy Devices Market Volume Share (%), by Country 2024 & 2032
- Figure 23: Germany Infant Phototherapy Devices Market Revenue (Million), by Product Type 2024 & 2032
- Figure 24: Germany Infant Phototherapy Devices Market Volume (K Unit), by Product Type 2024 & 2032
- Figure 25: Germany Infant Phototherapy Devices Market Revenue Share (%), by Product Type 2024 & 2032
- Figure 26: Germany Infant Phototherapy Devices Market Volume Share (%), by Product Type 2024 & 2032
- Figure 27: Germany Infant Phototherapy Devices Market Revenue (Million), by Country 2024 & 2032
- Figure 28: Germany Infant Phototherapy Devices Market Volume (K Unit), by Country 2024 & 2032
- Figure 29: Germany Infant Phototherapy Devices Market Revenue Share (%), by Country 2024 & 2032
- Figure 30: Germany Infant Phototherapy Devices Market Volume Share (%), by Country 2024 & 2032
- Figure 31: United Kingdom Infant Phototherapy Devices Market Revenue (Million), by Product Type 2024 & 2032
- Figure 32: United Kingdom Infant Phototherapy Devices Market Volume (K Unit), by Product Type 2024 & 2032
- Figure 33: United Kingdom Infant Phototherapy Devices Market Revenue Share (%), by Product Type 2024 & 2032
- Figure 34: United Kingdom Infant Phototherapy Devices Market Volume Share (%), by Product Type 2024 & 2032
- Figure 35: United Kingdom Infant Phototherapy Devices Market Revenue (Million), by Country 2024 & 2032
- Figure 36: United Kingdom Infant Phototherapy Devices Market Volume (K Unit), by Country 2024 & 2032
- Figure 37: United Kingdom Infant Phototherapy Devices Market Revenue Share (%), by Country 2024 & 2032
- Figure 38: United Kingdom Infant Phototherapy Devices Market Volume Share (%), by Country 2024 & 2032
- Figure 39: France Infant Phototherapy Devices Market Revenue (Million), by Product Type 2024 & 2032
- Figure 40: France Infant Phototherapy Devices Market Volume (K Unit), by Product Type 2024 & 2032
- Figure 41: France Infant Phototherapy Devices Market Revenue Share (%), by Product Type 2024 & 2032
- Figure 42: France Infant Phototherapy Devices Market Volume Share (%), by Product Type 2024 & 2032
- Figure 43: France Infant Phototherapy Devices Market Revenue (Million), by Country 2024 & 2032
- Figure 44: France Infant Phototherapy Devices Market Volume (K Unit), by Country 2024 & 2032
- Figure 45: France Infant Phototherapy Devices Market Revenue Share (%), by Country 2024 & 2032
- Figure 46: France Infant Phototherapy Devices Market Volume Share (%), by Country 2024 & 2032
- Figure 47: Italy Infant Phototherapy Devices Market Revenue (Million), by Product Type 2024 & 2032
- Figure 48: Italy Infant Phototherapy Devices Market Volume (K Unit), by Product Type 2024 & 2032
- Figure 49: Italy Infant Phototherapy Devices Market Revenue Share (%), by Product Type 2024 & 2032
- Figure 50: Italy Infant Phototherapy Devices Market Volume Share (%), by Product Type 2024 & 2032
- Figure 51: Italy Infant Phototherapy Devices Market Revenue (Million), by Country 2024 & 2032
- Figure 52: Italy Infant Phototherapy Devices Market Volume (K Unit), by Country 2024 & 2032
- Figure 53: Italy Infant Phototherapy Devices Market Revenue Share (%), by Country 2024 & 2032
- Figure 54: Italy Infant Phototherapy Devices Market Volume Share (%), by Country 2024 & 2032
- Figure 55: Spain Infant Phototherapy Devices Market Revenue (Million), by Product Type 2024 & 2032
- Figure 56: Spain Infant Phototherapy Devices Market Volume (K Unit), by Product Type 2024 & 2032
- Figure 57: Spain Infant Phototherapy Devices Market Revenue Share (%), by Product Type 2024 & 2032
- Figure 58: Spain Infant Phototherapy Devices Market Volume Share (%), by Product Type 2024 & 2032
- Figure 59: Spain Infant Phototherapy Devices Market Revenue (Million), by Country 2024 & 2032
- Figure 60: Spain Infant Phototherapy Devices Market Volume (K Unit), by Country 2024 & 2032
- Figure 61: Spain Infant Phototherapy Devices Market Revenue Share (%), by Country 2024 & 2032
- Figure 62: Spain Infant Phototherapy Devices Market Volume Share (%), by Country 2024 & 2032
- Figure 63: Rest of Europe Infant Phototherapy Devices Market Revenue (Million), by Product Type 2024 & 2032
- Figure 64: Rest of Europe Infant Phototherapy Devices Market Volume (K Unit), by Product Type 2024 & 2032
- Figure 65: Rest of Europe Infant Phototherapy Devices Market Revenue Share (%), by Product Type 2024 & 2032
- Figure 66: Rest of Europe Infant Phototherapy Devices Market Volume Share (%), by Product Type 2024 & 2032
- Figure 67: Rest of Europe Infant Phototherapy Devices Market Revenue (Million), by Country 2024 & 2032
- Figure 68: Rest of Europe Infant Phototherapy Devices Market Volume (K Unit), by Country 2024 & 2032
- Figure 69: Rest of Europe Infant Phototherapy Devices Market Revenue Share (%), by Country 2024 & 2032
- Figure 70: Rest of Europe Infant Phototherapy Devices Market Volume Share (%), by Country 2024 & 2032
List of Tables
- Table 1: Global Infant Phototherapy Devices Market Revenue Million Forecast, by Region 2019 & 2032
- Table 2: Global Infant Phototherapy Devices Market Volume K Unit Forecast, by Region 2019 & 2032
- Table 3: Global Infant Phototherapy Devices Market Revenue Million Forecast, by Product Type 2019 & 2032
- Table 4: Global Infant Phototherapy Devices Market Volume K Unit Forecast, by Product Type 2019 & 2032
- Table 5: Global Infant Phototherapy Devices Market Revenue Million Forecast, by Region 2019 & 2032
- Table 6: Global Infant Phototherapy Devices Market Volume K Unit Forecast, by Region 2019 & 2032
- Table 7: Global Infant Phototherapy Devices Market Revenue Million Forecast, by Country 2019 & 2032
- Table 8: Global Infant Phototherapy Devices Market Volume K Unit Forecast, by Country 2019 & 2032
- Table 9: United States Infant Phototherapy Devices Market Revenue (Million) Forecast, by Application 2019 & 2032
- Table 10: United States Infant Phototherapy Devices Market Volume (K Unit) Forecast, by Application 2019 & 2032
- Table 11: Canada Infant Phototherapy Devices Market Revenue (Million) Forecast, by Application 2019 & 2032
- Table 12: Canada Infant Phototherapy Devices Market Volume (K Unit) Forecast, by Application 2019 & 2032
- Table 13: Mexico Infant Phototherapy Devices Market Revenue (Million) Forecast, by Application 2019 & 2032
- Table 14: Mexico Infant Phototherapy Devices Market Volume (K Unit) Forecast, by Application 2019 & 2032
- Table 15: Global Infant Phototherapy Devices Market Revenue Million Forecast, by Country 2019 & 2032
- Table 16: Global Infant Phototherapy Devices Market Volume K Unit Forecast, by Country 2019 & 2032
- Table 17: Germany Infant Phototherapy Devices Market Revenue (Million) Forecast, by Application 2019 & 2032
- Table 18: Germany Infant Phototherapy Devices Market Volume (K Unit) Forecast, by Application 2019 & 2032
- Table 19: United Kingdom Infant Phototherapy Devices Market Revenue (Million) Forecast, by Application 2019 & 2032
- Table 20: United Kingdom Infant Phototherapy Devices Market Volume (K Unit) Forecast, by Application 2019 & 2032
- Table 21: France Infant Phototherapy Devices Market Revenue (Million) Forecast, by Application 2019 & 2032
- Table 22: France Infant Phototherapy Devices Market Volume (K Unit) Forecast, by Application 2019 & 2032
- Table 23: Spain Infant Phototherapy Devices Market Revenue (Million) Forecast, by Application 2019 & 2032
- Table 24: Spain Infant Phototherapy Devices Market Volume (K Unit) Forecast, by Application 2019 & 2032
- Table 25: Italy Infant Phototherapy Devices Market Revenue (Million) Forecast, by Application 2019 & 2032
- Table 26: Italy Infant Phototherapy Devices Market Volume (K Unit) Forecast, by Application 2019 & 2032
- Table 27: Spain Infant Phototherapy Devices Market Revenue (Million) Forecast, by Application 2019 & 2032
- Table 28: Spain Infant Phototherapy Devices Market Volume (K Unit) Forecast, by Application 2019 & 2032
- Table 29: Belgium Infant Phototherapy Devices Market Revenue (Million) Forecast, by Application 2019 & 2032
- Table 30: Belgium Infant Phototherapy Devices Market Volume (K Unit) Forecast, by Application 2019 & 2032
- Table 31: Netherland Infant Phototherapy Devices Market Revenue (Million) Forecast, by Application 2019 & 2032
- Table 32: Netherland Infant Phototherapy Devices Market Volume (K Unit) Forecast, by Application 2019 & 2032
- Table 33: Nordics Infant Phototherapy Devices Market Revenue (Million) Forecast, by Application 2019 & 2032
- Table 34: Nordics Infant Phototherapy Devices Market Volume (K Unit) Forecast, by Application 2019 & 2032
- Table 35: Rest of Europe Infant Phototherapy Devices Market Revenue (Million) Forecast, by Application 2019 & 2032
- Table 36: Rest of Europe Infant Phototherapy Devices Market Volume (K Unit) Forecast, by Application 2019 & 2032
- Table 37: Global Infant Phototherapy Devices Market Revenue Million Forecast, by Country 2019 & 2032
- Table 38: Global Infant Phototherapy Devices Market Volume K Unit Forecast, by Country 2019 & 2032
- Table 39: China Infant Phototherapy Devices Market Revenue (Million) Forecast, by Application 2019 & 2032
- Table 40: China Infant Phototherapy Devices Market Volume (K Unit) Forecast, by Application 2019 & 2032
- Table 41: Japan Infant Phototherapy Devices Market Revenue (Million) Forecast, by Application 2019 & 2032
- Table 42: Japan Infant Phototherapy Devices Market Volume (K Unit) Forecast, by Application 2019 & 2032
- Table 43: India Infant Phototherapy Devices Market Revenue (Million) Forecast, by Application 2019 & 2032
- Table 44: India Infant Phototherapy Devices Market Volume (K Unit) Forecast, by Application 2019 & 2032
- Table 45: South Korea Infant Phototherapy Devices Market Revenue (Million) Forecast, by Application 2019 & 2032
- Table 46: South Korea Infant Phototherapy Devices Market Volume (K Unit) Forecast, by Application 2019 & 2032
- Table 47: Southeast Asia Infant Phototherapy Devices Market Revenue (Million) Forecast, by Application 2019 & 2032
- Table 48: Southeast Asia Infant Phototherapy Devices Market Volume (K Unit) Forecast, by Application 2019 & 2032
- Table 49: Australia Infant Phototherapy Devices Market Revenue (Million) Forecast, by Application 2019 & 2032
- Table 50: Australia Infant Phototherapy Devices Market Volume (K Unit) Forecast, by Application 2019 & 2032
- Table 51: Indonesia Infant Phototherapy Devices Market Revenue (Million) Forecast, by Application 2019 & 2032
- Table 52: Indonesia Infant Phototherapy Devices Market Volume (K Unit) Forecast, by Application 2019 & 2032
- Table 53: Phillipes Infant Phototherapy Devices Market Revenue (Million) Forecast, by Application 2019 & 2032
- Table 54: Phillipes Infant Phototherapy Devices Market Volume (K Unit) Forecast, by Application 2019 & 2032
- Table 55: Singapore Infant Phototherapy Devices Market Revenue (Million) Forecast, by Application 2019 & 2032
- Table 56: Singapore Infant Phototherapy Devices Market Volume (K Unit) Forecast, by Application 2019 & 2032
- Table 57: Thailandc Infant Phototherapy Devices Market Revenue (Million) Forecast, by Application 2019 & 2032
- Table 58: Thailandc Infant Phototherapy Devices Market Volume (K Unit) Forecast, by Application 2019 & 2032
- Table 59: Rest of Asia Pacific Infant Phototherapy Devices Market Revenue (Million) Forecast, by Application 2019 & 2032
- Table 60: Rest of Asia Pacific Infant Phototherapy Devices Market Volume (K Unit) Forecast, by Application 2019 & 2032
- Table 61: Global Infant Phototherapy Devices Market Revenue Million Forecast, by Country 2019 & 2032
- Table 62: Global Infant Phototherapy Devices Market Volume K Unit Forecast, by Country 2019 & 2032
- Table 63: Brazil Infant Phototherapy Devices Market Revenue (Million) Forecast, by Application 2019 & 2032
- Table 64: Brazil Infant Phototherapy Devices Market Volume (K Unit) Forecast, by Application 2019 & 2032
- Table 65: Argentina Infant Phototherapy Devices Market Revenue (Million) Forecast, by Application 2019 & 2032
- Table 66: Argentina Infant Phototherapy Devices Market Volume (K Unit) Forecast, by Application 2019 & 2032
- Table 67: Peru Infant Phototherapy Devices Market Revenue (Million) Forecast, by Application 2019 & 2032
- Table 68: Peru Infant Phototherapy Devices Market Volume (K Unit) Forecast, by Application 2019 & 2032
- Table 69: Chile Infant Phototherapy Devices Market Revenue (Million) Forecast, by Application 2019 & 2032
- Table 70: Chile Infant Phototherapy Devices Market Volume (K Unit) Forecast, by Application 2019 & 2032
- Table 71: Colombia Infant Phototherapy Devices Market Revenue (Million) Forecast, by Application 2019 & 2032
- Table 72: Colombia Infant Phototherapy Devices Market Volume (K Unit) Forecast, by Application 2019 & 2032
- Table 73: Ecuador Infant Phototherapy Devices Market Revenue (Million) Forecast, by Application 2019 & 2032
- Table 74: Ecuador Infant Phototherapy Devices Market Volume (K Unit) Forecast, by Application 2019 & 2032
- Table 75: Venezuela Infant Phototherapy Devices Market Revenue (Million) Forecast, by Application 2019 & 2032
- Table 76: Venezuela Infant Phototherapy Devices Market Volume (K Unit) Forecast, by Application 2019 & 2032
- Table 77: Rest of South America Infant Phototherapy Devices Market Revenue (Million) Forecast, by Application 2019 & 2032
- Table 78: Rest of South America Infant Phototherapy Devices Market Volume (K Unit) Forecast, by Application 2019 & 2032
- Table 79: Global Infant Phototherapy Devices Market Revenue Million Forecast, by Country 2019 & 2032
- Table 80: Global Infant Phototherapy Devices Market Volume K Unit Forecast, by Country 2019 & 2032
- Table 81: United Arab Emirates Infant Phototherapy Devices Market Revenue (Million) Forecast, by Application 2019 & 2032
- Table 82: United Arab Emirates Infant Phototherapy Devices Market Volume (K Unit) Forecast, by Application 2019 & 2032
- Table 83: Saudi Arabia Infant Phototherapy Devices Market Revenue (Million) Forecast, by Application 2019 & 2032
- Table 84: Saudi Arabia Infant Phototherapy Devices Market Volume (K Unit) Forecast, by Application 2019 & 2032
- Table 85: South Africa Infant Phototherapy Devices Market Revenue (Million) Forecast, by Application 2019 & 2032
- Table 86: South Africa Infant Phototherapy Devices Market Volume (K Unit) Forecast, by Application 2019 & 2032
- Table 87: Rest of Middle East and Africa Infant Phototherapy Devices Market Revenue (Million) Forecast, by Application 2019 & 2032
- Table 88: Rest of Middle East and Africa Infant Phototherapy Devices Market Volume (K Unit) Forecast, by Application 2019 & 2032
- Table 89: Global Infant Phototherapy Devices Market Revenue Million Forecast, by Product Type 2019 & 2032
- Table 90: Global Infant Phototherapy Devices Market Volume K Unit Forecast, by Product Type 2019 & 2032
- Table 91: Global Infant Phototherapy Devices Market Revenue Million Forecast, by Country 2019 & 2032
- Table 92: Global Infant Phototherapy Devices Market Volume K Unit Forecast, by Country 2019 & 2032
- Table 93: Global Infant Phototherapy Devices Market Revenue Million Forecast, by Product Type 2019 & 2032
- Table 94: Global Infant Phototherapy Devices Market Volume K Unit Forecast, by Product Type 2019 & 2032
- Table 95: Global Infant Phototherapy Devices Market Revenue Million Forecast, by Country 2019 & 2032
- Table 96: Global Infant Phototherapy Devices Market Volume K Unit Forecast, by Country 2019 & 2032
- Table 97: Global Infant Phototherapy Devices Market Revenue Million Forecast, by Product Type 2019 & 2032
- Table 98: Global Infant Phototherapy Devices Market Volume K Unit Forecast, by Product Type 2019 & 2032
- Table 99: Global Infant Phototherapy Devices Market Revenue Million Forecast, by Country 2019 & 2032
- Table 100: Global Infant Phototherapy Devices Market Volume K Unit Forecast, by Country 2019 & 2032
- Table 101: Global Infant Phototherapy Devices Market Revenue Million Forecast, by Product Type 2019 & 2032
- Table 102: Global Infant Phototherapy Devices Market Volume K Unit Forecast, by Product Type 2019 & 2032
- Table 103: Global Infant Phototherapy Devices Market Revenue Million Forecast, by Country 2019 & 2032
- Table 104: Global Infant Phototherapy Devices Market Volume K Unit Forecast, by Country 2019 & 2032
- Table 105: Global Infant Phototherapy Devices Market Revenue Million Forecast, by Product Type 2019 & 2032
- Table 106: Global Infant Phototherapy Devices Market Volume K Unit Forecast, by Product Type 2019 & 2032
- Table 107: Global Infant Phototherapy Devices Market Revenue Million Forecast, by Country 2019 & 2032
- Table 108: Global Infant Phototherapy Devices Market Volume K Unit Forecast, by Country 2019 & 2032
- Table 109: Global Infant Phototherapy Devices Market Revenue Million Forecast, by Product Type 2019 & 2032
- Table 110: Global Infant Phototherapy Devices Market Volume K Unit Forecast, by Product Type 2019 & 2032
- Table 111: Global Infant Phototherapy Devices Market Revenue Million Forecast, by Country 2019 & 2032
- Table 112: Global Infant Phototherapy Devices Market Volume K Unit Forecast, by Country 2019 & 2032
Frequently Asked Questions
1. What is the projected Compound Annual Growth Rate (CAGR) of the Infant Phototherapy Devices Market?
The projected CAGR is approximately 6.69%.
2. Which companies are prominent players in the Infant Phototherapy Devices Market?
Key companies in the market include F Hoffmann-La Roche Ltd, GE Company (GE Healthcare), Atom Medical Corporation, Koninklijke Philips N V, Medtronic PLC, Siemens Healthineers AG, Gentinge AB, Becton Dickinson and Company, Dragerwerk AG & Co KGaA, Fisher & Paykel Healthcare Ltd.
3. What are the main segments of the Infant Phototherapy Devices Market?
The market segments include Product Type.
4. Can you provide details about the market size?
The market size is estimated to be USD 1.88 Million as of 2022.
5. What are some drivers contributing to market growth?
Increasing Number of Preterm and Low-weight Births; Rise in Demand and Technological Advancement in Infant and Maternal Care Products.
6. What are the notable trends driving market growth?
Neonatal Monitoring Devices Sub-segment in Neonatal Care Equipment is Expected to Witness the Highest CAGR over the Forecast Period.
7. Are there any restraints impacting market growth?
High Cost Associated with Neonatal Care; Stringent Regulatory Policies for New Devices Approval.
8. Can you provide examples of recent developments in the market?
N/A
9. What pricing options are available for accessing the report?
Pricing options include single-user, multi-user, and enterprise licenses priced at USD 4750, USD 5250, and USD 8750 respectively.
10. Is the market size provided in terms of value or volume?
The market size is provided in terms of value, measured in Million and volume, measured in K Unit.
11. Are there any specific market keywords associated with the report?
Yes, the market keyword associated with the report is "Infant Phototherapy Devices Market," which aids in identifying and referencing the specific market segment covered.
12. How do I determine which pricing option suits my needs best?
The pricing options vary based on user requirements and access needs. Individual users may opt for single-user licenses, while businesses requiring broader access may choose multi-user or enterprise licenses for cost-effective access to the report.
13. Are there any additional resources or data provided in the Infant Phototherapy Devices Market report?
While the report offers comprehensive insights, it's advisable to review the specific contents or supplementary materials provided to ascertain if additional resources or data are available.
14. How can I stay updated on further developments or reports in the Infant Phototherapy Devices Market?
To stay informed about further developments, trends, and reports in the Infant Phototherapy Devices Market, consider subscribing to industry newsletters, following relevant companies and organizations, or regularly checking reputable industry news sources and publications.
Methodology
Step 1 - Identification of Relevant Samples Size from Population Database


Step 2 - Approaches for Defining Global Market Size (Value, Volume* & Price*)

Note*: In applicable scenarios
Step 3 - Data Sources
Primary Research
- Web Analytics
- Survey Reports
- Research Institute
- Latest Research Reports
- Opinion Leaders
Secondary Research
- Annual Reports
- White Paper
- Latest Press Release
- Industry Association
- Paid Database
- Investor Presentations

Step 4 - Data Triangulation
Involves using different sources of information in order to increase the validity of a study
These sources are likely to be stakeholders in a program - participants, other researchers, program staff, other community members, and so on.
Then we put all data in single framework & apply various statistical tools to find out the dynamic on the market.
During the analysis stage, feedback from the stakeholder groups would be compared to determine areas of agreement as well as areas of divergence


