

Key Insights
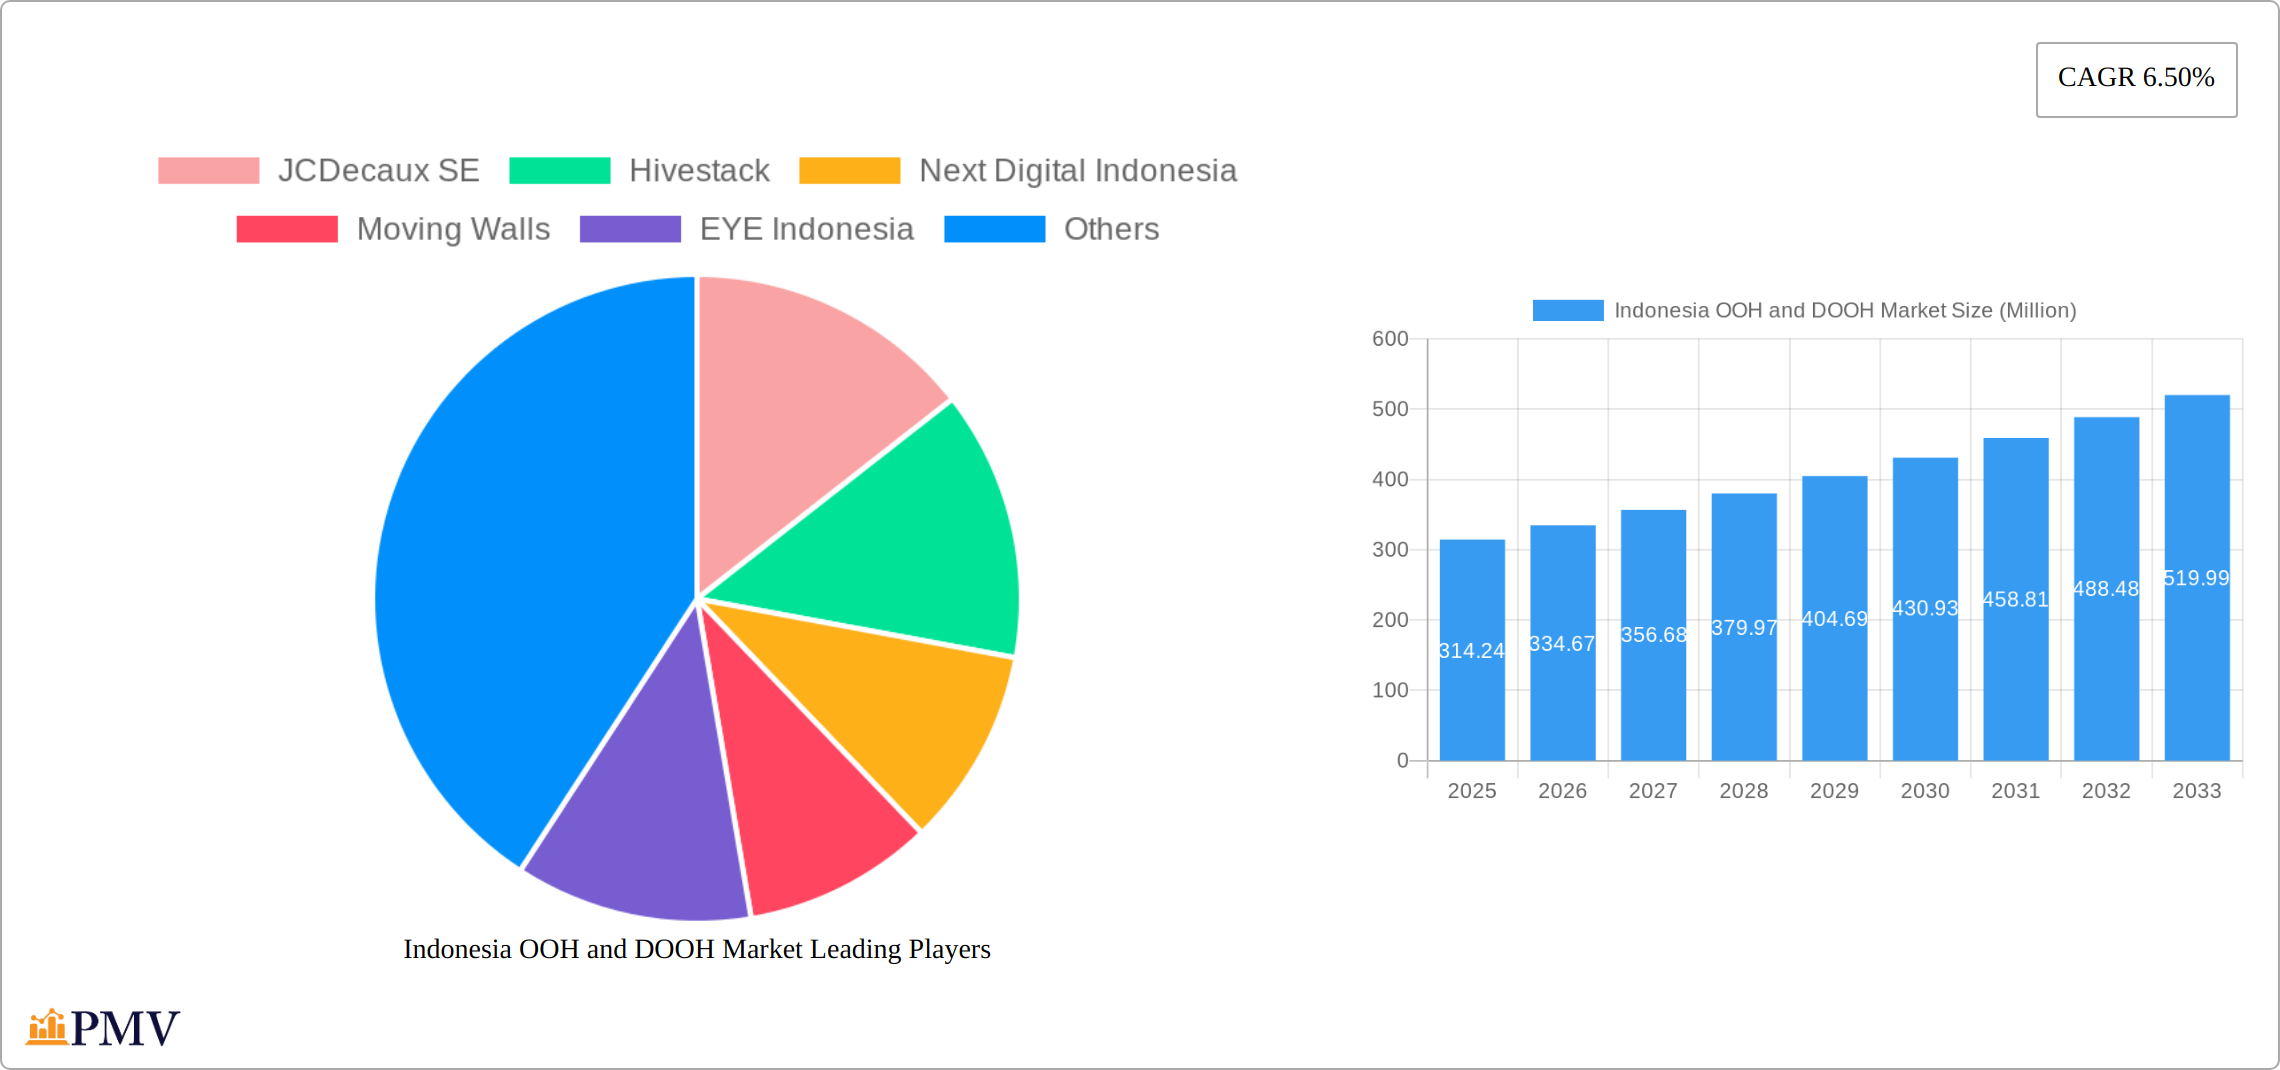
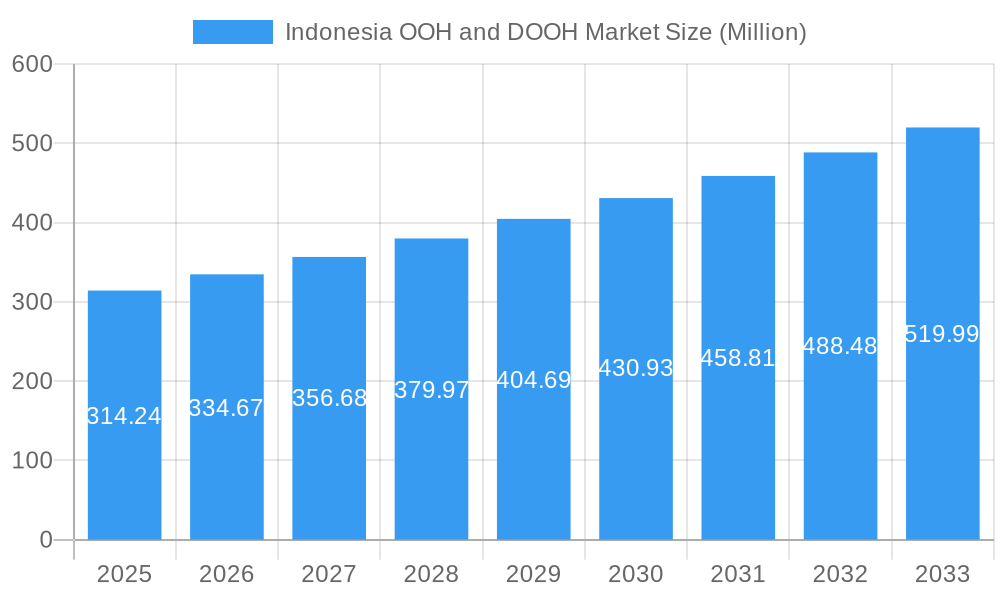
The Indonesian Out-of-Home (OOH) and Digital Out-of-Home (DOOH) advertising market presents a compelling growth opportunity. With a 2025 market size of $314.24 million and a projected Compound Annual Growth Rate (CAGR) of 6.50% from 2025 to 2033, the market is poised for significant expansion. This robust growth is fueled by several key drivers. Increasing smartphone penetration and internet usage in Indonesia are creating a digitally engaged population receptive to DOOH advertising. Furthermore, the rising popularity of experiential marketing and the need for brands to reach consumers beyond digital screens are driving investment in innovative OOH formats. The burgeoning tourism sector and a generally improving economy also contribute positively to ad spending in this sector. However, challenges remain, including competition from other advertising mediums like digital and social media, and the need for more robust data measurement and analytics to demonstrate return on investment. The market is segmented by format (billboards, transit advertising, street furniture, etc.), location (urban vs. rural), and advertiser type. Major players like JCDecaux SE, Hivestack, and Next Digital Indonesia are leveraging technological advancements to enhance the effectiveness and targeting capabilities of their OOH and DOOH campaigns.
Indonesia OOH and DOOH Market Market Size (In Million)
The forecast period (2025-2033) anticipates continued growth, driven by increasing adoption of programmatic DOOH, which enables more precise targeting and real-time campaign optimization. The integration of data analytics into OOH campaigns is expected to improve measurement and accountability, attracting further investment. Furthermore, the creative evolution of OOH formats, incorporating interactive elements and augmented reality, promises to engage consumers in novel ways and further boost market expansion. While competition and the need for improved infrastructure remain considerations, the long-term outlook for the Indonesian OOH and DOOH market is exceptionally positive, offering significant opportunities for both established and emerging players. The market's dynamic nature necessitates a strategic approach by advertisers and providers alike to capitalize on its full potential.
Indonesia OOH and DOOH Market Company Market Share
Indonesia OOH and DOOH Market: A Comprehensive Report (2019-2033)
This detailed report provides a comprehensive analysis of the Indonesia Out-of-Home (OOH) and Digital Out-of-Home (DOOH) advertising market, covering the period from 2019 to 2033. With a focus on market structure, competitive dynamics, industry trends, and future projections, this report is an essential resource for industry professionals, investors, and anyone seeking to understand this dynamic market. The Base Year for this report is 2025, with estimations for 2025 and forecasts extending to 2033. The historical period covered is 2019-2024. The Indonesian OOH and DOOH market is projected to reach xx Million by 2033, exhibiting a significant CAGR of xx%.
Indonesia OOH and DOOH Market Market Structure & Competitive Dynamics
The Indonesian Out-of-Home (OOH) and Digital Out-of-Home (DOOH) market is characterized by a moderately concentrated structure, featuring a dynamic interplay between established industry giants and agile, locally-focused agencies. Market concentration is further influenced by the strategic expansion of multinational corporations alongside the deep-rooted presence of domestic players. The regulatory landscape, while generally conducive to advertising endeavors, is subject to periodic updates that can influence operational costs and strategic planning. A significant trend shaping the market is the accelerating integration of digital technologies, fostering the development of innovative offerings and catering to the evolving preferences of Indonesian consumers. While mergers and acquisitions (M&A) have played a supplementary role in market consolidation, their impact has been less pronounced compared to organic growth strategies. The estimated total value of M&A deals over the past five years has been approximately [Insert Specific M&A Deal Value Here] Million. Leading entities primarily prioritize expanding their reach through organic growth and forging strategic alliances rather than engaging in large-scale acquisitions. The most prominent substitute for OOH and DOOH advertising remains digital advertising, encompassing social media and online platforms, which consistently contend for advertising budgets. End-user behavior increasingly favors targeted, data-driven campaigns, thereby driving a heightened demand for advanced DOOH solutions.
- Market Share: JCDecaux SE commands a significant estimated market share of [Insert JCDecaux Market Share]%, closely followed by Next Digital Indonesia at [Insert Next Digital Indonesia Market Share]%. Other notable contributors include Moving Walls, EYE Indonesia, and Plan B Media Public Company Limited, each holding substantial yet smaller shares. The remaining market is fragmented among a multitude of smaller, specialized agencies.
- M&A Activity: Although not a dominant feature, recent M&A endeavors have predominantly involved the consolidation of smaller entities to bolster their service portfolios and broaden their geographical footprint. The most substantial transaction within the last five years amounted to [Insert Largest M&A Deal Value Here] Million.
- Innovation Ecosystem: The Indonesian OOH and DOOH landscape is abuzz with emerging technologies, including sophisticated programmatic DOOH platforms, immersive augmented reality (AR) integrations, and advanced data analytics tools designed to optimize campaign performance and audience insights.
Indonesia OOH and DOOH Market Industry Trends & Insights
The Indonesian OOH and DOOH market has charted a course of remarkable growth in recent years, propelled by a confluence of factors including rising consumer disposable incomes, accelerated urbanization across the archipelago, and the pervasive expansion of digital connectivity. The Compound Annual Growth Rate (CAGR) for the period spanning 2019-2024 is projected at approximately [Insert CAGR Percentage]%, a figure notably influenced by the market's recovery and adaptation post-pandemic. While the penetration of DOOH is still nascent compared to more developed markets, its adoption is experiencing a rapid acceleration, largely attributed to the increasing integration of smart technologies and the sophisticated deployment of advanced analytics. Consumer preferences are demonstrably shifting towards more engaging, personalized, and interactive advertising experiences, compelling companies to channel investments into cutting-edge DOOH solutions. The competitive arena is characterized by its high dynamism, with market participants actively investing in technological upgrades and forging strategic partnerships to solidify their competitive advantage. The burgeoning adoption of programmatic buying further revolutionizes the market, enabling unprecedented efficiency and precision in targeting specific demographic segments and geographic locations.
Dominant Markets & Segments in Indonesia OOH and DOOH Market
The Jakarta metropolitan area stands as the undisputed epicenter of Indonesia's OOH and DOOH sector, contributing an impressive [Insert Jakarta Market Share]% to the total market revenue. This preeminence is underpinned by several critical factors:
- High Population Density: Jakarta's dense population provides an expansive and concentrated audience, ideal for maximizing the reach and impact of outdoor advertising campaigns.
- High Purchasing Power: The region is home to a significant concentration of high-income individuals, presenting a highly attractive demographic for luxury brands and premium product offerings.
- Extensive Infrastructure: Jakarta's sophisticated road network, robust public transportation systems, and numerous high-traffic shopping malls offer a wealth of prime locations for strategic OOH and DOOH placements.
- Government Support: Proactive government initiatives aimed at fostering urban development and infrastructure enhancement have further catalyzed the growth and integration of the OOH and DOOH market within Jakarta.
While other major urban centers such as Surabaya, Medan, and Bandung contribute substantially to the market, Jakarta maintains its position as the primary driver. Within this dynamic landscape, the transportation sector (encompassing billboards and transit advertising) and the mall-centric DOOH segment are emerging as the fastest-growing areas, capitalizing on consistent high consumer foot traffic.
Indonesia OOH and DOOH Market Product Innovations
Recent product innovations focus heavily on integrating digital technology into traditional OOH. This includes advancements in programmatic DOOH, enabling data-driven targeting and optimization, interactive displays providing engaging user experiences, and the use of augmented reality to enhance brand visibility and create immersive interactions. Furthermore, the integration of smart sensors and analytics platforms provides valuable audience insights, leading to more effective campaign planning and measurement. This combination of technology and data is making OOH advertising more relevant, targeted, and measurable.
Report Segmentation & Scope
This report segments the Indonesian OOH and DOOH market across several key parameters:
- By Format: Billboards, transit advertising, street furniture, mall-based DOOH, digital place-based advertising, etc. Growth projections vary significantly based on format, with DOOH formats experiencing significantly higher growth rates than traditional OOH.
- By Geographic Location: Jakarta, Surabaya, Medan, Bandung, and other major cities. Market size varies considerably across regions, reflecting differences in population density, economic activity, and infrastructure.
- By Advertiser: Retail, FMCG, automotive, entertainment, government, etc. Different advertiser segments exhibit different spending patterns, reflecting their specific marketing needs and priorities. Competitive dynamics within each segment are analysed, highlighting major players and their strategic approaches.
Key Drivers of Indonesia OOH and DOOH Market Growth
The robust expansion of the Indonesian OOH and DOOH market is propelled by a combination of powerful economic and technological forces:
- Rapid Urbanization: Indonesia's ongoing urban transformation translates into escalating population densities in key metropolitan areas, thereby expanding the potential audience base for outdoor advertising initiatives.
- Rising Disposable Incomes: An uplift in disposable incomes among Indonesian consumers directly correlates with increased advertising expenditure, particularly for visually appealing and impactful media formats.
- Technological Advancements: The progressive integration of digital technologies into OOH advertising significantly enhances targeting precision and campaign measurement capabilities, making the medium increasingly attractive to advertisers seeking demonstrable ROI.
- Government Initiatives: Supportive governmental policies and investments in infrastructure development are creating new and expanded opportunities for the deployment and visibility of OOH and DOOH advertising assets.
Challenges in the Indonesia OOH and DOOH Market Sector
The Indonesian OOH and DOOH market faces several challenges:
- High Infrastructure Costs: Setting up and maintaining OOH infrastructure in Indonesia can be expensive, especially in urban areas.
- Regulatory Hurdles: Navigating the regulatory landscape for advertising can be complex and time-consuming, impacting operational efficiency.
- Competition from Digital Channels: Traditional OOH faces increasing competition from digital advertising platforms like social media and search engines. This competition significantly influences ad spending. The sector requires innovative solutions to retain market share.
Leading Players in the Indonesia OOH and DOOH Market Market
- JCDecaux SE
- Hivestack
- Next Digital Indonesia
- Moving Walls
- EYE Indonesia
- Plan B Media Public Company Limited
- VIOOH
- Vistar Media
- Jaris & K
- Pixel Group
Key Developments in Indonesia OOH and DOOH Market Sector
- July 2024: Magnite, in collaboration with Dentsu Indonesia, launched a programmatic roadblock campaign across Viu, Vidio, and WeTV, achieving 100% share of voice. Nestlé Indonesia leveraged this platform to promote its limited-edition NESCAFÉ Biscuit Coffee. This highlights the growing importance of programmatic DOOH and strategic partnerships.
- April 2024: inDrive partnered with The Perfect Media for an OOH campaign in Jakarta and other cities, also incorporating mall branding at Central Mall Bandar Lampung. This demonstrates the continued relevance of traditional OOH alongside DOOH strategies.
Strategic Indonesia OOH and DOOH Market Market Outlook
The Indonesian OOH and DOOH market holds significant future potential, driven by continued urbanization, rising incomes, and technological advancements. Strategic opportunities exist for companies that can leverage data-driven technologies to enhance targeting and measurement capabilities, providing advertisers with demonstrable ROI. The integration of innovative technologies like AR and interactive displays will play a crucial role in shaping the future of the market. Focusing on data-driven solutions and strategic partnerships will be critical for success in this evolving landscape.
Indonesia OOH and DOOH Market Segmentation
-
1. Type
- 1.1. Static (Traditional) OOH
-
1.2. Digital OOH (LED Screens)
- 1.2.1. Programmatic OOH
- 1.2.2. Other Digital OOH
-
2. Application
- 2.1. Billboard
-
2.2. Transportation (Transit)
- 2.2.1. Airports
- 2.2.2. Other Transportation (Buses, etc.)
- 2.3. Street Furniture
- 2.4. Other Place-based Media
-
3. End-user Industry
- 3.1. Automotive
- 3.2. Retail and Consumer Goods
- 3.3. Healthcare
- 3.4. BFSI
- 3.5. Other End-user Industries
Indonesia OOH and DOOH Market Segmentation By Geography
- 1. Indonesia
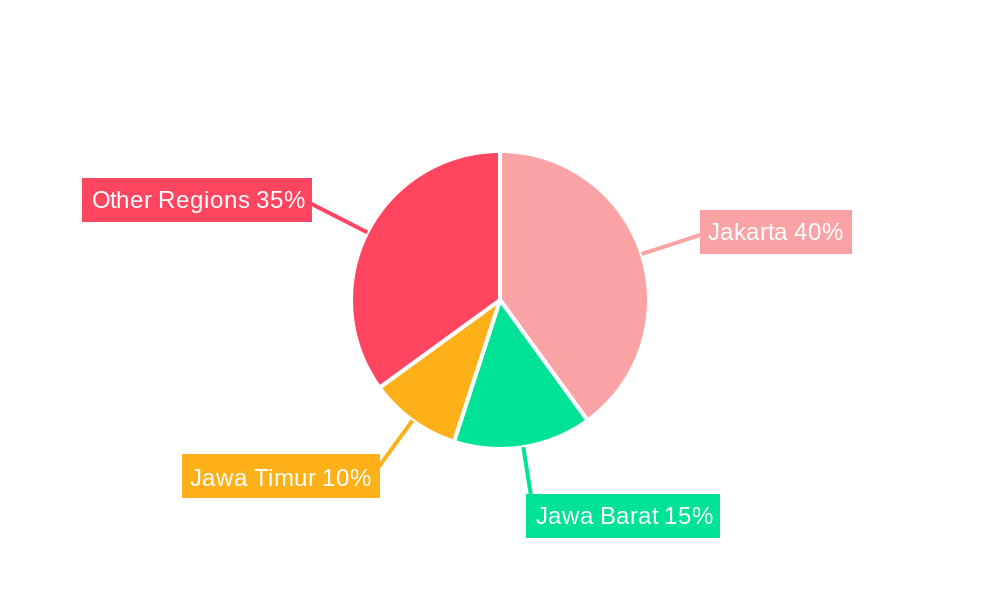
Indonesia OOH and DOOH Market Regional Market Share
Geographic Coverage of Indonesia OOH and DOOH Market
Indonesia OOH and DOOH Market REPORT HIGHLIGHTS
| Aspects | Details |
|---|---|
| Study Period | 2020-2034 |
| Base Year | 2025 |
| Estimated Year | 2026 |
| Forecast Period | 2026-2034 |
| Historical Period | 2020-2025 |
| Growth Rate | CAGR of 6.50% from 2020-2034 |
| Segmentation |
|
Table of Contents
- 1. Introduction
- 1.1. Research Scope
- 1.2. Market Segmentation
- 1.3. Research Objective
- 1.4. Definitions and Assumptions
- 2. Executive Summary
- 2.1. Market Snapshot
- 3. Market Dynamics
- 3.1. Market Drivers
- 3.2. Market Restrains
- 3.3. Market Trends
- 3.4. Market Opportunities
- 4. Market Factor Analysis
- 4.1. Porters Five Forces
- 4.1.1. Bargaining Power of Suppliers
- 4.1.2. Bargaining Power of Buyers
- 4.1.3. Threat of New Entrants
- 4.1.4. Threat of Substitutes
- 4.1.5. Competitive Rivalry
- 4.2. PESTEL analysis
- 4.3. BCG Analysis
- 4.3.1. Stars (High Growth, High Market Share)
- 4.3.2. Cash Cows (Low Growth, High Market Share)
- 4.3.3. Question Mark (High Growth, Low Market Share)
- 4.3.4. Dogs (Low Growth, Low Market Share)
- 4.4. Ansoff Matrix Analysis
- 4.5. Supply Chain Analysis
- 4.6. Regulatory Landscape
- 4.7. Current Market Potential and Opportunity Assessment (TAM–SAM–SOM Framework)
- 4.8. PMV Analyst Note
- 4.1. Porters Five Forces
- 5. Market Analysis, Insights and Forecast 2021-2033
- 5.1. Market Analysis, Insights and Forecast - by Type
- 5.1.1. Static (Traditional) OOH
- 5.1.2. Digital OOH (LED Screens)
- 5.1.2.1. Programmatic OOH
- 5.1.2.2. Other Digital OOH
- 5.2. Market Analysis, Insights and Forecast - by Application
- 5.2.1. Billboard
- 5.2.2. Transportation (Transit)
- 5.2.2.1. Airports
- 5.2.2.2. Other Transportation (Buses, etc.)
- 5.2.3. Street Furniture
- 5.2.4. Other Place-based Media
- 5.3. Market Analysis, Insights and Forecast - by End-user Industry
- 5.3.1. Automotive
- 5.3.2. Retail and Consumer Goods
- 5.3.3. Healthcare
- 5.3.4. BFSI
- 5.3.5. Other End-user Industries
- 5.4. Market Analysis, Insights and Forecast - by Region
- 5.4.1. Indonesia
- 5.1. Market Analysis, Insights and Forecast - by Type
- 6. Indonesia OOH and DOOH Market Analysis, Insights and Forecast, 2021-2033
- 6.1. Market Analysis, Insights and Forecast - by Type
- 6.1.1. Static (Traditional) OOH
- 6.1.2. Digital OOH (LED Screens)
- 6.1.2.1. Programmatic OOH
- 6.1.2.2. Other Digital OOH
- 6.2. Market Analysis, Insights and Forecast - by Application
- 6.2.1. Billboard
- 6.2.2. Transportation (Transit)
- 6.2.2.1. Airports
- 6.2.2.2. Other Transportation (Buses, etc.)
- 6.2.3. Street Furniture
- 6.2.4. Other Place-based Media
- 6.3. Market Analysis, Insights and Forecast - by End-user Industry
- 6.3.1. Automotive
- 6.3.2. Retail and Consumer Goods
- 6.3.3. Healthcare
- 6.3.4. BFSI
- 6.3.5. Other End-user Industries
- 6.1. Market Analysis, Insights and Forecast - by Type
- 7. Competitive Analysis
- 7.1. Company Profiles
- 7.1.1 JCDecaux SE
- 7.1.1.1. Company Overview
- 7.1.1.2. Products
- 7.1.1.3. Company Financials
- 7.1.1.4. SWOT Analysis
- 7.1.2 Hivestack
- 7.1.2.1. Company Overview
- 7.1.2.2. Products
- 7.1.2.3. Company Financials
- 7.1.2.4. SWOT Analysis
- 7.1.3 Next Digital Indonesia
- 7.1.3.1. Company Overview
- 7.1.3.2. Products
- 7.1.3.3. Company Financials
- 7.1.3.4. SWOT Analysis
- 7.1.4 Moving Walls
- 7.1.4.1. Company Overview
- 7.1.4.2. Products
- 7.1.4.3. Company Financials
- 7.1.4.4. SWOT Analysis
- 7.1.5 EYE Indonesia
- 7.1.5.1. Company Overview
- 7.1.5.2. Products
- 7.1.5.3. Company Financials
- 7.1.5.4. SWOT Analysis
- 7.1.6 Plan B Media Public Company Limited
- 7.1.6.1. Company Overview
- 7.1.6.2. Products
- 7.1.6.3. Company Financials
- 7.1.6.4. SWOT Analysis
- 7.1.7 VIOOH
- 7.1.7.1. Company Overview
- 7.1.7.2. Products
- 7.1.7.3. Company Financials
- 7.1.7.4. SWOT Analysis
- 7.1.8 Vistar Media
- 7.1.8.1. Company Overview
- 7.1.8.2. Products
- 7.1.8.3. Company Financials
- 7.1.8.4. SWOT Analysis
- 7.1.9 Jaris & K
- 7.1.9.1. Company Overview
- 7.1.9.2. Products
- 7.1.9.3. Company Financials
- 7.1.9.4. SWOT Analysis
- 7.1.10 Pixel Group*List Not Exhaustive
- 7.1.10.1. Company Overview
- 7.1.10.2. Products
- 7.1.10.3. Company Financials
- 7.1.10.4. SWOT Analysis
- 7.1.1 JCDecaux SE
- 7.2. Market Entropy
- 7.2.1 Company's Key Areas Served
- 7.2.2 Recent Developments
- 7.3. Company Market Share Analysis 2025
- 7.3.1 Top 5 Companies Market Share Analysis
- 7.3.2 Top 3 Companies Market Share Analysis
- 7.4. List of Potential Customers
- 8. Research Methodology
List of Figures
- Figure 1: Indonesia OOH and DOOH Market Revenue Breakdown (Million, %) by Product 2025 & 2033
- Figure 2: Indonesia OOH and DOOH Market Share (%) by Company 2025
List of Tables
- Table 1: Indonesia OOH and DOOH Market Revenue Million Forecast, by Type 2020 & 2033
- Table 2: Indonesia OOH and DOOH Market Volume Million Forecast, by Type 2020 & 2033
- Table 3: Indonesia OOH and DOOH Market Revenue Million Forecast, by Application 2020 & 2033
- Table 4: Indonesia OOH and DOOH Market Volume Million Forecast, by Application 2020 & 2033
- Table 5: Indonesia OOH and DOOH Market Revenue Million Forecast, by End-user Industry 2020 & 2033
- Table 6: Indonesia OOH and DOOH Market Volume Million Forecast, by End-user Industry 2020 & 2033
- Table 7: Indonesia OOH and DOOH Market Revenue Million Forecast, by Region 2020 & 2033
- Table 8: Indonesia OOH and DOOH Market Volume Million Forecast, by Region 2020 & 2033
- Table 9: Indonesia OOH and DOOH Market Revenue Million Forecast, by Type 2020 & 2033
- Table 10: Indonesia OOH and DOOH Market Volume Million Forecast, by Type 2020 & 2033
- Table 11: Indonesia OOH and DOOH Market Revenue Million Forecast, by Application 2020 & 2033
- Table 12: Indonesia OOH and DOOH Market Volume Million Forecast, by Application 2020 & 2033
- Table 13: Indonesia OOH and DOOH Market Revenue Million Forecast, by End-user Industry 2020 & 2033
- Table 14: Indonesia OOH and DOOH Market Volume Million Forecast, by End-user Industry 2020 & 2033
- Table 15: Indonesia OOH and DOOH Market Revenue Million Forecast, by Country 2020 & 2033
- Table 16: Indonesia OOH and DOOH Market Volume Million Forecast, by Country 2020 & 2033
Frequently Asked Questions
1. What is the projected Compound Annual Growth Rate (CAGR) of the Indonesia OOH and DOOH Market?
The projected CAGR is approximately 6.50%.
2. Which companies are prominent players in the Indonesia OOH and DOOH Market?
Key companies in the market include JCDecaux SE, Hivestack, Next Digital Indonesia, Moving Walls, EYE Indonesia, Plan B Media Public Company Limited, VIOOH, Vistar Media, Jaris & K, Pixel Group*List Not Exhaustive.
3. What are the main segments of the Indonesia OOH and DOOH Market?
The market segments include Type, Application, End-user Industry .
4. Can you provide details about the market size?
The market size is estimated to be USD 314.24 Million as of 2022.
5. What are some drivers contributing to market growth?
Ongoing Shift Toward Digital Advertising; Increasing Use of Recommendation Engines.
6. What are the notable trends driving market growth?
Ongoing Shift Toward Digital Advertising Aided by Increased Spending on Smart City Projects.
7. Are there any restraints impacting market growth?
Ongoing Shift Toward Digital Advertising; Increasing Use of Recommendation Engines.
8. Can you provide examples of recent developments in the market?
July 2024: Magnite, in collaboration with Dentsu Indonesia, rolled out a programmatic roadblock campaign on Indonesia's top streaming platforms – Viu, Vidio, and WeTV. This strategic move secured Magnite a 100% share of voice (SOV), ensuring unparalleled brand exposure. Concurrently, Nestlé Indonesia unveiled its latest offering, the limited-edition NESCAFÉ Biscuit Coffee featuring Marie Regal Biscuit. Recognizing the surging popularity of streaming platforms, Nestlé Indonesia partnered with Magnite and Dentsu Indonesia to amplify its audience reach.
9. What pricing options are available for accessing the report?
Pricing options include single-user, multi-user, and enterprise licenses priced at USD 3800, USD 4500, and USD 5800 respectively.
10. Is the market size provided in terms of value or volume?
The market size is provided in terms of value, measured in Million and volume, measured in Million.
11. Are there any specific market keywords associated with the report?
Yes, the market keyword associated with the report is "Indonesia OOH and DOOH Market," which aids in identifying and referencing the specific market segment covered.
12. How do I determine which pricing option suits my needs best?
The pricing options vary based on user requirements and access needs. Individual users may opt for single-user licenses, while businesses requiring broader access may choose multi-user or enterprise licenses for cost-effective access to the report.
13. Are there any additional resources or data provided in the Indonesia OOH and DOOH Market report?
While the report offers comprehensive insights, it's advisable to review the specific contents or supplementary materials provided to ascertain if additional resources or data are available.
14. How can I stay updated on further developments or reports in the Indonesia OOH and DOOH Market?
To stay informed about further developments, trends, and reports in the Indonesia OOH and DOOH Market, consider subscribing to industry newsletters, following relevant companies and organizations, or regularly checking reputable industry news sources and publications.
Methodology
Step 1 - Identification of Relevant Samples Size from Population Database


Step 2 - Approaches for Defining Global Market Size (Value, Volume* & Price*)

Note*: In applicable scenarios
Step 3 - Data Sources
Primary Research
- Web Analytics
- Survey Reports
- Research Institute
- Latest Research Reports
- Opinion Leaders
Secondary Research
- Annual Reports
- White Paper
- Latest Press Release
- Industry Association
- Paid Database
- Investor Presentations

Step 4 - Data Triangulation
Involves using different sources of information in order to increase the validity of a study
These sources are likely to be stakeholders in a program - participants, other researchers, program staff, other community members, and so on.
Then we put all data in single framework & apply various statistical tools to find out the dynamic on the market.
During the analysis stage, feedback from the stakeholder groups would be compared to determine areas of agreement as well as areas of divergence