
Key Insights
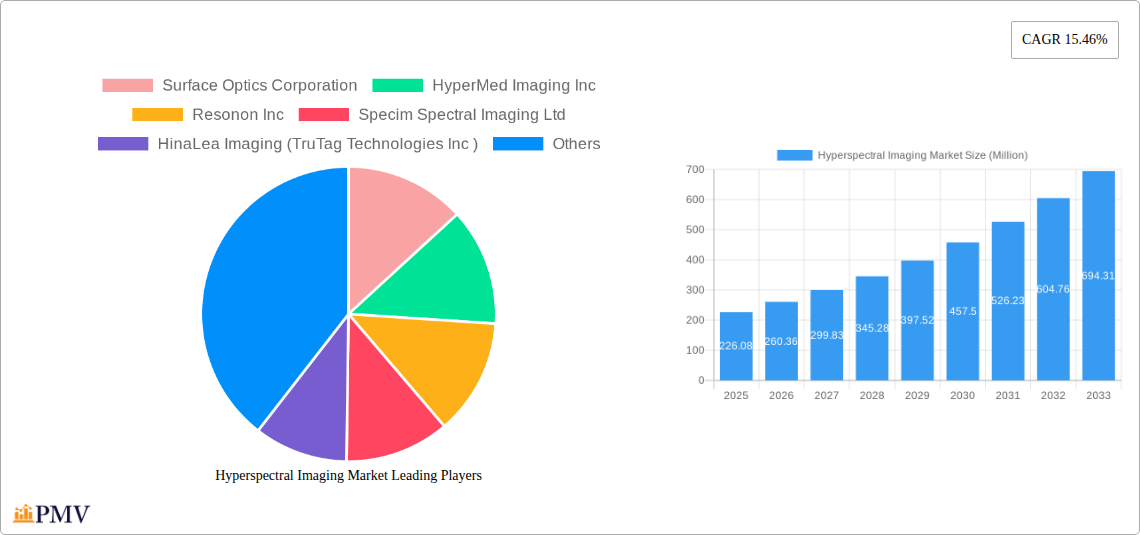
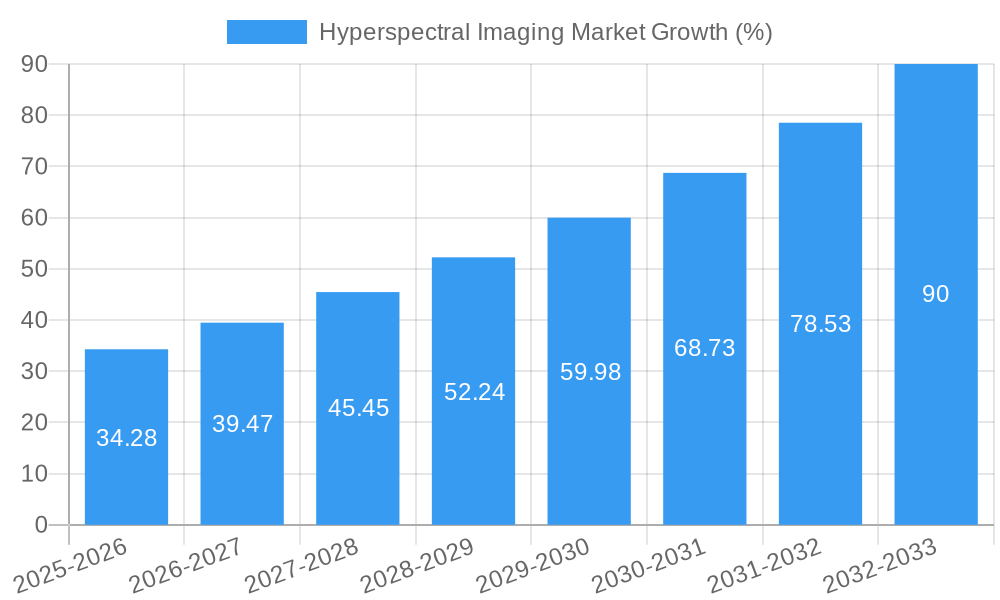
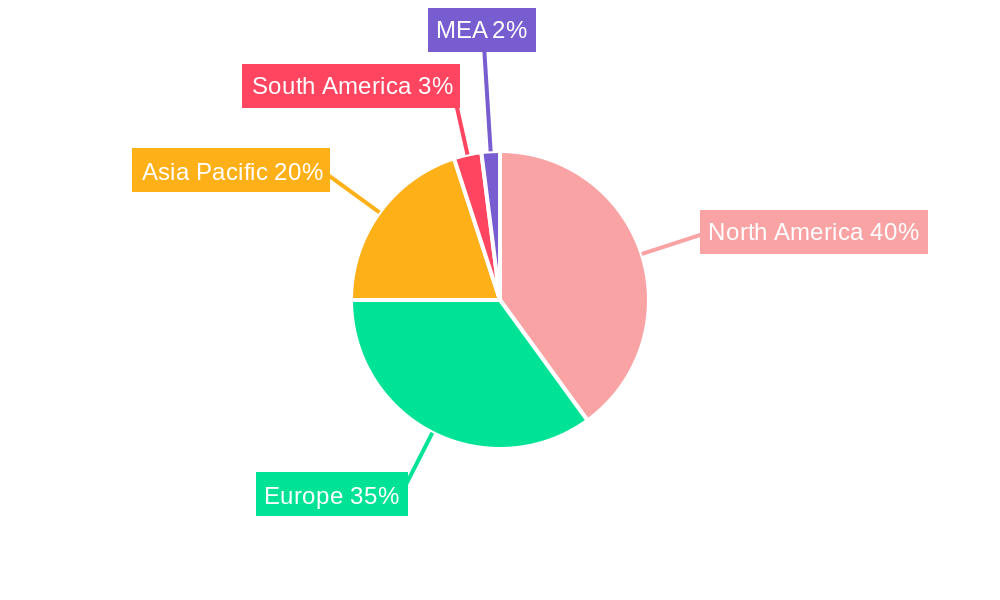
The hyperspectral imaging market is experiencing robust growth, projected to reach \$226.08 million in 2025 and expand significantly over the forecast period (2025-2033). A compound annual growth rate (CAGR) of 15.46% indicates a rapidly evolving landscape driven by several key factors. Advancements in sensor technology are enabling higher resolution and sensitivity, leading to improved image quality and broader applications. The increasing demand for precise and detailed information across various sectors, including food and agriculture (quality control, crop monitoring), healthcare (disease diagnosis, tissue analysis), and defense (surveillance, target identification), fuels market expansion. Furthermore, the rising adoption of hyperspectral imaging in mining and metrology for material analysis and precision measurement contributes to market growth. While cost constraints and the complexity of data analysis pose some challenges, the development of user-friendly software and the decreasing cost of hardware are mitigating these limitations. The market's geographic distribution showcases strong growth in North America and Europe, followed by Asia-Pacific, driven by technological advancements and increased adoption in these regions. The competitive landscape is characterized by both established players and emerging companies, fostering innovation and driving market expansion through continuous product development and strategic partnerships.
The market segmentation by end-user further highlights the diversity of applications. Food and agriculture represent a substantial portion of the market, leveraging hyperspectral imaging for quality assessment, yield prediction, and pest detection. Healthcare applications are expanding rapidly due to the technology's non-invasive nature and ability to provide detailed diagnostic information. The defense sector uses hyperspectral imaging for advanced surveillance and reconnaissance purposes. Mining and metrology benefit from its precise material analysis capabilities. The 'Other End-user Verticals' segment represents emerging applications in areas such as environmental monitoring and industrial process control, demonstrating the versatility of this technology and its potential for future growth. The continued integration of hyperspectral imaging with artificial intelligence and machine learning will further enhance the capabilities of the technology, driving adoption across diverse sectors and solidifying its role in various industries.
Hyperspectral Imaging Market: A Comprehensive Report (2019-2033)
This comprehensive report provides an in-depth analysis of the global Hyperspectral Imaging market, offering valuable insights for stakeholders across the value chain. The study period covers 2019-2033, with 2025 as the base and estimated year, and a forecast period of 2025-2033. The report analyzes market size, growth drivers, challenges, and competitive dynamics, providing actionable intelligence for strategic decision-making. The market is segmented by end-user, encompassing Food and Agriculture, Healthcare, Defense, Mining and Metrology, and Other End-user Verticals. Key players analyzed include Surface Optics Corporation, HyperMed Imaging Inc, Resonon Inc, Specim Spectral Imaging Ltd, HinaLea Imaging (TruTag Technologies Inc), Headwall Photonics Inc, Telops Inc, Cubert GmbH, BaySpec Inc, Galileo Group Inc, XIMEA GmbH, Norsk Elektro Optikk AS, Brimrose Corporation of America, Corning Incorporated, and ITRES Research Limited. The report projects a market value of xx Million by 2033, exhibiting a CAGR of xx%.
Hyperspectral Imaging Market Market Structure & Competitive Dynamics
The hyperspectral imaging market exhibits a moderately concentrated structure, with a few major players holding significant market share. However, the presence of numerous smaller, specialized companies fosters innovation and competition. The market is influenced by evolving regulatory frameworks, particularly concerning data privacy and environmental regulations. Product substitutes, such as multispectral imaging, exert some competitive pressure, but hyperspectral imaging's superior spectral resolution maintains its distinct advantages. End-user trends, driven by increasing demand for precision and automation in diverse applications, fuel market growth. Mergers and acquisitions (M&A) activity is moderate, with deal values averaging xx Million, reflecting strategic consolidations and expansions within the industry.
- Market Concentration: Moderately concentrated, with top 5 players holding approximately xx% market share.
- Innovation Ecosystems: Active, with significant R&D investment focused on improving sensor technology, data processing algorithms, and application-specific solutions.
- Regulatory Frameworks: Vary by region, influencing data security and environmental compliance aspects.
- Product Substitutes: Multispectral imaging technologies offer competition, but with limited spectral resolution.
- End-User Trends: Increasing demand for automation, precision, and real-time data analysis drives market growth.
- M&A Activity: Moderate activity, with deals focused on acquiring niche technologies and expanding market reach.
Hyperspectral Imaging Market Industry Trends & Insights
The hyperspectral imaging market is experiencing robust growth, driven by technological advancements, increasing adoption across diverse industries, and a rising demand for accurate and detailed spectral information. Advancements in sensor technology, miniaturization, and improved data processing capabilities are lowering costs and expanding applications. Consumer preferences are shifting towards higher accuracy, faster processing speeds, and user-friendly interfaces. Competitive dynamics are shaped by technological innovation, strategic partnerships, and a focus on providing customized solutions to diverse end-users. The market is expected to witness significant growth in the forecast period, propelled by the increasing adoption of hyperspectral imaging in various sectors. This surge is attributed to factors such as the expanding need for detailed material analysis and the emergence of sophisticated data analytics tools.
Dominant Markets & Segments in Hyperspectral Imaging Market
The North American region currently holds a dominant position in the hyperspectral imaging market, driven by substantial investments in R&D, a strong technological base, and a robust defense and aerospace industry. Within end-user segments, the healthcare sector is witnessing rapid growth, fueled by demand for advanced diagnostics and personalized medicine. Other key segments include:
- Food and Agriculture: Driven by demand for quality control, crop monitoring, and food safety assurance.
- Healthcare: Growth driven by advanced diagnostics, personalized medicine, and improved disease detection.
- Defense: High demand for surveillance, reconnaissance, and target identification applications.
- Mining and Metrology: Used for mineral exploration, material analysis, and precision measurement applications.
- Other End-user Verticals: Growing adoption in environmental monitoring, industrial inspection, and forensic science.
Key Drivers for North American Dominance:
- Robust R&D investments and advanced technological capabilities.
- Strong presence of major players and established supply chains.
- High government spending on defense and aerospace applications.
- Favourable regulatory environment for technology adoption.
Hyperspectral Imaging Market Product Innovations
Recent innovations focus on enhancing spectral resolution, improving spatial resolution, reducing costs, and developing user-friendly software for data analysis. New camera models, such as SPECIM's upgraded FX50, offer enhanced performance and improved capabilities, broadening the applications of hyperspectral imaging technology. These advancements cater to the growing demand for high-speed, real-time data acquisition and processing, enhancing market penetration across diverse industries.
Report Segmentation & Scope
This report segments the hyperspectral imaging market by end-user:
Food and Agriculture: This segment leverages hyperspectral imaging for quality control, crop monitoring, and precision agriculture. Growth is projected at xx% CAGR during the forecast period. Competitive dynamics are influenced by the integration of advanced analytics and cloud-based platforms.
Healthcare: Hyperspectral imaging is used in diagnostics, cancer detection, and personalized medicine. Market size is projected to reach xx Million by 2033, growing at a xx% CAGR. The segment is characterized by collaborations between imaging technology providers and healthcare organizations.
Defense: This segment focuses on surveillance, target identification, and intelligence gathering. Market growth is steady, driven by government investments and technological advancements. Competitive dynamics are shaped by stringent regulatory requirements and national security considerations.
Mining and Metrology: This segment utilizes hyperspectral imaging for mineral exploration and precision measurements. The market is expected to grow steadily due to increased investment in infrastructure and mining operations. Competitive intensity is moderate, with leading companies focused on offering specialized solutions.
Other End-user Verticals: This diverse segment includes environmental monitoring, industrial inspection, and forensic science. Growth is driven by the increasing awareness of environmental concerns and advancements in data analytics. Market dynamics are driven by specialized application requirements and the integration of hyperspectral imaging with other technologies.
Key Drivers of Hyperspectral Imaging Market Growth
Several key factors are driving the growth of the hyperspectral imaging market:
- Technological advancements: Improved sensor technology, faster processing speeds, and miniaturization are making hyperspectral imaging more accessible and affordable.
- Increased demand for precise data: Various industries need highly accurate spectral information for improved decision-making and process optimization.
- Government support and funding: Investments in R&D and infrastructure projects related to hyperspectral imaging are fueling market expansion.
- Rising adoption across diverse sectors: The applications of hyperspectral imaging are constantly expanding, driving demand across a wide range of industries.
Challenges in the Hyperspectral Imaging Market Sector
Despite the significant growth potential, the hyperspectral imaging market faces certain challenges:
- High initial investment costs: The cost of hyperspectral imaging systems can be prohibitive for some users, limiting market penetration.
- Data processing complexity: Analyzing and interpreting large hyperspectral datasets requires specialized skills and sophisticated software.
- Lack of standardization: The absence of widespread standards can hinder interoperability and data sharing.
- Competition from alternative technologies: Other imaging techniques such as multispectral imaging present competition.
Leading Players in the Hyperspectral Imaging Market Market
- Surface Optics Corporation
- HyperMed Imaging Inc
- Resonon Inc
- Specim Spectral Imaging Ltd
- HinaLea Imaging (TruTag Technologies Inc)
- Headwall Photonics Inc
- Telops Inc
- Cubert GmbH
- BaySpec Inc
- Galileo Group Inc
- XIMEA GmbH
- Norsk Elektro Optikk AS
- Brimrose Corporation of America
- Corning Incorporated
- ITRES Research Limited
Key Developments in Hyperspectral Imaging Market Sector
- December 2023: SPECIM launched an upgraded FX50 middle wave infrared hyperspectral camera model with improved spectral and spatial resolution.
- November 2023: European Space Imaging (EUSI) and Pixxel partnered to bring hyperspectral imaging to the European market, expanding remote sensing applications.
- June 2023: HinaLea Imaging unveiled a new hyperspectral camera (Model 4455) extending SWIR capabilities for chemical detection.
Strategic Hyperspectral Imaging Market Market Outlook
The hyperspectral imaging market is poised for significant growth, fueled by continued technological advancements, expanding applications across diverse sectors, and increasing demand for precise and detailed spectral information. Strategic opportunities lie in developing cost-effective solutions, user-friendly software, and tailored applications for specific industries. Focus on improving data processing capabilities and creating robust analytical tools will be crucial for maximizing market penetration and driving future growth.
Hyperspectral Imaging Market Segmentation
-
1. End-user Industry
- 1.1. Food and Agriculture
- 1.2. Healthcare
- 1.3. Defense
- 1.4. Mining and Metrology
- 1.5. Recycling
- 1.6. Other End-user Verticals
Hyperspectral Imaging Market Segmentation By Geography
- 1. North America
- 2. Europe
- 3. Asia
- 4. Australia and New Zealand
- 5. Latin America
- 6. Middle East and Africa
Hyperspectral Imaging Market REPORT HIGHLIGHTS
| Aspects | Details |
|---|---|
| Study Period | 2019-2033 |
| Base Year | 2024 |
| Estimated Year | 2025 |
| Forecast Period | 2025-2033 |
| Historical Period | 2019-2024 |
| Growth Rate | CAGR of 15.46% from 2019-2033 |
| Segmentation |
|
Table of Contents
- 1. Introduction
- 1.1. Research Scope
- 1.2. Market Segmentation
- 1.3. Research Methodology
- 1.4. Definitions and Assumptions
- 2. Executive Summary
- 2.1. Introduction
- 3. Market Dynamics
- 3.1. Introduction
- 3.2. Market Drivers
- 3.2.1. Technological Advancements; Increasing Demand for Data Accuracy and Consistency
- 3.3. Market Restrains
- 3.3.1. High Costs Associated with the Use of Hyperspectral Imaging
- 3.4. Market Trends
- 3.4.1. Healthcare to be the Fastest Growing End User Segment
- 4. Market Factor Analysis
- 4.1. Porters Five Forces
- 4.2. Supply/Value Chain
- 4.3. PESTEL analysis
- 4.4. Market Entropy
- 4.5. Patent/Trademark Analysis
- 5. Global Hyperspectral Imaging Market Analysis, Insights and Forecast, 2019-2031
- 5.1. Market Analysis, Insights and Forecast - by End-user Industry
- 5.1.1. Food and Agriculture
- 5.1.2. Healthcare
- 5.1.3. Defense
- 5.1.4. Mining and Metrology
- 5.1.5. Recycling
- 5.1.6. Other End-user Verticals
- 5.2. Market Analysis, Insights and Forecast - by Region
- 5.2.1. North America
- 5.2.2. Europe
- 5.2.3. Asia
- 5.2.4. Australia and New Zealand
- 5.2.5. Latin America
- 5.2.6. Middle East and Africa
- 5.1. Market Analysis, Insights and Forecast - by End-user Industry
- 6. North America Hyperspectral Imaging Market Analysis, Insights and Forecast, 2019-2031
- 6.1. Market Analysis, Insights and Forecast - by End-user Industry
- 6.1.1. Food and Agriculture
- 6.1.2. Healthcare
- 6.1.3. Defense
- 6.1.4. Mining and Metrology
- 6.1.5. Recycling
- 6.1.6. Other End-user Verticals
- 6.1. Market Analysis, Insights and Forecast - by End-user Industry
- 7. Europe Hyperspectral Imaging Market Analysis, Insights and Forecast, 2019-2031
- 7.1. Market Analysis, Insights and Forecast - by End-user Industry
- 7.1.1. Food and Agriculture
- 7.1.2. Healthcare
- 7.1.3. Defense
- 7.1.4. Mining and Metrology
- 7.1.5. Recycling
- 7.1.6. Other End-user Verticals
- 7.1. Market Analysis, Insights and Forecast - by End-user Industry
- 8. Asia Hyperspectral Imaging Market Analysis, Insights and Forecast, 2019-2031
- 8.1. Market Analysis, Insights and Forecast - by End-user Industry
- 8.1.1. Food and Agriculture
- 8.1.2. Healthcare
- 8.1.3. Defense
- 8.1.4. Mining and Metrology
- 8.1.5. Recycling
- 8.1.6. Other End-user Verticals
- 8.1. Market Analysis, Insights and Forecast - by End-user Industry
- 9. Australia and New Zealand Hyperspectral Imaging Market Analysis, Insights and Forecast, 2019-2031
- 9.1. Market Analysis, Insights and Forecast - by End-user Industry
- 9.1.1. Food and Agriculture
- 9.1.2. Healthcare
- 9.1.3. Defense
- 9.1.4. Mining and Metrology
- 9.1.5. Recycling
- 9.1.6. Other End-user Verticals
- 9.1. Market Analysis, Insights and Forecast - by End-user Industry
- 10. Latin America Hyperspectral Imaging Market Analysis, Insights and Forecast, 2019-2031
- 10.1. Market Analysis, Insights and Forecast - by End-user Industry
- 10.1.1. Food and Agriculture
- 10.1.2. Healthcare
- 10.1.3. Defense
- 10.1.4. Mining and Metrology
- 10.1.5. Recycling
- 10.1.6. Other End-user Verticals
- 10.1. Market Analysis, Insights and Forecast - by End-user Industry
- 11. Middle East and Africa Hyperspectral Imaging Market Analysis, Insights and Forecast, 2019-2031
- 11.1. Market Analysis, Insights and Forecast - by End-user Industry
- 11.1.1. Food and Agriculture
- 11.1.2. Healthcare
- 11.1.3. Defense
- 11.1.4. Mining and Metrology
- 11.1.5. Recycling
- 11.1.6. Other End-user Verticals
- 11.1. Market Analysis, Insights and Forecast - by End-user Industry
- 12. North America Hyperspectral Imaging Market Analysis, Insights and Forecast, 2019-2031
- 12.1. Market Analysis, Insights and Forecast - By Country/Sub-region
- 12.1.1 United States
- 12.1.2 Canada
- 12.1.3 Mexico
- 13. Europe Hyperspectral Imaging Market Analysis, Insights and Forecast, 2019-2031
- 13.1. Market Analysis, Insights and Forecast - By Country/Sub-region
- 13.1.1 Germany
- 13.1.2 United Kingdom
- 13.1.3 France
- 13.1.4 Spain
- 13.1.5 Italy
- 13.1.6 Spain
- 13.1.7 Belgium
- 13.1.8 Netherland
- 13.1.9 Nordics
- 13.1.10 Rest of Europe
- 14. Asia Pacific Hyperspectral Imaging Market Analysis, Insights and Forecast, 2019-2031
- 14.1. Market Analysis, Insights and Forecast - By Country/Sub-region
- 14.1.1 China
- 14.1.2 Japan
- 14.1.3 India
- 14.1.4 South Korea
- 14.1.5 Southeast Asia
- 14.1.6 Australia
- 14.1.7 Indonesia
- 14.1.8 Phillipes
- 14.1.9 Singapore
- 14.1.10 Thailandc
- 14.1.11 Rest of Asia Pacific
- 15. South America Hyperspectral Imaging Market Analysis, Insights and Forecast, 2019-2031
- 15.1. Market Analysis, Insights and Forecast - By Country/Sub-region
- 15.1.1 Brazil
- 15.1.2 Argentina
- 15.1.3 Peru
- 15.1.4 Chile
- 15.1.5 Colombia
- 15.1.6 Ecuador
- 15.1.7 Venezuela
- 15.1.8 Rest of South America
- 16. North America Hyperspectral Imaging Market Analysis, Insights and Forecast, 2019-2031
- 16.1. Market Analysis, Insights and Forecast - By Country/Sub-region
- 16.1.1 United States
- 16.1.2 Canada
- 16.1.3 Mexico
- 17. MEA Hyperspectral Imaging Market Analysis, Insights and Forecast, 2019-2031
- 17.1. Market Analysis, Insights and Forecast - By Country/Sub-region
- 17.1.1 United Arab Emirates
- 17.1.2 Saudi Arabia
- 17.1.3 South Africa
- 17.1.4 Rest of Middle East and Africa
- 18. Competitive Analysis
- 18.1. Global Market Share Analysis 2024
- 18.2. Company Profiles
- 18.2.1 Surface Optics Corporation
- 18.2.1.1. Overview
- 18.2.1.2. Products
- 18.2.1.3. SWOT Analysis
- 18.2.1.4. Recent Developments
- 18.2.1.5. Financials (Based on Availability)
- 18.2.2 HyperMed Imaging Inc
- 18.2.2.1. Overview
- 18.2.2.2. Products
- 18.2.2.3. SWOT Analysis
- 18.2.2.4. Recent Developments
- 18.2.2.5. Financials (Based on Availability)
- 18.2.3 Resonon Inc
- 18.2.3.1. Overview
- 18.2.3.2. Products
- 18.2.3.3. SWOT Analysis
- 18.2.3.4. Recent Developments
- 18.2.3.5. Financials (Based on Availability)
- 18.2.4 Specim Spectral Imaging Ltd
- 18.2.4.1. Overview
- 18.2.4.2. Products
- 18.2.4.3. SWOT Analysis
- 18.2.4.4. Recent Developments
- 18.2.4.5. Financials (Based on Availability)
- 18.2.5 HinaLea Imaging (TruTag Technologies Inc )
- 18.2.5.1. Overview
- 18.2.5.2. Products
- 18.2.5.3. SWOT Analysis
- 18.2.5.4. Recent Developments
- 18.2.5.5. Financials (Based on Availability)
- 18.2.6 Headwall Photonics Inc
- 18.2.6.1. Overview
- 18.2.6.2. Products
- 18.2.6.3. SWOT Analysis
- 18.2.6.4. Recent Developments
- 18.2.6.5. Financials (Based on Availability)
- 18.2.7 Telops Inc
- 18.2.7.1. Overview
- 18.2.7.2. Products
- 18.2.7.3. SWOT Analysis
- 18.2.7.4. Recent Developments
- 18.2.7.5. Financials (Based on Availability)
- 18.2.8 Cubert GmbH
- 18.2.8.1. Overview
- 18.2.8.2. Products
- 18.2.8.3. SWOT Analysis
- 18.2.8.4. Recent Developments
- 18.2.8.5. Financials (Based on Availability)
- 18.2.9 BaySpec Inc
- 18.2.9.1. Overview
- 18.2.9.2. Products
- 18.2.9.3. SWOT Analysis
- 18.2.9.4. Recent Developments
- 18.2.9.5. Financials (Based on Availability)
- 18.2.10 Galileo Group Inc
- 18.2.10.1. Overview
- 18.2.10.2. Products
- 18.2.10.3. SWOT Analysis
- 18.2.10.4. Recent Developments
- 18.2.10.5. Financials (Based on Availability)
- 18.2.11 XIMEA GmbH
- 18.2.11.1. Overview
- 18.2.11.2. Products
- 18.2.11.3. SWOT Analysis
- 18.2.11.4. Recent Developments
- 18.2.11.5. Financials (Based on Availability)
- 18.2.12 Norsk Elektro Optikk AS
- 18.2.12.1. Overview
- 18.2.12.2. Products
- 18.2.12.3. SWOT Analysis
- 18.2.12.4. Recent Developments
- 18.2.12.5. Financials (Based on Availability)
- 18.2.13 Brimrose Corporation of America
- 18.2.13.1. Overview
- 18.2.13.2. Products
- 18.2.13.3. SWOT Analysis
- 18.2.13.4. Recent Developments
- 18.2.13.5. Financials (Based on Availability)
- 18.2.14 Corning Incorporated
- 18.2.14.1. Overview
- 18.2.14.2. Products
- 18.2.14.3. SWOT Analysis
- 18.2.14.4. Recent Developments
- 18.2.14.5. Financials (Based on Availability)
- 18.2.15 ITRES Research Limited
- 18.2.15.1. Overview
- 18.2.15.2. Products
- 18.2.15.3. SWOT Analysis
- 18.2.15.4. Recent Developments
- 18.2.15.5. Financials (Based on Availability)
- 18.2.1 Surface Optics Corporation
List of Figures
- Figure 1: Global Hyperspectral Imaging Market Revenue Breakdown (Million, %) by Region 2024 & 2032
- Figure 2: North America Hyperspectral Imaging Market Revenue (Million), by Country 2024 & 2032
- Figure 3: North America Hyperspectral Imaging Market Revenue Share (%), by Country 2024 & 2032
- Figure 4: Europe Hyperspectral Imaging Market Revenue (Million), by Country 2024 & 2032
- Figure 5: Europe Hyperspectral Imaging Market Revenue Share (%), by Country 2024 & 2032
- Figure 6: Asia Pacific Hyperspectral Imaging Market Revenue (Million), by Country 2024 & 2032
- Figure 7: Asia Pacific Hyperspectral Imaging Market Revenue Share (%), by Country 2024 & 2032
- Figure 8: South America Hyperspectral Imaging Market Revenue (Million), by Country 2024 & 2032
- Figure 9: South America Hyperspectral Imaging Market Revenue Share (%), by Country 2024 & 2032
- Figure 10: North America Hyperspectral Imaging Market Revenue (Million), by Country 2024 & 2032
- Figure 11: North America Hyperspectral Imaging Market Revenue Share (%), by Country 2024 & 2032
- Figure 12: MEA Hyperspectral Imaging Market Revenue (Million), by Country 2024 & 2032
- Figure 13: MEA Hyperspectral Imaging Market Revenue Share (%), by Country 2024 & 2032
- Figure 14: North America Hyperspectral Imaging Market Revenue (Million), by End-user Industry 2024 & 2032
- Figure 15: North America Hyperspectral Imaging Market Revenue Share (%), by End-user Industry 2024 & 2032
- Figure 16: North America Hyperspectral Imaging Market Revenue (Million), by Country 2024 & 2032
- Figure 17: North America Hyperspectral Imaging Market Revenue Share (%), by Country 2024 & 2032
- Figure 18: Europe Hyperspectral Imaging Market Revenue (Million), by End-user Industry 2024 & 2032
- Figure 19: Europe Hyperspectral Imaging Market Revenue Share (%), by End-user Industry 2024 & 2032
- Figure 20: Europe Hyperspectral Imaging Market Revenue (Million), by Country 2024 & 2032
- Figure 21: Europe Hyperspectral Imaging Market Revenue Share (%), by Country 2024 & 2032
- Figure 22: Asia Hyperspectral Imaging Market Revenue (Million), by End-user Industry 2024 & 2032
- Figure 23: Asia Hyperspectral Imaging Market Revenue Share (%), by End-user Industry 2024 & 2032
- Figure 24: Asia Hyperspectral Imaging Market Revenue (Million), by Country 2024 & 2032
- Figure 25: Asia Hyperspectral Imaging Market Revenue Share (%), by Country 2024 & 2032
- Figure 26: Australia and New Zealand Hyperspectral Imaging Market Revenue (Million), by End-user Industry 2024 & 2032
- Figure 27: Australia and New Zealand Hyperspectral Imaging Market Revenue Share (%), by End-user Industry 2024 & 2032
- Figure 28: Australia and New Zealand Hyperspectral Imaging Market Revenue (Million), by Country 2024 & 2032
- Figure 29: Australia and New Zealand Hyperspectral Imaging Market Revenue Share (%), by Country 2024 & 2032
- Figure 30: Latin America Hyperspectral Imaging Market Revenue (Million), by End-user Industry 2024 & 2032
- Figure 31: Latin America Hyperspectral Imaging Market Revenue Share (%), by End-user Industry 2024 & 2032
- Figure 32: Latin America Hyperspectral Imaging Market Revenue (Million), by Country 2024 & 2032
- Figure 33: Latin America Hyperspectral Imaging Market Revenue Share (%), by Country 2024 & 2032
- Figure 34: Middle East and Africa Hyperspectral Imaging Market Revenue (Million), by End-user Industry 2024 & 2032
- Figure 35: Middle East and Africa Hyperspectral Imaging Market Revenue Share (%), by End-user Industry 2024 & 2032
- Figure 36: Middle East and Africa Hyperspectral Imaging Market Revenue (Million), by Country 2024 & 2032
- Figure 37: Middle East and Africa Hyperspectral Imaging Market Revenue Share (%), by Country 2024 & 2032
List of Tables
- Table 1: Global Hyperspectral Imaging Market Revenue Million Forecast, by Region 2019 & 2032
- Table 2: Global Hyperspectral Imaging Market Revenue Million Forecast, by End-user Industry 2019 & 2032
- Table 3: Global Hyperspectral Imaging Market Revenue Million Forecast, by Region 2019 & 2032
- Table 4: Global Hyperspectral Imaging Market Revenue Million Forecast, by Country 2019 & 2032
- Table 5: United States Hyperspectral Imaging Market Revenue (Million) Forecast, by Application 2019 & 2032
- Table 6: Canada Hyperspectral Imaging Market Revenue (Million) Forecast, by Application 2019 & 2032
- Table 7: Mexico Hyperspectral Imaging Market Revenue (Million) Forecast, by Application 2019 & 2032
- Table 8: Global Hyperspectral Imaging Market Revenue Million Forecast, by Country 2019 & 2032
- Table 9: Germany Hyperspectral Imaging Market Revenue (Million) Forecast, by Application 2019 & 2032
- Table 10: United Kingdom Hyperspectral Imaging Market Revenue (Million) Forecast, by Application 2019 & 2032
- Table 11: France Hyperspectral Imaging Market Revenue (Million) Forecast, by Application 2019 & 2032
- Table 12: Spain Hyperspectral Imaging Market Revenue (Million) Forecast, by Application 2019 & 2032
- Table 13: Italy Hyperspectral Imaging Market Revenue (Million) Forecast, by Application 2019 & 2032
- Table 14: Spain Hyperspectral Imaging Market Revenue (Million) Forecast, by Application 2019 & 2032
- Table 15: Belgium Hyperspectral Imaging Market Revenue (Million) Forecast, by Application 2019 & 2032
- Table 16: Netherland Hyperspectral Imaging Market Revenue (Million) Forecast, by Application 2019 & 2032
- Table 17: Nordics Hyperspectral Imaging Market Revenue (Million) Forecast, by Application 2019 & 2032
- Table 18: Rest of Europe Hyperspectral Imaging Market Revenue (Million) Forecast, by Application 2019 & 2032
- Table 19: Global Hyperspectral Imaging Market Revenue Million Forecast, by Country 2019 & 2032
- Table 20: China Hyperspectral Imaging Market Revenue (Million) Forecast, by Application 2019 & 2032
- Table 21: Japan Hyperspectral Imaging Market Revenue (Million) Forecast, by Application 2019 & 2032
- Table 22: India Hyperspectral Imaging Market Revenue (Million) Forecast, by Application 2019 & 2032
- Table 23: South Korea Hyperspectral Imaging Market Revenue (Million) Forecast, by Application 2019 & 2032
- Table 24: Southeast Asia Hyperspectral Imaging Market Revenue (Million) Forecast, by Application 2019 & 2032
- Table 25: Australia Hyperspectral Imaging Market Revenue (Million) Forecast, by Application 2019 & 2032
- Table 26: Indonesia Hyperspectral Imaging Market Revenue (Million) Forecast, by Application 2019 & 2032
- Table 27: Phillipes Hyperspectral Imaging Market Revenue (Million) Forecast, by Application 2019 & 2032
- Table 28: Singapore Hyperspectral Imaging Market Revenue (Million) Forecast, by Application 2019 & 2032
- Table 29: Thailandc Hyperspectral Imaging Market Revenue (Million) Forecast, by Application 2019 & 2032
- Table 30: Rest of Asia Pacific Hyperspectral Imaging Market Revenue (Million) Forecast, by Application 2019 & 2032
- Table 31: Global Hyperspectral Imaging Market Revenue Million Forecast, by Country 2019 & 2032
- Table 32: Brazil Hyperspectral Imaging Market Revenue (Million) Forecast, by Application 2019 & 2032
- Table 33: Argentina Hyperspectral Imaging Market Revenue (Million) Forecast, by Application 2019 & 2032
- Table 34: Peru Hyperspectral Imaging Market Revenue (Million) Forecast, by Application 2019 & 2032
- Table 35: Chile Hyperspectral Imaging Market Revenue (Million) Forecast, by Application 2019 & 2032
- Table 36: Colombia Hyperspectral Imaging Market Revenue (Million) Forecast, by Application 2019 & 2032
- Table 37: Ecuador Hyperspectral Imaging Market Revenue (Million) Forecast, by Application 2019 & 2032
- Table 38: Venezuela Hyperspectral Imaging Market Revenue (Million) Forecast, by Application 2019 & 2032
- Table 39: Rest of South America Hyperspectral Imaging Market Revenue (Million) Forecast, by Application 2019 & 2032
- Table 40: Global Hyperspectral Imaging Market Revenue Million Forecast, by Country 2019 & 2032
- Table 41: United States Hyperspectral Imaging Market Revenue (Million) Forecast, by Application 2019 & 2032
- Table 42: Canada Hyperspectral Imaging Market Revenue (Million) Forecast, by Application 2019 & 2032
- Table 43: Mexico Hyperspectral Imaging Market Revenue (Million) Forecast, by Application 2019 & 2032
- Table 44: Global Hyperspectral Imaging Market Revenue Million Forecast, by Country 2019 & 2032
- Table 45: United Arab Emirates Hyperspectral Imaging Market Revenue (Million) Forecast, by Application 2019 & 2032
- Table 46: Saudi Arabia Hyperspectral Imaging Market Revenue (Million) Forecast, by Application 2019 & 2032
- Table 47: South Africa Hyperspectral Imaging Market Revenue (Million) Forecast, by Application 2019 & 2032
- Table 48: Rest of Middle East and Africa Hyperspectral Imaging Market Revenue (Million) Forecast, by Application 2019 & 2032
- Table 49: Global Hyperspectral Imaging Market Revenue Million Forecast, by End-user Industry 2019 & 2032
- Table 50: Global Hyperspectral Imaging Market Revenue Million Forecast, by Country 2019 & 2032
- Table 51: Global Hyperspectral Imaging Market Revenue Million Forecast, by End-user Industry 2019 & 2032
- Table 52: Global Hyperspectral Imaging Market Revenue Million Forecast, by Country 2019 & 2032
- Table 53: Global Hyperspectral Imaging Market Revenue Million Forecast, by End-user Industry 2019 & 2032
- Table 54: Global Hyperspectral Imaging Market Revenue Million Forecast, by Country 2019 & 2032
- Table 55: Global Hyperspectral Imaging Market Revenue Million Forecast, by End-user Industry 2019 & 2032
- Table 56: Global Hyperspectral Imaging Market Revenue Million Forecast, by Country 2019 & 2032
- Table 57: Global Hyperspectral Imaging Market Revenue Million Forecast, by End-user Industry 2019 & 2032
- Table 58: Global Hyperspectral Imaging Market Revenue Million Forecast, by Country 2019 & 2032
- Table 59: Global Hyperspectral Imaging Market Revenue Million Forecast, by End-user Industry 2019 & 2032
- Table 60: Global Hyperspectral Imaging Market Revenue Million Forecast, by Country 2019 & 2032
Frequently Asked Questions
1. What is the projected Compound Annual Growth Rate (CAGR) of the Hyperspectral Imaging Market?
The projected CAGR is approximately 15.46%.
2. Which companies are prominent players in the Hyperspectral Imaging Market?
Key companies in the market include Surface Optics Corporation, HyperMed Imaging Inc, Resonon Inc, Specim Spectral Imaging Ltd, HinaLea Imaging (TruTag Technologies Inc ), Headwall Photonics Inc, Telops Inc, Cubert GmbH, BaySpec Inc, Galileo Group Inc, XIMEA GmbH, Norsk Elektro Optikk AS, Brimrose Corporation of America, Corning Incorporated, ITRES Research Limited.
3. What are the main segments of the Hyperspectral Imaging Market?
The market segments include End-user Industry.
4. Can you provide details about the market size?
The market size is estimated to be USD 226.08 Million as of 2022.
5. What are some drivers contributing to market growth?
Technological Advancements; Increasing Demand for Data Accuracy and Consistency.
6. What are the notable trends driving market growth?
Healthcare to be the Fastest Growing End User Segment.
7. Are there any restraints impacting market growth?
High Costs Associated with the Use of Hyperspectral Imaging.
8. Can you provide examples of recent developments in the market?
December 2023 - SPECIM recently launched an upgraded FX50 middle wave infrared hyperspectral camera model. The camera covers the full mid-wave infrared spectral range of 2.7 - 5.3 μm and has a 640-pixel spatial resolution, 35 nm spectral resolution, 30 μm adequate pixel size, and a maximum frame rate of 377 fps.
9. What pricing options are available for accessing the report?
Pricing options include single-user, multi-user, and enterprise licenses priced at USD 4750, USD 5250, and USD 8750 respectively.
10. Is the market size provided in terms of value or volume?
The market size is provided in terms of value, measured in Million.
11. Are there any specific market keywords associated with the report?
Yes, the market keyword associated with the report is "Hyperspectral Imaging Market," which aids in identifying and referencing the specific market segment covered.
12. How do I determine which pricing option suits my needs best?
The pricing options vary based on user requirements and access needs. Individual users may opt for single-user licenses, while businesses requiring broader access may choose multi-user or enterprise licenses for cost-effective access to the report.
13. Are there any additional resources or data provided in the Hyperspectral Imaging Market report?
While the report offers comprehensive insights, it's advisable to review the specific contents or supplementary materials provided to ascertain if additional resources or data are available.
14. How can I stay updated on further developments or reports in the Hyperspectral Imaging Market?
To stay informed about further developments, trends, and reports in the Hyperspectral Imaging Market, consider subscribing to industry newsletters, following relevant companies and organizations, or regularly checking reputable industry news sources and publications.
Methodology
Step 1 - Identification of Relevant Samples Size from Population Database


Step 2 - Approaches for Defining Global Market Size (Value, Volume* & Price*)

Note*: In applicable scenarios
Step 3 - Data Sources
Primary Research
- Web Analytics
- Survey Reports
- Research Institute
- Latest Research Reports
- Opinion Leaders
Secondary Research
- Annual Reports
- White Paper
- Latest Press Release
- Industry Association
- Paid Database
- Investor Presentations

Step 4 - Data Triangulation
Involves using different sources of information in order to increase the validity of a study
These sources are likely to be stakeholders in a program - participants, other researchers, program staff, other community members, and so on.
Then we put all data in single framework & apply various statistical tools to find out the dynamic on the market.
During the analysis stage, feedback from the stakeholder groups would be compared to determine areas of agreement as well as areas of divergence


