
Key Insights
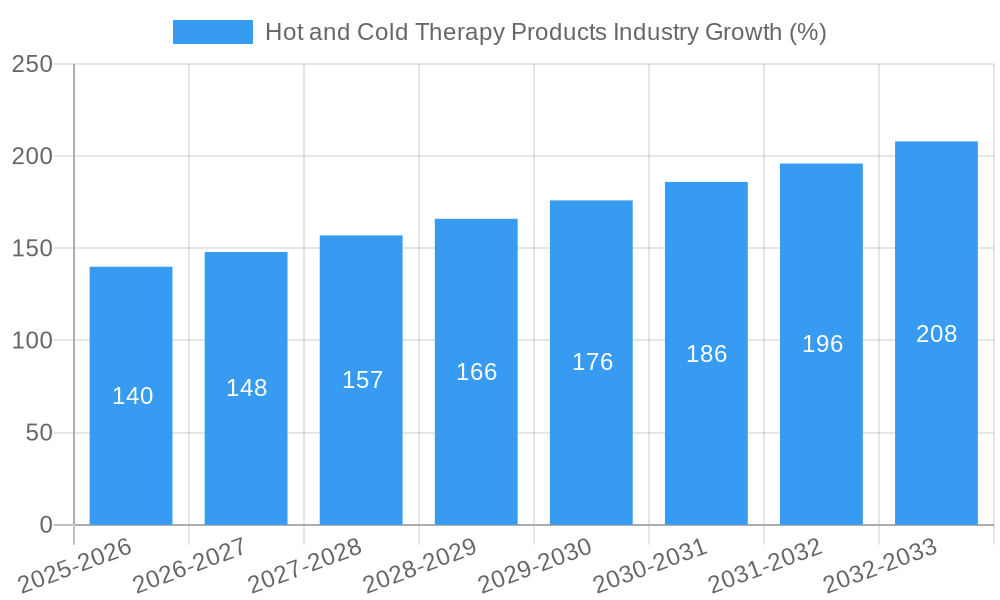
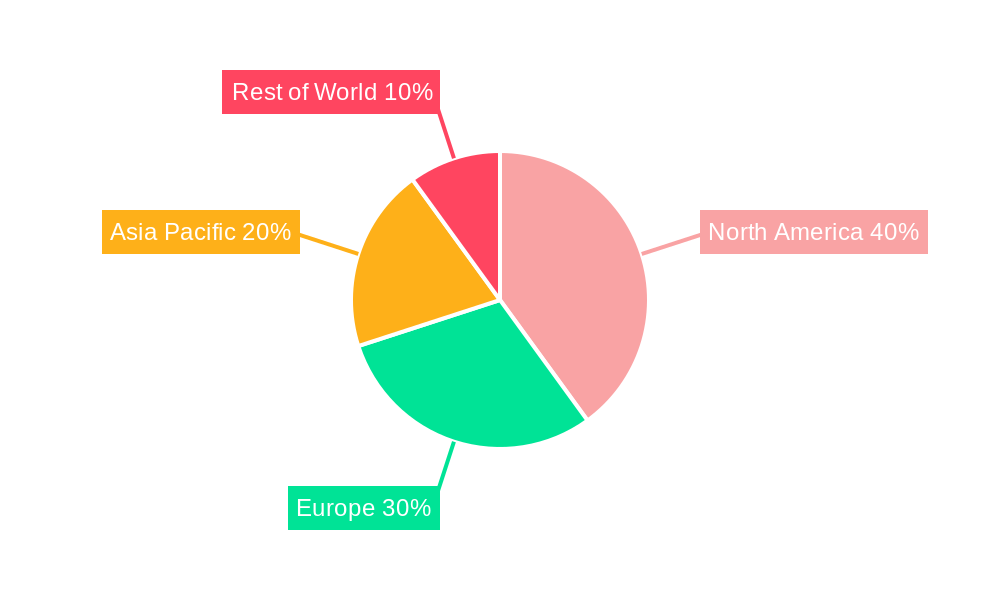
The global hot and cold therapy products market is experiencing robust growth, projected to reach a substantial size by 2033. A Compound Annual Growth Rate (CAGR) of 5.60% from 2025 to 2033 signifies consistent market expansion, driven by several key factors. Increasing prevalence of chronic conditions like arthritis and back pain, coupled with rising awareness of non-pharmaceutical pain management options, fuels significant demand. The convenience and accessibility of hot and cold packs, their effectiveness in reducing inflammation and pain, and their affordability compared to other therapies all contribute to market growth. Furthermore, advancements in product technology, such as the introduction of reusable and eco-friendly gel packs and the development of instant activation packs, are enhancing market appeal. Segment-wise, instant electric packs are gaining traction due to their convenience, while the sports injury application segment demonstrates particularly strong growth due to increased participation in athletic activities. Geographical analysis reveals that North America and Europe currently hold substantial market shares, largely owing to established healthcare infrastructure and high consumer spending on healthcare products. However, the Asia-Pacific region is expected to show significant growth potential over the forecast period driven by rising disposable incomes and improving healthcare awareness. Competition is relatively strong with both established multinational corporations and smaller specialized players vying for market share, promoting innovation and product diversification.
Market restraints primarily involve concerns about potential skin burns from improper use and limited long-term efficacy compared to other therapies. However, improved product safety features and ongoing research addressing these concerns should mitigate these challenges. The market is expected to witness continued innovation in areas such as improved materials, enhanced temperature control mechanisms, and the development of smart packs integrated with digital health technologies. This will enhance user experience, facilitate accurate therapy application, and potentially open new avenues for market expansion within both consumer and professional healthcare sectors. The ongoing focus on developing sustainable and environmentally friendly products will also play a significant role in shaping the market's future trajectory. Considering the above factors, the hot and cold therapy products market exhibits a promising outlook for sustained expansion in the coming years.
This comprehensive report provides an in-depth analysis of the global Hot and Cold Therapy Products industry, offering valuable insights for stakeholders across the value chain. Covering the period 2019-2033, with a focus on 2025 as the base and estimated year, this report forecasts market trends and identifies key opportunities for growth. The report segments the market by type (Instant Electric Hot/Cold Packs, Dry and Moist Hot and Cold Packs, Gel Packs) and application (Sports Injury, Neuropathic Pain, Surgery, Other Applications), analyzing competitive dynamics, industry developments, and future outlook. The market size is valued in Millions.
Hot and Cold Therapy Products Industry Market Structure & Competitive Dynamics
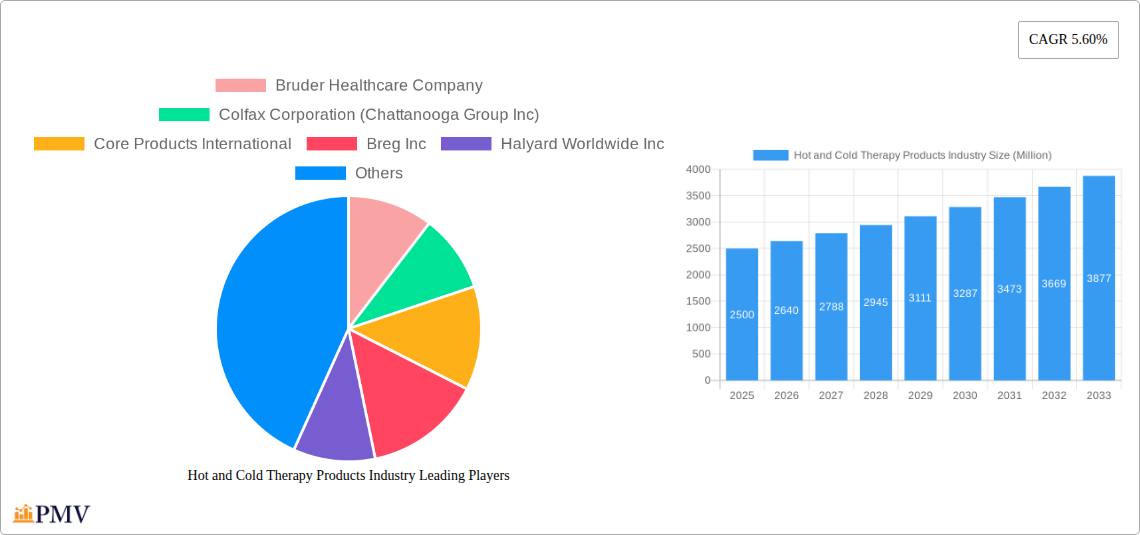
The Hot and Cold Therapy Products market exhibits a moderately consolidated structure with several key players commanding significant market share. Major players, including Bruder Healthcare Company, Colfax Corporation (Chattanooga Group Inc), Core Products International, Breg Inc, Halyard Worldwide Inc, 3M, Carex Health, Cardinal Health Inc, Caldera International Inc, and Pfizer Inc, compete based on product innovation, brand recognition, and distribution networks. Market share data for 2024 estimates that 3M holds approximately xx% market share, followed by Colfax Corporation at xx%, and Bruder Healthcare at xx%. The remaining share is distributed among other competitors.
Innovation within the industry focuses on developing more effective and convenient therapy products, including reusable and disposable options. Regulatory frameworks, particularly concerning safety and efficacy, play a significant role in shaping market dynamics. Substitutes for hot and cold therapy products include pharmaceutical pain relievers and other therapeutic modalities. End-user trends are moving towards more convenient, portable, and technologically advanced products. M&A activities have been relatively moderate in recent years, with deal values averaging approximately xx Million annually. Specific examples include minor acquisitions focused on expanding product lines or geographical reach (xx Million in 2023), and xx Million in 2022, however a precise number remains unavailable.
Hot and Cold Therapy Products Industry Industry Trends & Insights
The Hot and Cold Therapy Products market is experiencing steady growth, driven by factors such as an aging population, rising incidence of chronic pain conditions (like arthritis and back pain), and increasing participation in sports and recreational activities. The market experienced a CAGR of xx% during the historical period (2019-2024) and is projected to maintain a CAGR of xx% during the forecast period (2025-2033). This growth is supported by increasing market penetration of hot and cold therapy in diverse applications, including home healthcare, professional medical settings, and sports medicine clinics. The market penetration rate for these products is estimated to be at xx% in 2025. Technological disruptions, including the development of smart therapy devices with integrated monitoring and data analysis capabilities, are further enhancing market growth. Consumer preferences are shifting towards convenient, user-friendly, and reusable products. Competitive dynamics are shaped by product differentiation, pricing strategies, and brand loyalty.
Dominant Markets & Segments in Hot and Cold Therapy Products Industry
Leading Region: North America is currently the dominant market for hot and cold therapy products, driven by high healthcare expenditure, advanced medical infrastructure, and significant awareness about pain management solutions.
Leading Country: Within North America, the United States holds the largest market share owing to its large population, high prevalence of chronic pain conditions, and well-established healthcare system.
Leading Segment (By Type): Gel packs represent the largest segment by type, due to their versatility, reusability, and relatively lower cost compared to electric packs.
Leading Segment (By Application): Sports injury remains the largest application segment, attributed to the rising popularity of sports and fitness activities, coupled with a growing demand for effective injury management solutions.
Key Drivers for North American Dominance:
- Robust healthcare infrastructure and high healthcare expenditure.
- High prevalence of chronic pain conditions.
- Strong consumer awareness regarding pain management solutions.
- Well-established distribution networks.
Dominance Analysis: North America's dominance is anticipated to persist throughout the forecast period, primarily due to established market penetration and the high demand for pain management solutions. However, emerging economies in Asia-Pacific are projected to show faster growth rates, driven by increasing disposable income and rising healthcare awareness.
Hot and Cold Therapy Products Industry Product Innovations
Recent product innovations have focused on enhancing convenience, portability, and therapeutic efficacy. This includes the development of self-heating/cooling packs, smart devices with integrated temperature control and therapy tracking, and the incorporation of advanced materials for improved comfort and performance. These advancements cater to various needs, such as those for targeted pain relief, accelerated recovery, and enhanced user experience. The successful integration of such innovative products is enhancing market competitiveness.
Report Segmentation & Scope
By Type:
- Instant Electric Hot/Cold Packs: This segment offers convenience and rapid temperature change but may be limited by cost and reusability. Growth is projected to be xx Million by 2033.
- Dry and Moist Hot and Cold Packs: This segment provides flexibility in application and offers a balance of cost and efficacy. The market is expected to reach xx Million by 2033.
- Gel Packs: This segment dominates due to versatility, cost-effectiveness, and reusability. The market value is forecast to reach xx Million by 2033.
By Application:
- Sports Injury: This is the largest application segment, driven by increasing sports participation and demand for effective injury recovery solutions. The market is expected to be worth xx Million by 2033.
- Neuropathic Pain: This segment is growing steadily due to the rising prevalence of neurological disorders. The market is anticipated to reach xx Million by 2033.
- Surgery: Post-operative pain management is a significant driver for this segment. Market size is projected to reach xx Million by 2033.
- Other Applications: This includes applications in physiotherapy, physical therapy, and other healthcare settings. The market size is expected to reach xx Million by 2033.
Key Drivers of Hot and Cold Therapy Products Industry Growth
The Hot and Cold Therapy Products market is driven by several factors. The increasing prevalence of chronic pain conditions like arthritis and back pain fuels demand. Furthermore, the rising popularity of sports and fitness activities increases the need for effective injury recovery solutions. Technological advancements leading to more convenient and effective products also contribute significantly to market growth. Finally, increasing healthcare spending and improved access to healthcare in developing nations further stimulates market expansion.
Challenges in the Hot and Cold Therapy Products Industry Sector
The industry faces challenges such as stringent regulatory requirements for product safety and efficacy. Supply chain disruptions can also impact the availability and cost of raw materials. Furthermore, intense competition from established players and new entrants presents significant pressure. The combined impact of these factors can lead to fluctuating market prices and reduced profit margins. Specifically, the cost of raw materials increased by xx% in 2022, impacting overall market profitability.
Leading Players in the Hot and Cold Therapy Products Industry Market
- Bruder Healthcare Company
- Colfax Corporation (Chattanooga Group Inc)
- Core Products International
- Breg Inc
- Halyard Worldwide Inc
- 3M
- Carex Health
- Cardinal Health Inc
- Caldera International Inc
- Pfizer Inc
Key Developments in Hot and Cold Therapy Products Industry Sector
- June 2022: Healthy Extracts Inc. launched Brain Activate - Gel, a unique proprietary gel pack formulation.
- May 2021: Mueller Sports Medicine partnered with Zenith Technical Innovations to provide Therm-X, an all-in-one portable device that provides heat, cold, compression, and contrast therapy.
Strategic Hot and Cold Therapy Products Industry Market Outlook
The future of the Hot and Cold Therapy Products market looks promising, driven by continuous innovation, increasing healthcare spending, and growing awareness of the benefits of these therapies. Strategic opportunities exist in developing technologically advanced products, expanding into emerging markets, and forging strategic partnerships. Focus on sustainability and eco-friendly materials will also be crucial for long-term success. The market is expected to experience significant expansion over the next decade, with substantial growth potential in various segments and applications.
Hot and Cold Therapy Products Industry Segmentation
-
1. Type
- 1.1. Instant Electric Hot/Cold Packs
- 1.2. Dry and Moist Hot and Cold Packs
- 1.3. Gel Packs
-
2. Application
- 2.1. Sports Injury
- 2.2. Neuropathic Pain
- 2.3. Surgery
- 2.4. Other Applications
Hot and Cold Therapy Products Industry Segmentation By Geography
-
1. North America
- 1.1. United states
- 1.2. Canada
- 1.3. Mexico
-
2. Europe
- 2.1. Germany
- 2.2. United Kingdom
- 2.3. France
- 2.4. Italy
- 2.5. Spain
- 2.6. Rest of Europe
-
3. Asia Pacific
- 3.1. China
- 3.2. Japan
- 3.3. India
- 3.4. Australia
- 3.5. South Korea
- 3.6. Rest of Asia Pacific
- 4. Middle East
-
5. GCC
- 5.1. South Africa
- 5.2. Rest of Middle East
-
6. South America
- 6.1. Brazil
- 6.2. Argentina
- 6.3. Rest of South America
Hot and Cold Therapy Products Industry REPORT HIGHLIGHTS
| Aspects | Details |
|---|---|
| Study Period | 2019-2033 |
| Base Year | 2024 |
| Estimated Year | 2025 |
| Forecast Period | 2025-2033 |
| Historical Period | 2019-2024 |
| Growth Rate | CAGR of 5.60% from 2019-2033 |
| Segmentation |
|
Table of Contents
- 1. Introduction
- 1.1. Research Scope
- 1.2. Market Segmentation
- 1.3. Research Methodology
- 1.4. Definitions and Assumptions
- 2. Executive Summary
- 2.1. Introduction
- 3. Market Dynamics
- 3.1. Introduction
- 3.2. Market Drivers
- 3.2.1. Rising Investments by Key Players; Increasing Prevalence of Accidents and Chronic Pains
- 3.3. Market Restrains
- 3.3.1. Lack of Awareness about Treatment Options for Pain Management
- 3.4. Market Trends
- 3.4.1. Dry and Moist Hot and Cold Packs are Expected to Hold the Major Market Share in the Hot and Cold Therapy Packs Market
- 4. Market Factor Analysis
- 4.1. Porters Five Forces
- 4.2. Supply/Value Chain
- 4.3. PESTEL analysis
- 4.4. Market Entropy
- 4.5. Patent/Trademark Analysis
- 5. Global Hot and Cold Therapy Products Industry Analysis, Insights and Forecast, 2019-2031
- 5.1. Market Analysis, Insights and Forecast - by Type
- 5.1.1. Instant Electric Hot/Cold Packs
- 5.1.2. Dry and Moist Hot and Cold Packs
- 5.1.3. Gel Packs
- 5.2. Market Analysis, Insights and Forecast - by Application
- 5.2.1. Sports Injury
- 5.2.2. Neuropathic Pain
- 5.2.3. Surgery
- 5.2.4. Other Applications
- 5.3. Market Analysis, Insights and Forecast - by Region
- 5.3.1. North America
- 5.3.2. Europe
- 5.3.3. Asia Pacific
- 5.3.4. Middle East
- 5.3.5. GCC
- 5.3.6. South America
- 5.1. Market Analysis, Insights and Forecast - by Type
- 6. North America Hot and Cold Therapy Products Industry Analysis, Insights and Forecast, 2019-2031
- 6.1. Market Analysis, Insights and Forecast - by Type
- 6.1.1. Instant Electric Hot/Cold Packs
- 6.1.2. Dry and Moist Hot and Cold Packs
- 6.1.3. Gel Packs
- 6.2. Market Analysis, Insights and Forecast - by Application
- 6.2.1. Sports Injury
- 6.2.2. Neuropathic Pain
- 6.2.3. Surgery
- 6.2.4. Other Applications
- 6.1. Market Analysis, Insights and Forecast - by Type
- 7. Europe Hot and Cold Therapy Products Industry Analysis, Insights and Forecast, 2019-2031
- 7.1. Market Analysis, Insights and Forecast - by Type
- 7.1.1. Instant Electric Hot/Cold Packs
- 7.1.2. Dry and Moist Hot and Cold Packs
- 7.1.3. Gel Packs
- 7.2. Market Analysis, Insights and Forecast - by Application
- 7.2.1. Sports Injury
- 7.2.2. Neuropathic Pain
- 7.2.3. Surgery
- 7.2.4. Other Applications
- 7.1. Market Analysis, Insights and Forecast - by Type
- 8. Asia Pacific Hot and Cold Therapy Products Industry Analysis, Insights and Forecast, 2019-2031
- 8.1. Market Analysis, Insights and Forecast - by Type
- 8.1.1. Instant Electric Hot/Cold Packs
- 8.1.2. Dry and Moist Hot and Cold Packs
- 8.1.3. Gel Packs
- 8.2. Market Analysis, Insights and Forecast - by Application
- 8.2.1. Sports Injury
- 8.2.2. Neuropathic Pain
- 8.2.3. Surgery
- 8.2.4. Other Applications
- 8.1. Market Analysis, Insights and Forecast - by Type
- 9. Middle East Hot and Cold Therapy Products Industry Analysis, Insights and Forecast, 2019-2031
- 9.1. Market Analysis, Insights and Forecast - by Type
- 9.1.1. Instant Electric Hot/Cold Packs
- 9.1.2. Dry and Moist Hot and Cold Packs
- 9.1.3. Gel Packs
- 9.2. Market Analysis, Insights and Forecast - by Application
- 9.2.1. Sports Injury
- 9.2.2. Neuropathic Pain
- 9.2.3. Surgery
- 9.2.4. Other Applications
- 9.1. Market Analysis, Insights and Forecast - by Type
- 10. GCC Hot and Cold Therapy Products Industry Analysis, Insights and Forecast, 2019-2031
- 10.1. Market Analysis, Insights and Forecast - by Type
- 10.1.1. Instant Electric Hot/Cold Packs
- 10.1.2. Dry and Moist Hot and Cold Packs
- 10.1.3. Gel Packs
- 10.2. Market Analysis, Insights and Forecast - by Application
- 10.2.1. Sports Injury
- 10.2.2. Neuropathic Pain
- 10.2.3. Surgery
- 10.2.4. Other Applications
- 10.1. Market Analysis, Insights and Forecast - by Type
- 11. South America Hot and Cold Therapy Products Industry Analysis, Insights and Forecast, 2019-2031
- 11.1. Market Analysis, Insights and Forecast - by Type
- 11.1.1. Instant Electric Hot/Cold Packs
- 11.1.2. Dry and Moist Hot and Cold Packs
- 11.1.3. Gel Packs
- 11.2. Market Analysis, Insights and Forecast - by Application
- 11.2.1. Sports Injury
- 11.2.2. Neuropathic Pain
- 11.2.3. Surgery
- 11.2.4. Other Applications
- 11.1. Market Analysis, Insights and Forecast - by Type
- 12. North America Hot and Cold Therapy Products Industry Analysis, Insights and Forecast, 2019-2031
- 12.1. Market Analysis, Insights and Forecast - By Country/Sub-region
- 12.1.1 United states
- 12.1.2 Canada
- 12.1.3 Mexico
- 13. South America Hot and Cold Therapy Products Industry Analysis, Insights and Forecast, 2019-2031
- 13.1. Market Analysis, Insights and Forecast - By Country/Sub-region
- 13.1.1 Brazil
- 13.1.2 Mexico
- 13.1.3 Rest of South America
- 14. Europe Hot and Cold Therapy Products Industry Analysis, Insights and Forecast, 2019-2031
- 14.1. Market Analysis, Insights and Forecast - By Country/Sub-region
- 14.1.1 United Kingdom
- 14.1.2 Germany
- 14.1.3 France
- 14.1.4 Italy
- 14.1.5 Spain
- 14.1.6 Russia
- 14.1.7 Rest of Europe
- 15. Asia Pacific Hot and Cold Therapy Products Industry Analysis, Insights and Forecast, 2019-2031
- 15.1. Market Analysis, Insights and Forecast - By Country/Sub-region
- 15.1.1 China
- 15.1.2 Japan
- 15.1.3 India
- 15.1.4 South Korea
- 15.1.5 Taiwan
- 15.1.6 Australia
- 15.1.7 Rest of Asia-Pacific
- 16. MEA Hot and Cold Therapy Products Industry Analysis, Insights and Forecast, 2019-2031
- 16.1. Market Analysis, Insights and Forecast - By Country/Sub-region
- 16.1.1 Middle East
- 16.1.2 Africa
- 17. Competitive Analysis
- 17.1. Global Market Share Analysis 2024
- 17.2. Company Profiles
- 17.2.1 Bruder Healthcare Company
- 17.2.1.1. Overview
- 17.2.1.2. Products
- 17.2.1.3. SWOT Analysis
- 17.2.1.4. Recent Developments
- 17.2.1.5. Financials (Based on Availability)
- 17.2.2 Colfax Corporation (Chattanooga Group Inc)
- 17.2.2.1. Overview
- 17.2.2.2. Products
- 17.2.2.3. SWOT Analysis
- 17.2.2.4. Recent Developments
- 17.2.2.5. Financials (Based on Availability)
- 17.2.3 Core Products International
- 17.2.3.1. Overview
- 17.2.3.2. Products
- 17.2.3.3. SWOT Analysis
- 17.2.3.4. Recent Developments
- 17.2.3.5. Financials (Based on Availability)
- 17.2.4 Breg Inc
- 17.2.4.1. Overview
- 17.2.4.2. Products
- 17.2.4.3. SWOT Analysis
- 17.2.4.4. Recent Developments
- 17.2.4.5. Financials (Based on Availability)
- 17.2.5 Halyard Worldwide Inc
- 17.2.5.1. Overview
- 17.2.5.2. Products
- 17.2.5.3. SWOT Analysis
- 17.2.5.4. Recent Developments
- 17.2.5.5. Financials (Based on Availability)
- 17.2.6 3M
- 17.2.6.1. Overview
- 17.2.6.2. Products
- 17.2.6.3. SWOT Analysis
- 17.2.6.4. Recent Developments
- 17.2.6.5. Financials (Based on Availability)
- 17.2.7 Carex Health
- 17.2.7.1. Overview
- 17.2.7.2. Products
- 17.2.7.3. SWOT Analysis
- 17.2.7.4. Recent Developments
- 17.2.7.5. Financials (Based on Availability)
- 17.2.8 Cardinal Health Inc
- 17.2.8.1. Overview
- 17.2.8.2. Products
- 17.2.8.3. SWOT Analysis
- 17.2.8.4. Recent Developments
- 17.2.8.5. Financials (Based on Availability)
- 17.2.9 Caldera International Inc
- 17.2.9.1. Overview
- 17.2.9.2. Products
- 17.2.9.3. SWOT Analysis
- 17.2.9.4. Recent Developments
- 17.2.9.5. Financials (Based on Availability)
- 17.2.10 Pfizer Inc
- 17.2.10.1. Overview
- 17.2.10.2. Products
- 17.2.10.3. SWOT Analysis
- 17.2.10.4. Recent Developments
- 17.2.10.5. Financials (Based on Availability)
- 17.2.1 Bruder Healthcare Company
List of Figures
- Figure 1: Global Hot and Cold Therapy Products Industry Revenue Breakdown (Million, %) by Region 2024 & 2032
- Figure 2: Global Hot and Cold Therapy Products Industry Volume Breakdown (K Units, %) by Region 2024 & 2032
- Figure 3: North America Hot and Cold Therapy Products Industry Revenue (Million), by Country 2024 & 2032
- Figure 4: North America Hot and Cold Therapy Products Industry Volume (K Units), by Country 2024 & 2032
- Figure 5: North America Hot and Cold Therapy Products Industry Revenue Share (%), by Country 2024 & 2032
- Figure 6: North America Hot and Cold Therapy Products Industry Volume Share (%), by Country 2024 & 2032
- Figure 7: South America Hot and Cold Therapy Products Industry Revenue (Million), by Country 2024 & 2032
- Figure 8: South America Hot and Cold Therapy Products Industry Volume (K Units), by Country 2024 & 2032
- Figure 9: South America Hot and Cold Therapy Products Industry Revenue Share (%), by Country 2024 & 2032
- Figure 10: South America Hot and Cold Therapy Products Industry Volume Share (%), by Country 2024 & 2032
- Figure 11: Europe Hot and Cold Therapy Products Industry Revenue (Million), by Country 2024 & 2032
- Figure 12: Europe Hot and Cold Therapy Products Industry Volume (K Units), by Country 2024 & 2032
- Figure 13: Europe Hot and Cold Therapy Products Industry Revenue Share (%), by Country 2024 & 2032
- Figure 14: Europe Hot and Cold Therapy Products Industry Volume Share (%), by Country 2024 & 2032
- Figure 15: Asia Pacific Hot and Cold Therapy Products Industry Revenue (Million), by Country 2024 & 2032
- Figure 16: Asia Pacific Hot and Cold Therapy Products Industry Volume (K Units), by Country 2024 & 2032
- Figure 17: Asia Pacific Hot and Cold Therapy Products Industry Revenue Share (%), by Country 2024 & 2032
- Figure 18: Asia Pacific Hot and Cold Therapy Products Industry Volume Share (%), by Country 2024 & 2032
- Figure 19: MEA Hot and Cold Therapy Products Industry Revenue (Million), by Country 2024 & 2032
- Figure 20: MEA Hot and Cold Therapy Products Industry Volume (K Units), by Country 2024 & 2032
- Figure 21: MEA Hot and Cold Therapy Products Industry Revenue Share (%), by Country 2024 & 2032
- Figure 22: MEA Hot and Cold Therapy Products Industry Volume Share (%), by Country 2024 & 2032
- Figure 23: North America Hot and Cold Therapy Products Industry Revenue (Million), by Type 2024 & 2032
- Figure 24: North America Hot and Cold Therapy Products Industry Volume (K Units), by Type 2024 & 2032
- Figure 25: North America Hot and Cold Therapy Products Industry Revenue Share (%), by Type 2024 & 2032
- Figure 26: North America Hot and Cold Therapy Products Industry Volume Share (%), by Type 2024 & 2032
- Figure 27: North America Hot and Cold Therapy Products Industry Revenue (Million), by Application 2024 & 2032
- Figure 28: North America Hot and Cold Therapy Products Industry Volume (K Units), by Application 2024 & 2032
- Figure 29: North America Hot and Cold Therapy Products Industry Revenue Share (%), by Application 2024 & 2032
- Figure 30: North America Hot and Cold Therapy Products Industry Volume Share (%), by Application 2024 & 2032
- Figure 31: North America Hot and Cold Therapy Products Industry Revenue (Million), by Country 2024 & 2032
- Figure 32: North America Hot and Cold Therapy Products Industry Volume (K Units), by Country 2024 & 2032
- Figure 33: North America Hot and Cold Therapy Products Industry Revenue Share (%), by Country 2024 & 2032
- Figure 34: North America Hot and Cold Therapy Products Industry Volume Share (%), by Country 2024 & 2032
- Figure 35: Europe Hot and Cold Therapy Products Industry Revenue (Million), by Type 2024 & 2032
- Figure 36: Europe Hot and Cold Therapy Products Industry Volume (K Units), by Type 2024 & 2032
- Figure 37: Europe Hot and Cold Therapy Products Industry Revenue Share (%), by Type 2024 & 2032
- Figure 38: Europe Hot and Cold Therapy Products Industry Volume Share (%), by Type 2024 & 2032
- Figure 39: Europe Hot and Cold Therapy Products Industry Revenue (Million), by Application 2024 & 2032
- Figure 40: Europe Hot and Cold Therapy Products Industry Volume (K Units), by Application 2024 & 2032
- Figure 41: Europe Hot and Cold Therapy Products Industry Revenue Share (%), by Application 2024 & 2032
- Figure 42: Europe Hot and Cold Therapy Products Industry Volume Share (%), by Application 2024 & 2032
- Figure 43: Europe Hot and Cold Therapy Products Industry Revenue (Million), by Country 2024 & 2032
- Figure 44: Europe Hot and Cold Therapy Products Industry Volume (K Units), by Country 2024 & 2032
- Figure 45: Europe Hot and Cold Therapy Products Industry Revenue Share (%), by Country 2024 & 2032
- Figure 46: Europe Hot and Cold Therapy Products Industry Volume Share (%), by Country 2024 & 2032
- Figure 47: Asia Pacific Hot and Cold Therapy Products Industry Revenue (Million), by Type 2024 & 2032
- Figure 48: Asia Pacific Hot and Cold Therapy Products Industry Volume (K Units), by Type 2024 & 2032
- Figure 49: Asia Pacific Hot and Cold Therapy Products Industry Revenue Share (%), by Type 2024 & 2032
- Figure 50: Asia Pacific Hot and Cold Therapy Products Industry Volume Share (%), by Type 2024 & 2032
- Figure 51: Asia Pacific Hot and Cold Therapy Products Industry Revenue (Million), by Application 2024 & 2032
- Figure 52: Asia Pacific Hot and Cold Therapy Products Industry Volume (K Units), by Application 2024 & 2032
- Figure 53: Asia Pacific Hot and Cold Therapy Products Industry Revenue Share (%), by Application 2024 & 2032
- Figure 54: Asia Pacific Hot and Cold Therapy Products Industry Volume Share (%), by Application 2024 & 2032
- Figure 55: Asia Pacific Hot and Cold Therapy Products Industry Revenue (Million), by Country 2024 & 2032
- Figure 56: Asia Pacific Hot and Cold Therapy Products Industry Volume (K Units), by Country 2024 & 2032
- Figure 57: Asia Pacific Hot and Cold Therapy Products Industry Revenue Share (%), by Country 2024 & 2032
- Figure 58: Asia Pacific Hot and Cold Therapy Products Industry Volume Share (%), by Country 2024 & 2032
- Figure 59: Middle East Hot and Cold Therapy Products Industry Revenue (Million), by Type 2024 & 2032
- Figure 60: Middle East Hot and Cold Therapy Products Industry Volume (K Units), by Type 2024 & 2032
- Figure 61: Middle East Hot and Cold Therapy Products Industry Revenue Share (%), by Type 2024 & 2032
- Figure 62: Middle East Hot and Cold Therapy Products Industry Volume Share (%), by Type 2024 & 2032
- Figure 63: Middle East Hot and Cold Therapy Products Industry Revenue (Million), by Application 2024 & 2032
- Figure 64: Middle East Hot and Cold Therapy Products Industry Volume (K Units), by Application 2024 & 2032
- Figure 65: Middle East Hot and Cold Therapy Products Industry Revenue Share (%), by Application 2024 & 2032
- Figure 66: Middle East Hot and Cold Therapy Products Industry Volume Share (%), by Application 2024 & 2032
- Figure 67: Middle East Hot and Cold Therapy Products Industry Revenue (Million), by Country 2024 & 2032
- Figure 68: Middle East Hot and Cold Therapy Products Industry Volume (K Units), by Country 2024 & 2032
- Figure 69: Middle East Hot and Cold Therapy Products Industry Revenue Share (%), by Country 2024 & 2032
- Figure 70: Middle East Hot and Cold Therapy Products Industry Volume Share (%), by Country 2024 & 2032
- Figure 71: GCC Hot and Cold Therapy Products Industry Revenue (Million), by Type 2024 & 2032
- Figure 72: GCC Hot and Cold Therapy Products Industry Volume (K Units), by Type 2024 & 2032
- Figure 73: GCC Hot and Cold Therapy Products Industry Revenue Share (%), by Type 2024 & 2032
- Figure 74: GCC Hot and Cold Therapy Products Industry Volume Share (%), by Type 2024 & 2032
- Figure 75: GCC Hot and Cold Therapy Products Industry Revenue (Million), by Application 2024 & 2032
- Figure 76: GCC Hot and Cold Therapy Products Industry Volume (K Units), by Application 2024 & 2032
- Figure 77: GCC Hot and Cold Therapy Products Industry Revenue Share (%), by Application 2024 & 2032
- Figure 78: GCC Hot and Cold Therapy Products Industry Volume Share (%), by Application 2024 & 2032
- Figure 79: GCC Hot and Cold Therapy Products Industry Revenue (Million), by Country 2024 & 2032
- Figure 80: GCC Hot and Cold Therapy Products Industry Volume (K Units), by Country 2024 & 2032
- Figure 81: GCC Hot and Cold Therapy Products Industry Revenue Share (%), by Country 2024 & 2032
- Figure 82: GCC Hot and Cold Therapy Products Industry Volume Share (%), by Country 2024 & 2032
- Figure 83: South America Hot and Cold Therapy Products Industry Revenue (Million), by Type 2024 & 2032
- Figure 84: South America Hot and Cold Therapy Products Industry Volume (K Units), by Type 2024 & 2032
- Figure 85: South America Hot and Cold Therapy Products Industry Revenue Share (%), by Type 2024 & 2032
- Figure 86: South America Hot and Cold Therapy Products Industry Volume Share (%), by Type 2024 & 2032
- Figure 87: South America Hot and Cold Therapy Products Industry Revenue (Million), by Application 2024 & 2032
- Figure 88: South America Hot and Cold Therapy Products Industry Volume (K Units), by Application 2024 & 2032
- Figure 89: South America Hot and Cold Therapy Products Industry Revenue Share (%), by Application 2024 & 2032
- Figure 90: South America Hot and Cold Therapy Products Industry Volume Share (%), by Application 2024 & 2032
- Figure 91: South America Hot and Cold Therapy Products Industry Revenue (Million), by Country 2024 & 2032
- Figure 92: South America Hot and Cold Therapy Products Industry Volume (K Units), by Country 2024 & 2032
- Figure 93: South America Hot and Cold Therapy Products Industry Revenue Share (%), by Country 2024 & 2032
- Figure 94: South America Hot and Cold Therapy Products Industry Volume Share (%), by Country 2024 & 2032
List of Tables
- Table 1: Global Hot and Cold Therapy Products Industry Revenue Million Forecast, by Region 2019 & 2032
- Table 2: Global Hot and Cold Therapy Products Industry Volume K Units Forecast, by Region 2019 & 2032
- Table 3: Global Hot and Cold Therapy Products Industry Revenue Million Forecast, by Type 2019 & 2032
- Table 4: Global Hot and Cold Therapy Products Industry Volume K Units Forecast, by Type 2019 & 2032
- Table 5: Global Hot and Cold Therapy Products Industry Revenue Million Forecast, by Application 2019 & 2032
- Table 6: Global Hot and Cold Therapy Products Industry Volume K Units Forecast, by Application 2019 & 2032
- Table 7: Global Hot and Cold Therapy Products Industry Revenue Million Forecast, by Region 2019 & 2032
- Table 8: Global Hot and Cold Therapy Products Industry Volume K Units Forecast, by Region 2019 & 2032
- Table 9: Global Hot and Cold Therapy Products Industry Revenue Million Forecast, by Country 2019 & 2032
- Table 10: Global Hot and Cold Therapy Products Industry Volume K Units Forecast, by Country 2019 & 2032
- Table 11: United states Hot and Cold Therapy Products Industry Revenue (Million) Forecast, by Application 2019 & 2032
- Table 12: United states Hot and Cold Therapy Products Industry Volume (K Units) Forecast, by Application 2019 & 2032
- Table 13: Canada Hot and Cold Therapy Products Industry Revenue (Million) Forecast, by Application 2019 & 2032
- Table 14: Canada Hot and Cold Therapy Products Industry Volume (K Units) Forecast, by Application 2019 & 2032
- Table 15: Mexico Hot and Cold Therapy Products Industry Revenue (Million) Forecast, by Application 2019 & 2032
- Table 16: Mexico Hot and Cold Therapy Products Industry Volume (K Units) Forecast, by Application 2019 & 2032
- Table 17: Global Hot and Cold Therapy Products Industry Revenue Million Forecast, by Country 2019 & 2032
- Table 18: Global Hot and Cold Therapy Products Industry Volume K Units Forecast, by Country 2019 & 2032
- Table 19: Brazil Hot and Cold Therapy Products Industry Revenue (Million) Forecast, by Application 2019 & 2032
- Table 20: Brazil Hot and Cold Therapy Products Industry Volume (K Units) Forecast, by Application 2019 & 2032
- Table 21: Mexico Hot and Cold Therapy Products Industry Revenue (Million) Forecast, by Application 2019 & 2032
- Table 22: Mexico Hot and Cold Therapy Products Industry Volume (K Units) Forecast, by Application 2019 & 2032
- Table 23: Rest of South America Hot and Cold Therapy Products Industry Revenue (Million) Forecast, by Application 2019 & 2032
- Table 24: Rest of South America Hot and Cold Therapy Products Industry Volume (K Units) Forecast, by Application 2019 & 2032
- Table 25: Global Hot and Cold Therapy Products Industry Revenue Million Forecast, by Country 2019 & 2032
- Table 26: Global Hot and Cold Therapy Products Industry Volume K Units Forecast, by Country 2019 & 2032
- Table 27: United Kingdom Hot and Cold Therapy Products Industry Revenue (Million) Forecast, by Application 2019 & 2032
- Table 28: United Kingdom Hot and Cold Therapy Products Industry Volume (K Units) Forecast, by Application 2019 & 2032
- Table 29: Germany Hot and Cold Therapy Products Industry Revenue (Million) Forecast, by Application 2019 & 2032
- Table 30: Germany Hot and Cold Therapy Products Industry Volume (K Units) Forecast, by Application 2019 & 2032
- Table 31: France Hot and Cold Therapy Products Industry Revenue (Million) Forecast, by Application 2019 & 2032
- Table 32: France Hot and Cold Therapy Products Industry Volume (K Units) Forecast, by Application 2019 & 2032
- Table 33: Italy Hot and Cold Therapy Products Industry Revenue (Million) Forecast, by Application 2019 & 2032
- Table 34: Italy Hot and Cold Therapy Products Industry Volume (K Units) Forecast, by Application 2019 & 2032
- Table 35: Spain Hot and Cold Therapy Products Industry Revenue (Million) Forecast, by Application 2019 & 2032
- Table 36: Spain Hot and Cold Therapy Products Industry Volume (K Units) Forecast, by Application 2019 & 2032
- Table 37: Russia Hot and Cold Therapy Products Industry Revenue (Million) Forecast, by Application 2019 & 2032
- Table 38: Russia Hot and Cold Therapy Products Industry Volume (K Units) Forecast, by Application 2019 & 2032
- Table 39: Rest of Europe Hot and Cold Therapy Products Industry Revenue (Million) Forecast, by Application 2019 & 2032
- Table 40: Rest of Europe Hot and Cold Therapy Products Industry Volume (K Units) Forecast, by Application 2019 & 2032
- Table 41: Global Hot and Cold Therapy Products Industry Revenue Million Forecast, by Country 2019 & 2032
- Table 42: Global Hot and Cold Therapy Products Industry Volume K Units Forecast, by Country 2019 & 2032
- Table 43: China Hot and Cold Therapy Products Industry Revenue (Million) Forecast, by Application 2019 & 2032
- Table 44: China Hot and Cold Therapy Products Industry Volume (K Units) Forecast, by Application 2019 & 2032
- Table 45: Japan Hot and Cold Therapy Products Industry Revenue (Million) Forecast, by Application 2019 & 2032
- Table 46: Japan Hot and Cold Therapy Products Industry Volume (K Units) Forecast, by Application 2019 & 2032
- Table 47: India Hot and Cold Therapy Products Industry Revenue (Million) Forecast, by Application 2019 & 2032
- Table 48: India Hot and Cold Therapy Products Industry Volume (K Units) Forecast, by Application 2019 & 2032
- Table 49: South Korea Hot and Cold Therapy Products Industry Revenue (Million) Forecast, by Application 2019 & 2032
- Table 50: South Korea Hot and Cold Therapy Products Industry Volume (K Units) Forecast, by Application 2019 & 2032
- Table 51: Taiwan Hot and Cold Therapy Products Industry Revenue (Million) Forecast, by Application 2019 & 2032
- Table 52: Taiwan Hot and Cold Therapy Products Industry Volume (K Units) Forecast, by Application 2019 & 2032
- Table 53: Australia Hot and Cold Therapy Products Industry Revenue (Million) Forecast, by Application 2019 & 2032
- Table 54: Australia Hot and Cold Therapy Products Industry Volume (K Units) Forecast, by Application 2019 & 2032
- Table 55: Rest of Asia-Pacific Hot and Cold Therapy Products Industry Revenue (Million) Forecast, by Application 2019 & 2032
- Table 56: Rest of Asia-Pacific Hot and Cold Therapy Products Industry Volume (K Units) Forecast, by Application 2019 & 2032
- Table 57: Global Hot and Cold Therapy Products Industry Revenue Million Forecast, by Country 2019 & 2032
- Table 58: Global Hot and Cold Therapy Products Industry Volume K Units Forecast, by Country 2019 & 2032
- Table 59: Middle East Hot and Cold Therapy Products Industry Revenue (Million) Forecast, by Application 2019 & 2032
- Table 60: Middle East Hot and Cold Therapy Products Industry Volume (K Units) Forecast, by Application 2019 & 2032
- Table 61: Africa Hot and Cold Therapy Products Industry Revenue (Million) Forecast, by Application 2019 & 2032
- Table 62: Africa Hot and Cold Therapy Products Industry Volume (K Units) Forecast, by Application 2019 & 2032
- Table 63: Global Hot and Cold Therapy Products Industry Revenue Million Forecast, by Type 2019 & 2032
- Table 64: Global Hot and Cold Therapy Products Industry Volume K Units Forecast, by Type 2019 & 2032
- Table 65: Global Hot and Cold Therapy Products Industry Revenue Million Forecast, by Application 2019 & 2032
- Table 66: Global Hot and Cold Therapy Products Industry Volume K Units Forecast, by Application 2019 & 2032
- Table 67: Global Hot and Cold Therapy Products Industry Revenue Million Forecast, by Country 2019 & 2032
- Table 68: Global Hot and Cold Therapy Products Industry Volume K Units Forecast, by Country 2019 & 2032
- Table 69: United states Hot and Cold Therapy Products Industry Revenue (Million) Forecast, by Application 2019 & 2032
- Table 70: United states Hot and Cold Therapy Products Industry Volume (K Units) Forecast, by Application 2019 & 2032
- Table 71: Canada Hot and Cold Therapy Products Industry Revenue (Million) Forecast, by Application 2019 & 2032
- Table 72: Canada Hot and Cold Therapy Products Industry Volume (K Units) Forecast, by Application 2019 & 2032
- Table 73: Mexico Hot and Cold Therapy Products Industry Revenue (Million) Forecast, by Application 2019 & 2032
- Table 74: Mexico Hot and Cold Therapy Products Industry Volume (K Units) Forecast, by Application 2019 & 2032
- Table 75: Global Hot and Cold Therapy Products Industry Revenue Million Forecast, by Type 2019 & 2032
- Table 76: Global Hot and Cold Therapy Products Industry Volume K Units Forecast, by Type 2019 & 2032
- Table 77: Global Hot and Cold Therapy Products Industry Revenue Million Forecast, by Application 2019 & 2032
- Table 78: Global Hot and Cold Therapy Products Industry Volume K Units Forecast, by Application 2019 & 2032
- Table 79: Global Hot and Cold Therapy Products Industry Revenue Million Forecast, by Country 2019 & 2032
- Table 80: Global Hot and Cold Therapy Products Industry Volume K Units Forecast, by Country 2019 & 2032
- Table 81: Germany Hot and Cold Therapy Products Industry Revenue (Million) Forecast, by Application 2019 & 2032
- Table 82: Germany Hot and Cold Therapy Products Industry Volume (K Units) Forecast, by Application 2019 & 2032
- Table 83: United Kingdom Hot and Cold Therapy Products Industry Revenue (Million) Forecast, by Application 2019 & 2032
- Table 84: United Kingdom Hot and Cold Therapy Products Industry Volume (K Units) Forecast, by Application 2019 & 2032
- Table 85: France Hot and Cold Therapy Products Industry Revenue (Million) Forecast, by Application 2019 & 2032
- Table 86: France Hot and Cold Therapy Products Industry Volume (K Units) Forecast, by Application 2019 & 2032
- Table 87: Italy Hot and Cold Therapy Products Industry Revenue (Million) Forecast, by Application 2019 & 2032
- Table 88: Italy Hot and Cold Therapy Products Industry Volume (K Units) Forecast, by Application 2019 & 2032
- Table 89: Spain Hot and Cold Therapy Products Industry Revenue (Million) Forecast, by Application 2019 & 2032
- Table 90: Spain Hot and Cold Therapy Products Industry Volume (K Units) Forecast, by Application 2019 & 2032
- Table 91: Rest of Europe Hot and Cold Therapy Products Industry Revenue (Million) Forecast, by Application 2019 & 2032
- Table 92: Rest of Europe Hot and Cold Therapy Products Industry Volume (K Units) Forecast, by Application 2019 & 2032
- Table 93: Global Hot and Cold Therapy Products Industry Revenue Million Forecast, by Type 2019 & 2032
- Table 94: Global Hot and Cold Therapy Products Industry Volume K Units Forecast, by Type 2019 & 2032
- Table 95: Global Hot and Cold Therapy Products Industry Revenue Million Forecast, by Application 2019 & 2032
- Table 96: Global Hot and Cold Therapy Products Industry Volume K Units Forecast, by Application 2019 & 2032
- Table 97: Global Hot and Cold Therapy Products Industry Revenue Million Forecast, by Country 2019 & 2032
- Table 98: Global Hot and Cold Therapy Products Industry Volume K Units Forecast, by Country 2019 & 2032
- Table 99: China Hot and Cold Therapy Products Industry Revenue (Million) Forecast, by Application 2019 & 2032
- Table 100: China Hot and Cold Therapy Products Industry Volume (K Units) Forecast, by Application 2019 & 2032
- Table 101: Japan Hot and Cold Therapy Products Industry Revenue (Million) Forecast, by Application 2019 & 2032
- Table 102: Japan Hot and Cold Therapy Products Industry Volume (K Units) Forecast, by Application 2019 & 2032
- Table 103: India Hot and Cold Therapy Products Industry Revenue (Million) Forecast, by Application 2019 & 2032
- Table 104: India Hot and Cold Therapy Products Industry Volume (K Units) Forecast, by Application 2019 & 2032
- Table 105: Australia Hot and Cold Therapy Products Industry Revenue (Million) Forecast, by Application 2019 & 2032
- Table 106: Australia Hot and Cold Therapy Products Industry Volume (K Units) Forecast, by Application 2019 & 2032
- Table 107: South Korea Hot and Cold Therapy Products Industry Revenue (Million) Forecast, by Application 2019 & 2032
- Table 108: South Korea Hot and Cold Therapy Products Industry Volume (K Units) Forecast, by Application 2019 & 2032
- Table 109: Rest of Asia Pacific Hot and Cold Therapy Products Industry Revenue (Million) Forecast, by Application 2019 & 2032
- Table 110: Rest of Asia Pacific Hot and Cold Therapy Products Industry Volume (K Units) Forecast, by Application 2019 & 2032
- Table 111: Global Hot and Cold Therapy Products Industry Revenue Million Forecast, by Type 2019 & 2032
- Table 112: Global Hot and Cold Therapy Products Industry Volume K Units Forecast, by Type 2019 & 2032
- Table 113: Global Hot and Cold Therapy Products Industry Revenue Million Forecast, by Application 2019 & 2032
- Table 114: Global Hot and Cold Therapy Products Industry Volume K Units Forecast, by Application 2019 & 2032
- Table 115: Global Hot and Cold Therapy Products Industry Revenue Million Forecast, by Country 2019 & 2032
- Table 116: Global Hot and Cold Therapy Products Industry Volume K Units Forecast, by Country 2019 & 2032
- Table 117: Global Hot and Cold Therapy Products Industry Revenue Million Forecast, by Type 2019 & 2032
- Table 118: Global Hot and Cold Therapy Products Industry Volume K Units Forecast, by Type 2019 & 2032
- Table 119: Global Hot and Cold Therapy Products Industry Revenue Million Forecast, by Application 2019 & 2032
- Table 120: Global Hot and Cold Therapy Products Industry Volume K Units Forecast, by Application 2019 & 2032
- Table 121: Global Hot and Cold Therapy Products Industry Revenue Million Forecast, by Country 2019 & 2032
- Table 122: Global Hot and Cold Therapy Products Industry Volume K Units Forecast, by Country 2019 & 2032
- Table 123: South Africa Hot and Cold Therapy Products Industry Revenue (Million) Forecast, by Application 2019 & 2032
- Table 124: South Africa Hot and Cold Therapy Products Industry Volume (K Units) Forecast, by Application 2019 & 2032
- Table 125: Rest of Middle East Hot and Cold Therapy Products Industry Revenue (Million) Forecast, by Application 2019 & 2032
- Table 126: Rest of Middle East Hot and Cold Therapy Products Industry Volume (K Units) Forecast, by Application 2019 & 2032
- Table 127: Global Hot and Cold Therapy Products Industry Revenue Million Forecast, by Type 2019 & 2032
- Table 128: Global Hot and Cold Therapy Products Industry Volume K Units Forecast, by Type 2019 & 2032
- Table 129: Global Hot and Cold Therapy Products Industry Revenue Million Forecast, by Application 2019 & 2032
- Table 130: Global Hot and Cold Therapy Products Industry Volume K Units Forecast, by Application 2019 & 2032
- Table 131: Global Hot and Cold Therapy Products Industry Revenue Million Forecast, by Country 2019 & 2032
- Table 132: Global Hot and Cold Therapy Products Industry Volume K Units Forecast, by Country 2019 & 2032
- Table 133: Brazil Hot and Cold Therapy Products Industry Revenue (Million) Forecast, by Application 2019 & 2032
- Table 134: Brazil Hot and Cold Therapy Products Industry Volume (K Units) Forecast, by Application 2019 & 2032
- Table 135: Argentina Hot and Cold Therapy Products Industry Revenue (Million) Forecast, by Application 2019 & 2032
- Table 136: Argentina Hot and Cold Therapy Products Industry Volume (K Units) Forecast, by Application 2019 & 2032
- Table 137: Rest of South America Hot and Cold Therapy Products Industry Revenue (Million) Forecast, by Application 2019 & 2032
- Table 138: Rest of South America Hot and Cold Therapy Products Industry Volume (K Units) Forecast, by Application 2019 & 2032
Frequently Asked Questions
1. What is the projected Compound Annual Growth Rate (CAGR) of the Hot and Cold Therapy Products Industry?
The projected CAGR is approximately 5.60%.
2. Which companies are prominent players in the Hot and Cold Therapy Products Industry?
Key companies in the market include Bruder Healthcare Company, Colfax Corporation (Chattanooga Group Inc), Core Products International, Breg Inc, Halyard Worldwide Inc, 3M, Carex Health, Cardinal Health Inc, Caldera International Inc, Pfizer Inc.
3. What are the main segments of the Hot and Cold Therapy Products Industry?
The market segments include Type, Application.
4. Can you provide details about the market size?
The market size is estimated to be USD XX Million as of 2022.
5. What are some drivers contributing to market growth?
Rising Investments by Key Players; Increasing Prevalence of Accidents and Chronic Pains.
6. What are the notable trends driving market growth?
Dry and Moist Hot and Cold Packs are Expected to Hold the Major Market Share in the Hot and Cold Therapy Packs Market.
7. Are there any restraints impacting market growth?
Lack of Awareness about Treatment Options for Pain Management.
8. Can you provide examples of recent developments in the market?
In June 2022, Healthy Extracts Inc., launched Brain Activate - Gel, a unique proprietary gel pack formulation.
9. What pricing options are available for accessing the report?
Pricing options include single-user, multi-user, and enterprise licenses priced at USD 4750, USD 5250, and USD 8750 respectively.
10. Is the market size provided in terms of value or volume?
The market size is provided in terms of value, measured in Million and volume, measured in K Units.
11. Are there any specific market keywords associated with the report?
Yes, the market keyword associated with the report is "Hot and Cold Therapy Products Industry," which aids in identifying and referencing the specific market segment covered.
12. How do I determine which pricing option suits my needs best?
The pricing options vary based on user requirements and access needs. Individual users may opt for single-user licenses, while businesses requiring broader access may choose multi-user or enterprise licenses for cost-effective access to the report.
13. Are there any additional resources or data provided in the Hot and Cold Therapy Products Industry report?
While the report offers comprehensive insights, it's advisable to review the specific contents or supplementary materials provided to ascertain if additional resources or data are available.
14. How can I stay updated on further developments or reports in the Hot and Cold Therapy Products Industry?
To stay informed about further developments, trends, and reports in the Hot and Cold Therapy Products Industry, consider subscribing to industry newsletters, following relevant companies and organizations, or regularly checking reputable industry news sources and publications.
Methodology
Step 1 - Identification of Relevant Samples Size from Population Database


Step 2 - Approaches for Defining Global Market Size (Value, Volume* & Price*)

Note*: In applicable scenarios
Step 3 - Data Sources
Primary Research
- Web Analytics
- Survey Reports
- Research Institute
- Latest Research Reports
- Opinion Leaders
Secondary Research
- Annual Reports
- White Paper
- Latest Press Release
- Industry Association
- Paid Database
- Investor Presentations

Step 4 - Data Triangulation
Involves using different sources of information in order to increase the validity of a study
These sources are likely to be stakeholders in a program - participants, other researchers, program staff, other community members, and so on.
Then we put all data in single framework & apply various statistical tools to find out the dynamic on the market.
During the analysis stage, feedback from the stakeholder groups would be compared to determine areas of agreement as well as areas of divergence


