
Key Insights
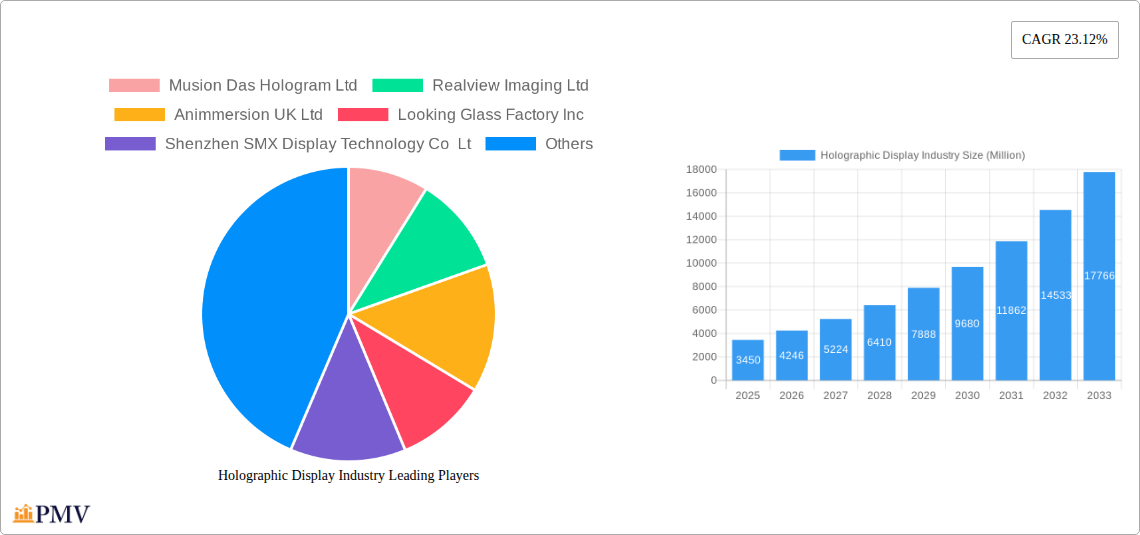
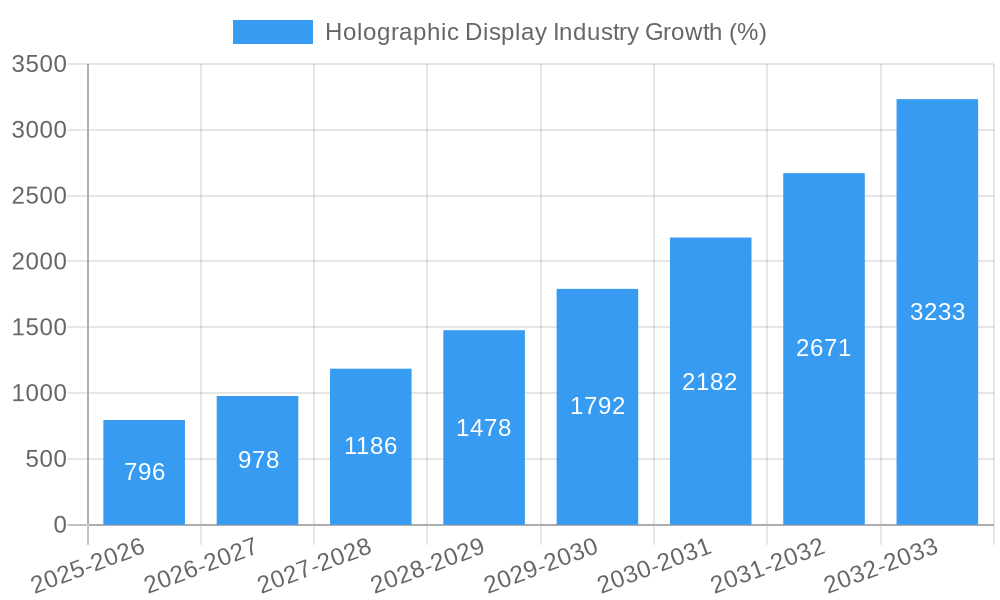
The holographic display market is experiencing significant growth, projected to reach $3.45 billion in 2025 and exhibiting a robust Compound Annual Growth Rate (CAGR) of 23.12%. This expansion is fueled by several key drivers. The increasing adoption of holographic displays across diverse end-user verticals, including consumer electronics (smartphones, TVs), retail (interactive displays, virtual try-ons), media and entertainment (immersive gaming, concerts), and healthcare (medical imaging, surgical planning), is a primary factor. Furthermore, technological advancements leading to improved resolution, brightness, and affordability of holographic displays are making them more accessible to a wider range of applications. The rising demand for enhanced user experiences and the integration of holographic technology into augmented reality (AR) and virtual reality (VR) systems are further accelerating market growth. While challenges remain, such as the relatively high cost of production and the need for further technological refinement to overcome limitations in image quality and viewing angles, these are being steadily addressed by ongoing research and development efforts.
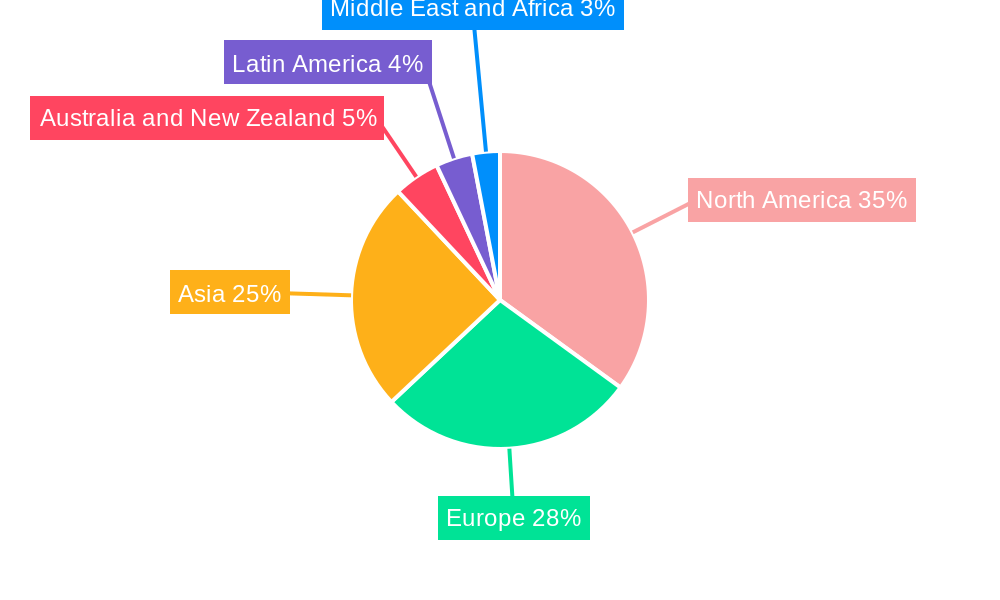
The market segmentation reveals the dominance of consumer electronics and entertainment segments, reflecting the current popularity of holographic applications in these areas. However, significant growth potential exists in the healthcare and automotive sectors, as holographic technologies offer unique advantages in medical imaging and advanced driver-assistance systems. The geographical distribution indicates strong growth in North America and Asia, driven by technological advancements and higher disposable incomes. Europe is expected to witness a steady increase, while other regions, such as Latin America, Australia, and the Middle East and Africa, are predicted to show slower but considerable growth as adoption increases and infrastructure develops. Competition in the market is considerable, with established players alongside innovative startups contributing to the continuous improvement and broader accessibility of holographic display technology. Over the forecast period (2025-2033), the market's continued expansion is anticipated to be driven by continuous innovation and the growing integration of holographic displays into everyday life.
Holographic Display Industry: Market Analysis & Forecast 2019-2033
This comprehensive report provides an in-depth analysis of the holographic display industry, projecting a market valuation of $XX Million by 2033. The study period covers 2019-2033, with 2025 as the base and estimated year. The report offers crucial insights for businesses, investors, and researchers seeking to understand the market's dynamics, growth drivers, and future prospects. It features detailed segmentation by end-user verticals, including market size estimations and competitive analysis. Key players such as Musion Das Hologram Ltd, Realview Imaging Ltd, Animmersion UK Ltd, Looking Glass Factory Inc, Shenzhen SMX Display Technology Co Ltd, Kino-mo Limited (HYPERVSN), RealFiction Holding AB, and Provision Holding Inc are analyzed in detail.
Holographic Display Industry Market Structure & Competitive Dynamics
The holographic display market is characterized by a moderately concentrated structure, with a few key players holding significant market share. However, the landscape is dynamic, with ongoing innovation driving new entrants and fostering a competitive environment. The industry benefits from a robust innovation ecosystem, involving research institutions, startups, and established companies collaborating on technological advancements. Regulatory frameworks vary across regions, impacting market access and product approvals. Existing technologies like traditional LCD and LED displays present significant substitutes, albeit with limitations in delivering the immersive experience offered by holographic displays. End-user trends are shifting towards more interactive and engaging visual experiences, driving demand for advanced display technologies like holography. M&A activities have played a role in shaping the market's competitive landscape, with deal values ranging from $XX Million to $XX Million in recent years, primarily focused on strengthening technological capabilities and expanding market reach. The market share of the leading companies is as follows: Musion Das Hologram Ltd (xx%), Realview Imaging Ltd (xx%), Animmersion UK Ltd (xx%), Looking Glass Factory Inc (xx%), others (xx%).
Holographic Display Industry Industry Trends & Insights
The holographic display market is experiencing robust growth, driven by increasing demand from various sectors. The Compound Annual Growth Rate (CAGR) during the forecast period (2025-2033) is estimated at xx%. Several factors fuel this growth, including advancements in display technologies, such as the development of transparent holographic displays seen in Hyundai Mobis' innovative EV technology. The market penetration is still relatively low, with xx% market penetration by 2025, but significant growth is anticipated due to decreasing manufacturing costs and improved affordability. Consumer preferences are shifting towards immersive and interactive experiences, aligning perfectly with the capabilities of holographic displays. Technological disruptions, such as the integration of artificial intelligence (AI) and augmented reality (AR), are further enhancing the functionality and appeal of holographic displays. The competitive dynamics are marked by continuous innovation and strategic partnerships to expand market reach and application across various sectors.
Dominant Markets & Segments in Holographic Display Industry
While the global market shows promising growth, certain segments and regions are currently dominating.
Leading Region: North America currently holds a significant share due to its strong technological advancements and high consumer spending. Key drivers include substantial investments in R&D, a well-established consumer electronics market, and supportive government policies promoting technological innovation.
Leading Segment (By End-User Verticals): The Media and Entertainment segment is currently leading the adoption of holographic displays, driven by its applications in live performances, virtual events, and advertising. This is followed closely by the Automotive sector due to increasing demands for enhanced driver information systems and in-car entertainment.
Key Drivers by Segment:
- Consumer Electronics: Growing demand for immersive gaming and home entertainment experiences.
- Retail: Desire for engaging product demonstrations and interactive shopping experiences.
- Media and Entertainment: Need for advanced visual effects and virtual events.
- Military and Defense: Requirement for enhanced situational awareness and training simulations.
- Healthcare: Use in medical imaging, surgical planning, and patient education.
- Automotive: Demand for advanced driver-assistance systems and in-car entertainment.
The dominance of these segments and regions is expected to continue during the forecast period, albeit with a gradual increase in the share of other segments as the technology matures and becomes more affordable.
Holographic Display Industry Product Innovations
Recent years have witnessed significant product developments in holographic displays, focusing on improved resolution, brightness, and ease of use. The integration of advanced technologies such as AI and AR has significantly enhanced the user experience, opening new avenues for applications. These innovations are resulting in a more accessible and versatile product offering, catering to a wider range of end-user needs across various sectors. The competitive advantage is being driven by the development of innovative features, such as transparent and flexible displays, and the cost reduction in manufacturing processes.
Report Segmentation & Scope
This report segments the holographic display market primarily by end-user verticals:
Consumer Electronics: This segment projects a market size of $XX Million by 2033, driven by the increasing popularity of gaming and home entertainment systems. Competitive dynamics are intense, with several companies vying for market share.
Retail: The retail segment is expected to reach $XX Million by 2033, fueled by the demand for innovative and engaging shopping experiences. Key players are focusing on developing solutions that enhance customer engagement and brand awareness.
Media and Entertainment: This is a high-growth segment, projected to reach $XX Million by 2033, driven by applications in live concerts, advertising, and virtual events. Competition is fierce, with companies vying for contracts in the entertainment industry.
Military and Defense: This sector is projected to reach $XX Million by 2033, driven by its application in training and simulation. The competitive landscape is dominated by companies with strong government contracts.
Healthcare: The healthcare segment is estimated to reach $XX Million by 2033, with applications in medical imaging and training. The competitive landscape is characterized by companies focusing on specialized applications.
Automotive: This sector is poised for significant growth, reaching $XX Million by 2033, driven by the development of advanced driver-assistance systems and in-car entertainment features.
Other End-user Verticals: This segment includes diverse applications, with a combined market size projected at $XX Million by 2033.
Key Drivers of Holographic Display Industry Growth
Several factors are driving the growth of the holographic display industry. Technological advancements are a primary driver, leading to improved display quality, reduced manufacturing costs, and enhanced features such as transparency and flexibility. Economic growth and increasing consumer disposable incomes contribute to higher demand for premium and technologically advanced consumer electronics and entertainment products. Favorable government policies and initiatives promoting technological innovation in many countries also bolster market growth.
Challenges in the Holographic Display Industry Sector
Despite the positive outlook, the industry faces challenges. High manufacturing costs and complex production processes present obstacles to wider adoption. Supply chain disruptions can also impact production and availability. Intense competition and the need for continuous innovation pose significant challenges, demanding substantial R&D investments. Regulatory hurdles and compliance requirements in certain regions add to the complexity of market entry.
Leading Players in the Holographic Display Industry Market
- Musion Das Hologram Ltd
- Realview Imaging Ltd
- Animmersion UK Ltd
- Looking Glass Factory Inc
- Shenzhen SMX Display Technology Co Ltd
- Kino-mo Limited (HYPERVSN)
- RealFiction Holding AB
- Provision Holding Inc
Key Developments in Holographic Display Industry Sector
January 2024: Hyundai Mobis unveiled its innovative display series for next-generation vehicles, including the world's first transparent holographic display. This development showcases the potential of holographic technology in the automotive sector.
January 2024: ARHT Media Inc. partnered with a global luxury retail brand to install ARHT Capsule hologram displays across multiple locations. This collaboration highlights the growing adoption of holographic displays in the retail and marketing sectors.
Strategic Holographic Display Industry Market Outlook
The future of the holographic display industry is promising, with significant growth potential across various sectors. The continuous development of advanced technologies and the increasing affordability of holographic displays will drive wider adoption. Strategic partnerships and collaborations between technology providers and end-user industries will play a crucial role in unlocking new market opportunities and shaping the future of this exciting technological landscape. The potential for growth is significant, particularly in emerging markets with rapidly expanding consumer electronics and entertainment industries.
Holographic Display Industry Segmentation
-
1. End-user Verticals
- 1.1. Consumer Electronics
- 1.2. Retail
- 1.3. Media and Entertainment
- 1.4. Military and Defense
- 1.5. Healthcare
- 1.6. Automotive
- 1.7. Other End-user Verticals
Holographic Display Industry Segmentation By Geography
- 1. North America
- 2. Europe
- 3. Asia
- 4. Australia and New Zealand
- 5. Latin America
- 6. Middle East and Africa
Holographic Display Industry REPORT HIGHLIGHTS
| Aspects | Details |
|---|---|
| Study Period | 2019-2033 |
| Base Year | 2024 |
| Estimated Year | 2025 |
| Forecast Period | 2025-2033 |
| Historical Period | 2019-2024 |
| Growth Rate | CAGR of 23.12% from 2019-2033 |
| Segmentation |
|
Table of Contents
- 1. Introduction
- 1.1. Research Scope
- 1.2. Market Segmentation
- 1.3. Research Methodology
- 1.4. Definitions and Assumptions
- 2. Executive Summary
- 2.1. Introduction
- 3. Market Dynamics
- 3.1. Introduction
- 3.2. Market Drivers
- 3.2.1. Increasing Investments in 3D Technology; Advancements in Screenless Displays
- 3.3. Market Restrains
- 3.3.1. High Cost of Assembling Holographic Display Devices; Presence of Substitute Display Products
- 3.4. Market Trends
- 3.4.1. Automotive Segment is Expected to Witness Significant Growth
- 4. Market Factor Analysis
- 4.1. Porters Five Forces
- 4.2. Supply/Value Chain
- 4.3. PESTEL analysis
- 4.4. Market Entropy
- 4.5. Patent/Trademark Analysis
- 5. Global Holographic Display Industry Analysis, Insights and Forecast, 2019-2031
- 5.1. Market Analysis, Insights and Forecast - by End-user Verticals
- 5.1.1. Consumer Electronics
- 5.1.2. Retail
- 5.1.3. Media and Entertainment
- 5.1.4. Military and Defense
- 5.1.5. Healthcare
- 5.1.6. Automotive
- 5.1.7. Other End-user Verticals
- 5.2. Market Analysis, Insights and Forecast - by Region
- 5.2.1. North America
- 5.2.2. Europe
- 5.2.3. Asia
- 5.2.4. Australia and New Zealand
- 5.2.5. Latin America
- 5.2.6. Middle East and Africa
- 5.1. Market Analysis, Insights and Forecast - by End-user Verticals
- 6. North America Holographic Display Industry Analysis, Insights and Forecast, 2019-2031
- 6.1. Market Analysis, Insights and Forecast - by End-user Verticals
- 6.1.1. Consumer Electronics
- 6.1.2. Retail
- 6.1.3. Media and Entertainment
- 6.1.4. Military and Defense
- 6.1.5. Healthcare
- 6.1.6. Automotive
- 6.1.7. Other End-user Verticals
- 6.1. Market Analysis, Insights and Forecast - by End-user Verticals
- 7. Europe Holographic Display Industry Analysis, Insights and Forecast, 2019-2031
- 7.1. Market Analysis, Insights and Forecast - by End-user Verticals
- 7.1.1. Consumer Electronics
- 7.1.2. Retail
- 7.1.3. Media and Entertainment
- 7.1.4. Military and Defense
- 7.1.5. Healthcare
- 7.1.6. Automotive
- 7.1.7. Other End-user Verticals
- 7.1. Market Analysis, Insights and Forecast - by End-user Verticals
- 8. Asia Holographic Display Industry Analysis, Insights and Forecast, 2019-2031
- 8.1. Market Analysis, Insights and Forecast - by End-user Verticals
- 8.1.1. Consumer Electronics
- 8.1.2. Retail
- 8.1.3. Media and Entertainment
- 8.1.4. Military and Defense
- 8.1.5. Healthcare
- 8.1.6. Automotive
- 8.1.7. Other End-user Verticals
- 8.1. Market Analysis, Insights and Forecast - by End-user Verticals
- 9. Australia and New Zealand Holographic Display Industry Analysis, Insights and Forecast, 2019-2031
- 9.1. Market Analysis, Insights and Forecast - by End-user Verticals
- 9.1.1. Consumer Electronics
- 9.1.2. Retail
- 9.1.3. Media and Entertainment
- 9.1.4. Military and Defense
- 9.1.5. Healthcare
- 9.1.6. Automotive
- 9.1.7. Other End-user Verticals
- 9.1. Market Analysis, Insights and Forecast - by End-user Verticals
- 10. Latin America Holographic Display Industry Analysis, Insights and Forecast, 2019-2031
- 10.1. Market Analysis, Insights and Forecast - by End-user Verticals
- 10.1.1. Consumer Electronics
- 10.1.2. Retail
- 10.1.3. Media and Entertainment
- 10.1.4. Military and Defense
- 10.1.5. Healthcare
- 10.1.6. Automotive
- 10.1.7. Other End-user Verticals
- 10.1. Market Analysis, Insights and Forecast - by End-user Verticals
- 11. Middle East and Africa Holographic Display Industry Analysis, Insights and Forecast, 2019-2031
- 11.1. Market Analysis, Insights and Forecast - by End-user Verticals
- 11.1.1. Consumer Electronics
- 11.1.2. Retail
- 11.1.3. Media and Entertainment
- 11.1.4. Military and Defense
- 11.1.5. Healthcare
- 11.1.6. Automotive
- 11.1.7. Other End-user Verticals
- 11.1. Market Analysis, Insights and Forecast - by End-user Verticals
- 12. North America Holographic Display Industry Analysis, Insights and Forecast, 2019-2031
- 12.1. Market Analysis, Insights and Forecast - By Country/Sub-region
- 12.1.1.
- 13. Europe Holographic Display Industry Analysis, Insights and Forecast, 2019-2031
- 13.1. Market Analysis, Insights and Forecast - By Country/Sub-region
- 13.1.1.
- 14. Asia Holographic Display Industry Analysis, Insights and Forecast, 2019-2031
- 14.1. Market Analysis, Insights and Forecast - By Country/Sub-region
- 14.1.1.
- 15. Australia and New Zealand Holographic Display Industry Analysis, Insights and Forecast, 2019-2031
- 15.1. Market Analysis, Insights and Forecast - By Country/Sub-region
- 15.1.1.
- 16. Latin America Holographic Display Industry Analysis, Insights and Forecast, 2019-2031
- 16.1. Market Analysis, Insights and Forecast - By Country/Sub-region
- 16.1.1.
- 17. Middle East and Africa Holographic Display Industry Analysis, Insights and Forecast, 2019-2031
- 17.1. Market Analysis, Insights and Forecast - By Country/Sub-region
- 17.1.1.
- 18. Competitive Analysis
- 18.1. Global Market Share Analysis 2024
- 18.2. Company Profiles
- 18.2.1 Musion Das Hologram Ltd
- 18.2.1.1. Overview
- 18.2.1.2. Products
- 18.2.1.3. SWOT Analysis
- 18.2.1.4. Recent Developments
- 18.2.1.5. Financials (Based on Availability)
- 18.2.2 Realview Imaging Ltd
- 18.2.2.1. Overview
- 18.2.2.2. Products
- 18.2.2.3. SWOT Analysis
- 18.2.2.4. Recent Developments
- 18.2.2.5. Financials (Based on Availability)
- 18.2.3 Animmersion UK Ltd
- 18.2.3.1. Overview
- 18.2.3.2. Products
- 18.2.3.3. SWOT Analysis
- 18.2.3.4. Recent Developments
- 18.2.3.5. Financials (Based on Availability)
- 18.2.4 Looking Glass Factory Inc
- 18.2.4.1. Overview
- 18.2.4.2. Products
- 18.2.4.3. SWOT Analysis
- 18.2.4.4. Recent Developments
- 18.2.4.5. Financials (Based on Availability)
- 18.2.5 Shenzhen SMX Display Technology Co Lt
- 18.2.5.1. Overview
- 18.2.5.2. Products
- 18.2.5.3. SWOT Analysis
- 18.2.5.4. Recent Developments
- 18.2.5.5. Financials (Based on Availability)
- 18.2.6 Kino-mo Limited (HYPERVSN)
- 18.2.6.1. Overview
- 18.2.6.2. Products
- 18.2.6.3. SWOT Analysis
- 18.2.6.4. Recent Developments
- 18.2.6.5. Financials (Based on Availability)
- 18.2.7 RealFiction Holding AB
- 18.2.7.1. Overview
- 18.2.7.2. Products
- 18.2.7.3. SWOT Analysis
- 18.2.7.4. Recent Developments
- 18.2.7.5. Financials (Based on Availability)
- 18.2.8 Provision Holding Inc
- 18.2.8.1. Overview
- 18.2.8.2. Products
- 18.2.8.3. SWOT Analysis
- 18.2.8.4. Recent Developments
- 18.2.8.5. Financials (Based on Availability)
- 18.2.1 Musion Das Hologram Ltd
List of Figures
- Figure 1: Global Holographic Display Industry Revenue Breakdown (Million, %) by Region 2024 & 2032
- Figure 2: North America Holographic Display Industry Revenue (Million), by Country 2024 & 2032
- Figure 3: North America Holographic Display Industry Revenue Share (%), by Country 2024 & 2032
- Figure 4: Europe Holographic Display Industry Revenue (Million), by Country 2024 & 2032
- Figure 5: Europe Holographic Display Industry Revenue Share (%), by Country 2024 & 2032
- Figure 6: Asia Holographic Display Industry Revenue (Million), by Country 2024 & 2032
- Figure 7: Asia Holographic Display Industry Revenue Share (%), by Country 2024 & 2032
- Figure 8: Australia and New Zealand Holographic Display Industry Revenue (Million), by Country 2024 & 2032
- Figure 9: Australia and New Zealand Holographic Display Industry Revenue Share (%), by Country 2024 & 2032
- Figure 10: Latin America Holographic Display Industry Revenue (Million), by Country 2024 & 2032
- Figure 11: Latin America Holographic Display Industry Revenue Share (%), by Country 2024 & 2032
- Figure 12: Middle East and Africa Holographic Display Industry Revenue (Million), by Country 2024 & 2032
- Figure 13: Middle East and Africa Holographic Display Industry Revenue Share (%), by Country 2024 & 2032
- Figure 14: North America Holographic Display Industry Revenue (Million), by End-user Verticals 2024 & 2032
- Figure 15: North America Holographic Display Industry Revenue Share (%), by End-user Verticals 2024 & 2032
- Figure 16: North America Holographic Display Industry Revenue (Million), by Country 2024 & 2032
- Figure 17: North America Holographic Display Industry Revenue Share (%), by Country 2024 & 2032
- Figure 18: Europe Holographic Display Industry Revenue (Million), by End-user Verticals 2024 & 2032
- Figure 19: Europe Holographic Display Industry Revenue Share (%), by End-user Verticals 2024 & 2032
- Figure 20: Europe Holographic Display Industry Revenue (Million), by Country 2024 & 2032
- Figure 21: Europe Holographic Display Industry Revenue Share (%), by Country 2024 & 2032
- Figure 22: Asia Holographic Display Industry Revenue (Million), by End-user Verticals 2024 & 2032
- Figure 23: Asia Holographic Display Industry Revenue Share (%), by End-user Verticals 2024 & 2032
- Figure 24: Asia Holographic Display Industry Revenue (Million), by Country 2024 & 2032
- Figure 25: Asia Holographic Display Industry Revenue Share (%), by Country 2024 & 2032
- Figure 26: Australia and New Zealand Holographic Display Industry Revenue (Million), by End-user Verticals 2024 & 2032
- Figure 27: Australia and New Zealand Holographic Display Industry Revenue Share (%), by End-user Verticals 2024 & 2032
- Figure 28: Australia and New Zealand Holographic Display Industry Revenue (Million), by Country 2024 & 2032
- Figure 29: Australia and New Zealand Holographic Display Industry Revenue Share (%), by Country 2024 & 2032
- Figure 30: Latin America Holographic Display Industry Revenue (Million), by End-user Verticals 2024 & 2032
- Figure 31: Latin America Holographic Display Industry Revenue Share (%), by End-user Verticals 2024 & 2032
- Figure 32: Latin America Holographic Display Industry Revenue (Million), by Country 2024 & 2032
- Figure 33: Latin America Holographic Display Industry Revenue Share (%), by Country 2024 & 2032
- Figure 34: Middle East and Africa Holographic Display Industry Revenue (Million), by End-user Verticals 2024 & 2032
- Figure 35: Middle East and Africa Holographic Display Industry Revenue Share (%), by End-user Verticals 2024 & 2032
- Figure 36: Middle East and Africa Holographic Display Industry Revenue (Million), by Country 2024 & 2032
- Figure 37: Middle East and Africa Holographic Display Industry Revenue Share (%), by Country 2024 & 2032
List of Tables
- Table 1: Global Holographic Display Industry Revenue Million Forecast, by Region 2019 & 2032
- Table 2: Global Holographic Display Industry Revenue Million Forecast, by End-user Verticals 2019 & 2032
- Table 3: Global Holographic Display Industry Revenue Million Forecast, by Region 2019 & 2032
- Table 4: Global Holographic Display Industry Revenue Million Forecast, by Country 2019 & 2032
- Table 5: Holographic Display Industry Revenue (Million) Forecast, by Application 2019 & 2032
- Table 6: Global Holographic Display Industry Revenue Million Forecast, by Country 2019 & 2032
- Table 7: Holographic Display Industry Revenue (Million) Forecast, by Application 2019 & 2032
- Table 8: Global Holographic Display Industry Revenue Million Forecast, by Country 2019 & 2032
- Table 9: Holographic Display Industry Revenue (Million) Forecast, by Application 2019 & 2032
- Table 10: Global Holographic Display Industry Revenue Million Forecast, by Country 2019 & 2032
- Table 11: Holographic Display Industry Revenue (Million) Forecast, by Application 2019 & 2032
- Table 12: Global Holographic Display Industry Revenue Million Forecast, by Country 2019 & 2032
- Table 13: Holographic Display Industry Revenue (Million) Forecast, by Application 2019 & 2032
- Table 14: Global Holographic Display Industry Revenue Million Forecast, by Country 2019 & 2032
- Table 15: Holographic Display Industry Revenue (Million) Forecast, by Application 2019 & 2032
- Table 16: Global Holographic Display Industry Revenue Million Forecast, by End-user Verticals 2019 & 2032
- Table 17: Global Holographic Display Industry Revenue Million Forecast, by Country 2019 & 2032
- Table 18: Global Holographic Display Industry Revenue Million Forecast, by End-user Verticals 2019 & 2032
- Table 19: Global Holographic Display Industry Revenue Million Forecast, by Country 2019 & 2032
- Table 20: Global Holographic Display Industry Revenue Million Forecast, by End-user Verticals 2019 & 2032
- Table 21: Global Holographic Display Industry Revenue Million Forecast, by Country 2019 & 2032
- Table 22: Global Holographic Display Industry Revenue Million Forecast, by End-user Verticals 2019 & 2032
- Table 23: Global Holographic Display Industry Revenue Million Forecast, by Country 2019 & 2032
- Table 24: Global Holographic Display Industry Revenue Million Forecast, by End-user Verticals 2019 & 2032
- Table 25: Global Holographic Display Industry Revenue Million Forecast, by Country 2019 & 2032
- Table 26: Global Holographic Display Industry Revenue Million Forecast, by End-user Verticals 2019 & 2032
- Table 27: Global Holographic Display Industry Revenue Million Forecast, by Country 2019 & 2032
Frequently Asked Questions
1. What is the projected Compound Annual Growth Rate (CAGR) of the Holographic Display Industry?
The projected CAGR is approximately 23.12%.
2. Which companies are prominent players in the Holographic Display Industry?
Key companies in the market include Musion Das Hologram Ltd, Realview Imaging Ltd, Animmersion UK Ltd, Looking Glass Factory Inc, Shenzhen SMX Display Technology Co Lt, Kino-mo Limited (HYPERVSN), RealFiction Holding AB, Provision Holding Inc.
3. What are the main segments of the Holographic Display Industry?
The market segments include End-user Verticals.
4. Can you provide details about the market size?
The market size is estimated to be USD 3.45 Million as of 2022.
5. What are some drivers contributing to market growth?
Increasing Investments in 3D Technology; Advancements in Screenless Displays.
6. What are the notable trends driving market growth?
Automotive Segment is Expected to Witness Significant Growth.
7. Are there any restraints impacting market growth?
High Cost of Assembling Holographic Display Devices; Presence of Substitute Display Products.
8. Can you provide examples of recent developments in the market?
Jan 2024: Hyundai Mobis, Hyundai’s largest supplier, unveiled its latest EV tech. It uses the first transparent display screen using holographic tech. The company revealed its “innovative display series” for next-gen vehicles, which included the “world’s first rollable display and swivel display.” Hyundai Mobis presented a transparent display that uses holographic elements. The display appears on a transparent panel, making it easier for drivers to keep their eyes on the road.
9. What pricing options are available for accessing the report?
Pricing options include single-user, multi-user, and enterprise licenses priced at USD 4750, USD 5250, and USD 8750 respectively.
10. Is the market size provided in terms of value or volume?
The market size is provided in terms of value, measured in Million.
11. Are there any specific market keywords associated with the report?
Yes, the market keyword associated with the report is "Holographic Display Industry," which aids in identifying and referencing the specific market segment covered.
12. How do I determine which pricing option suits my needs best?
The pricing options vary based on user requirements and access needs. Individual users may opt for single-user licenses, while businesses requiring broader access may choose multi-user or enterprise licenses for cost-effective access to the report.
13. Are there any additional resources or data provided in the Holographic Display Industry report?
While the report offers comprehensive insights, it's advisable to review the specific contents or supplementary materials provided to ascertain if additional resources or data are available.
14. How can I stay updated on further developments or reports in the Holographic Display Industry?
To stay informed about further developments, trends, and reports in the Holographic Display Industry, consider subscribing to industry newsletters, following relevant companies and organizations, or regularly checking reputable industry news sources and publications.
Methodology
Step 1 - Identification of Relevant Samples Size from Population Database


Step 2 - Approaches for Defining Global Market Size (Value, Volume* & Price*)

Note*: In applicable scenarios
Step 3 - Data Sources
Primary Research
- Web Analytics
- Survey Reports
- Research Institute
- Latest Research Reports
- Opinion Leaders
Secondary Research
- Annual Reports
- White Paper
- Latest Press Release
- Industry Association
- Paid Database
- Investor Presentations

Step 4 - Data Triangulation
Involves using different sources of information in order to increase the validity of a study
These sources are likely to be stakeholders in a program - participants, other researchers, program staff, other community members, and so on.
Then we put all data in single framework & apply various statistical tools to find out the dynamic on the market.
During the analysis stage, feedback from the stakeholder groups would be compared to determine areas of agreement as well as areas of divergence


