
Key Insights
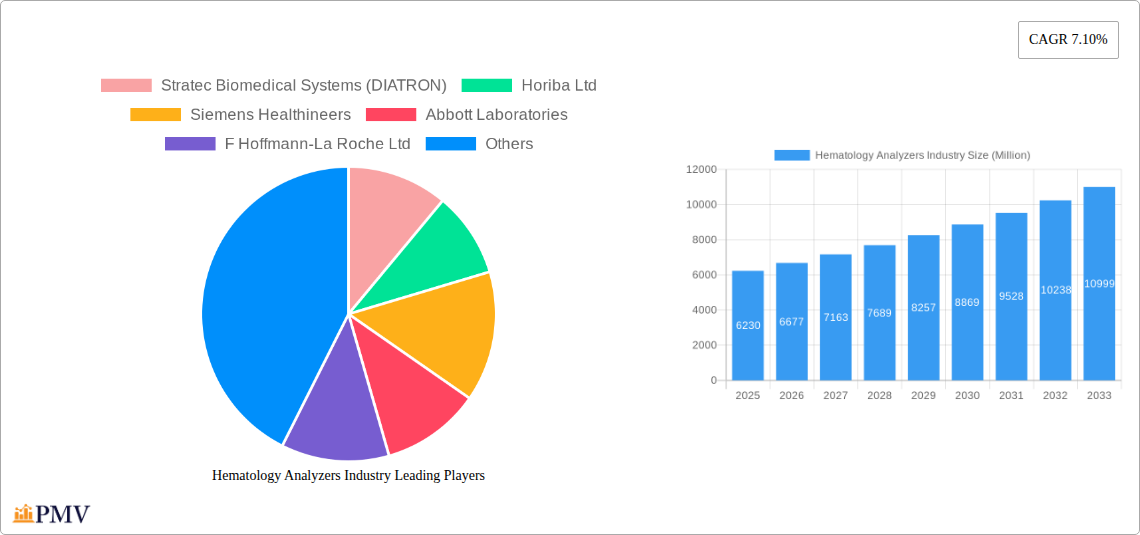
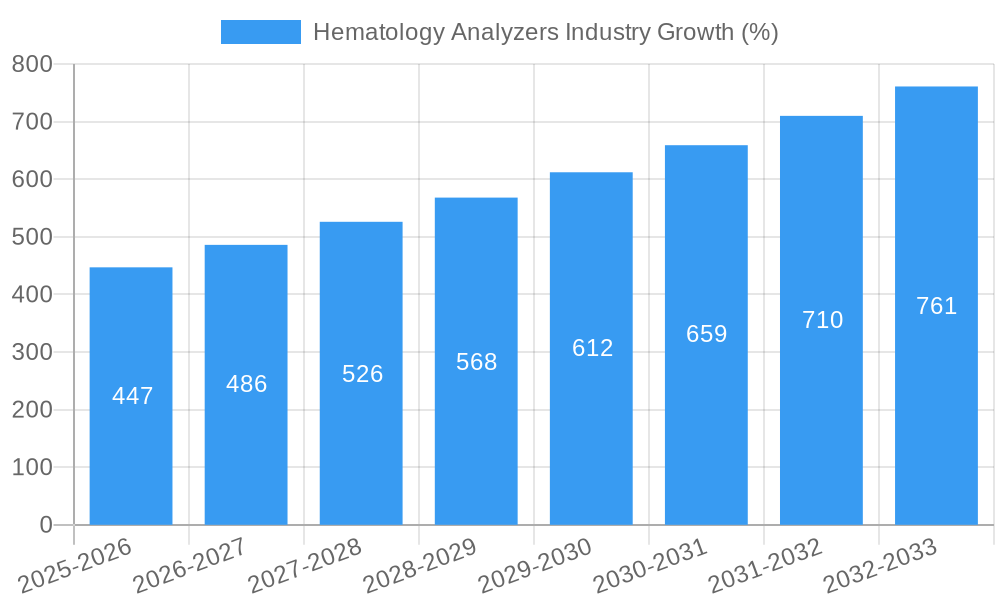
The global hematology analyzers market, valued at $6.23 billion in 2025, is projected to experience robust growth, driven by a compound annual growth rate (CAGR) of 7.10% from 2025 to 2033. This expansion is fueled by several key factors. The increasing prevalence of hematological disorders globally, coupled with the rising geriatric population more susceptible to these conditions, is significantly boosting demand. Technological advancements in hematology analyzers, leading to improved accuracy, speed, and automation, are also major drivers. Furthermore, the expanding healthcare infrastructure, particularly in developing economies, presents significant growth opportunities. The incorporation of advanced features like automated cell counting, differential analysis, and data management systems enhances efficiency and diagnostic capabilities within clinical laboratories and hospitals, thus further fueling market growth. The shift toward point-of-care testing (POCT) devices also contributes, as these portable analyzers provide faster results in various settings. However, high initial investment costs associated with purchasing and maintaining these sophisticated instruments might act as a restraint, particularly for smaller healthcare facilities. The market is segmented by product type (instruments, reagents, and services), end-user (hospitals, clinical laboratories, research institutes, and others), and geography, with North America and Europe currently dominating the market share due to established healthcare infrastructure and technological advancements. Competition is intense, with major players like Siemens Healthineers, Abbott Laboratories, and Roche continually innovating and expanding their product portfolios.
The competitive landscape is characterized by both established multinational corporations and smaller specialized companies. The market is expected to witness strategic partnerships, mergers, and acquisitions as companies strive to enhance their market share and expand their product offerings. Future growth will likely be influenced by the increasing adoption of advanced hematology analyzers incorporating artificial intelligence (AI) for improved diagnostics and the development of portable, cost-effective solutions for underserved regions. The focus on developing integrated diagnostic solutions that combine hematology analysis with other tests, as well as the growing demand for remote monitoring and telemedicine, are likely to shape the market's future trajectory. The market's sustained growth outlook indicates strong investment opportunities for stakeholders within the hematology analyzers industry.
Hematology Analyzers Industry Market Report: 2019-2033
This comprehensive report provides a detailed analysis of the global hematology analyzers market, offering invaluable insights for stakeholders across the industry value chain. Covering the period 2019-2033, with a base year of 2025 and a forecast period of 2025-2033, this report meticulously examines market size, growth drivers, competitive dynamics, and future trends. The report is essential for manufacturers, investors, researchers, and anyone seeking a thorough understanding of this critical sector of the healthcare industry. The total market size in 2025 is estimated at $XX Billion.
Hematology Analyzers Industry Market Structure & Competitive Dynamics
The global hematology analyzers market is characterized by a moderately concentrated structure, with several multinational corporations holding significant market share. Key players such as Sysmex Corporation, Beckman Coulter Inc (Danaher Corporation), Siemens Healthineers, Abbott Laboratories, and F. Hoffmann-La Roche Ltd dominate the landscape, leveraging their established brands, extensive distribution networks, and robust R&D capabilities. Smaller players like Stratec Biomedical Systems (DIATRON), Horiba Ltd, Ortho Clinical Diagnostics, Boule Diagnostics AB, Bio-Rad Laboratories, Accurex Biomedical Pvt Ltd, and Nihon Kohden Corporation compete primarily on niche offerings or regional dominance.
Market share distribution is dynamic, influenced by product innovation, regulatory approvals, and strategic partnerships. The market witnesses consistent M&A activity, with deal values varying significantly based on the size and scope of the acquisition. For instance, recent deals (xx Million) have focused on expanding product portfolios and geographic reach. The regulatory landscape, characterized by stringent quality and safety standards, significantly influences market entry and product approvals. Innovation plays a pivotal role, with the introduction of automated systems, advanced analytical capabilities, and improved diagnostic accuracy shaping competitive dynamics. End-user preferences for sophisticated, cost-effective, and user-friendly analyzers further contribute to the market’s evolving landscape. Substitute products, while limited, include manual hematology methods, but these are increasingly being replaced by automated analyzers due to their superior efficiency and accuracy.
Hematology Analyzers Industry Industry Trends & Insights
The hematology analyzers market exhibits robust growth, driven by several key factors. The rising prevalence of chronic diseases like blood cancers and hematological disorders fuels demand for accurate and timely diagnostic tools. Technological advancements, such as the development of automated, high-throughput analyzers with enhanced analytical capabilities, are transforming the industry. The increasing adoption of point-of-care testing (POCT) solutions for rapid diagnostics further contributes to market growth. Consumer preferences are shifting toward user-friendly, cost-effective, and integrated systems that streamline laboratory workflows. Furthermore, the growing penetration of sophisticated diagnostic equipment in developing countries drives market expansion. The increasing emphasis on early detection and precise diagnosis leads to a higher demand for hematology analyzers. The market is experiencing a healthy compound annual growth rate (CAGR) of xx% during the forecast period, with market penetration increasing steadily, particularly in emerging economies. Competitive dynamics continue to be shaped by product innovation, strategic partnerships, and mergers and acquisitions.
Dominant Markets & Segments in Hematology Analyzers Industry
The global hematology analyzers market is experiencing significant growth across various segments. Hospitals remain the dominant end-user segment, owing to their extensive diagnostic capabilities and high patient volume. Clinical laboratories are another crucial segment, playing a critical role in providing accurate and timely diagnostic information. Research institutes utilize hematology analyzers for research and development purposes. The instruments segment dominates the product type category, followed by reagents and services. Geographically, North America currently holds a leading position due to high healthcare expenditure and advanced healthcare infrastructure. However, regions such as Asia-Pacific and Europe are experiencing significant growth due to rising healthcare expenditure and increasing adoption of advanced diagnostic technologies.
- Key Drivers for Hospital Segment Dominance: High patient volume, availability of skilled professionals, comprehensive diagnostic capabilities, and high healthcare expenditure.
- Key Drivers for North American Market Leadership: Advanced healthcare infrastructure, high healthcare expenditure, stringent regulatory frameworks, and technological advancements.
- Key Drivers for Asia-Pacific Market Growth: Rising healthcare expenditure, increasing prevalence of hematological disorders, and government initiatives to improve healthcare infrastructure.
Hematology Analyzers Industry Product Innovations
Recent years have witnessed significant advancements in hematology analyzers, emphasizing automation, increased throughput, and improved accuracy. Manufacturers are focusing on developing compact, user-friendly instruments with integrated software for efficient data management. The incorporation of advanced technologies like artificial intelligence (AI) and machine learning (ML) promises to further enhance diagnostic capabilities. These innovations are enhancing the speed, accuracy, and cost-effectiveness of hematological tests, thus addressing market needs for better diagnostics.
Report Segmentation & Scope
This report segments the hematology analyzers market across various parameters. The product type segment includes instruments, reagents, and services. The end-user segment encompasses hospitals, clinical laboratories, research institutes, and other end-users. Growth projections vary across segments. The instruments segment is projected to maintain a significant market share due to continuous technological advancements. The reagents segment is expected to grow alongside the demand for instruments. The services segment is also anticipated to grow due to increasing demand for maintenance and support services. Each segment presents distinct competitive dynamics influenced by factors such as technological innovation, pricing strategies, and regulatory landscapes.
Key Drivers of Hematology Analyzers Industry Growth
The hematology analyzers market is driven by several key factors. The increasing prevalence of blood-related diseases and disorders is a major factor fueling demand for accurate diagnostics. Technological advancements, leading to more efficient and accurate analyzers, also contribute significantly. Government initiatives aimed at improving healthcare infrastructure and supporting research and development play a crucial role. Furthermore, the rising healthcare expenditure and growing awareness of preventive healthcare contribute to market expansion.
Challenges in the Hematology Analyzers Industry Sector
Despite significant growth potential, the hematology analyzers market faces several challenges. Stringent regulatory requirements for product approvals and certifications can create barriers to market entry. The high cost of advanced analyzers and reagents can limit accessibility, particularly in resource-constrained settings. Competition from established players can pose a significant hurdle for new entrants. Supply chain disruptions and fluctuating raw material prices can impact production costs and availability.
Leading Players in the Hematology Analyzers Industry Market
- Stratec Biomedical Systems (DIATRON)
- Horiba Ltd
- Siemens Healthineers
- Abbott Laboratories
- F. Hoffmann-La Roche Ltd
- Ortho Clinical Diagnostics
- Boule Diagnostics AB
- Bio-Rad Laboratories
- Beckman Coulter Inc (Danaher Corporation)
- Sysmex Corporation
- Accurex Biomedical Pvt Ltd
- Nihon Kohden Corporation
Key Developments in Hematology Analyzers Industry Sector
- May 2022: Nihon Kohden India established a new hematology analyzer reagent factory, strengthening its regional presence and supply chain.
- March 2022: Mindray launched the BC-700 Series, a revolutionary hematology analyzer series incorporating CBC and ESR tests, enhancing diagnostic capabilities.
Strategic Hematology Analyzers Industry Market Outlook
The hematology analyzers market holds significant growth potential, driven by technological advancements, rising prevalence of blood disorders, and increasing healthcare expenditure. Strategic opportunities exist for companies focusing on developing innovative, cost-effective, and user-friendly analyzers, particularly for point-of-care applications. Expanding into emerging markets and forging strategic partnerships are key avenues for growth. Continuous innovation and adaptation to evolving regulatory landscapes are crucial for long-term success in this dynamic market.
Hematology Analyzers Industry Segmentation
-
1. Product Type
-
1.1. Instruments
- 1.1.1. 3 Part Hematology Analyzer
- 1.1.2. 5 Part Hematology Analyzer
- 1.1.3. Point-of-care Testing Hematology Analyzers
- 1.1.4. Others
- 1.2. Reagents
- 1.3. Services
-
1.1. Instruments
-
2. End User
- 2.1. Hospitals
- 2.2. Clinical Laboratories
- 2.3. Research Institutes
- 2.4. Other End Users
Hematology Analyzers Industry Segmentation By Geography
-
1. North America
- 1.1. United States
- 1.2. Canada
- 1.3. Mexico
-
2. Europe
- 2.1. Germany
- 2.2. United Kingdom
- 2.3. France
- 2.4. Italy
- 2.5. Spain
- 2.6. Rest of Europe
-
3. Asia Pacific
- 3.1. China
- 3.2. Japan
- 3.3. India
- 3.4. Australia
- 3.5. South Korea
- 3.6. Rest of Asia Pacific
-
4. Middle East and Africa
- 4.1. GCC
- 4.2. South Africa
- 4.3. Rest of Middle East and Africa
-
5. South America
- 5.1. Brazil
- 5.2. Argentina
- 5.3. Rest of South America

Hematology Analyzers Industry REPORT HIGHLIGHTS
| Aspects | Details |
|---|---|
| Study Period | 2019-2033 |
| Base Year | 2024 |
| Estimated Year | 2025 |
| Forecast Period | 2025-2033 |
| Historical Period | 2019-2024 |
| Growth Rate | CAGR of 7.10% from 2019-2033 |
| Segmentation |
|
Table of Contents
- 1. Introduction
- 1.1. Research Scope
- 1.2. Market Segmentation
- 1.3. Research Methodology
- 1.4. Definitions and Assumptions
- 2. Executive Summary
- 2.1. Introduction
- 3. Market Dynamics
- 3.1. Introduction
- 3.2. Market Drivers
- 3.2.1. Rising Burden of Blood Disorders; Increasing Technological Advancements and Rising Adoption Rates of Automated Hematology Instruments
- 3.3. Market Restrains
- 3.3.1. High Cost of Hematology Analyzers; Time-consuming and Stringent Rregulatory Policies
- 3.4. Market Trends
- 3.4.1. 3 Part Hematology Analyzer is the Segment by Instruments Expected to Hold Significant Market Share Over the Forecast Period
- 4. Market Factor Analysis
- 4.1. Porters Five Forces
- 4.2. Supply/Value Chain
- 4.3. PESTEL analysis
- 4.4. Market Entropy
- 4.5. Patent/Trademark Analysis
- 5. Global Hematology Analyzers Industry Analysis, Insights and Forecast, 2019-2031
- 5.1. Market Analysis, Insights and Forecast - by Product Type
- 5.1.1. Instruments
- 5.1.1.1. 3 Part Hematology Analyzer
- 5.1.1.2. 5 Part Hematology Analyzer
- 5.1.1.3. Point-of-care Testing Hematology Analyzers
- 5.1.1.4. Others
- 5.1.2. Reagents
- 5.1.3. Services
- 5.1.1. Instruments
- 5.2. Market Analysis, Insights and Forecast - by End User
- 5.2.1. Hospitals
- 5.2.2. Clinical Laboratories
- 5.2.3. Research Institutes
- 5.2.4. Other End Users
- 5.3. Market Analysis, Insights and Forecast - by Region
- 5.3.1. North America
- 5.3.2. Europe
- 5.3.3. Asia Pacific
- 5.3.4. Middle East and Africa
- 5.3.5. South America
- 5.1. Market Analysis, Insights and Forecast - by Product Type
- 6. North America Hematology Analyzers Industry Analysis, Insights and Forecast, 2019-2031
- 6.1. Market Analysis, Insights and Forecast - by Product Type
- 6.1.1. Instruments
- 6.1.1.1. 3 Part Hematology Analyzer
- 6.1.1.2. 5 Part Hematology Analyzer
- 6.1.1.3. Point-of-care Testing Hematology Analyzers
- 6.1.1.4. Others
- 6.1.2. Reagents
- 6.1.3. Services
- 6.1.1. Instruments
- 6.2. Market Analysis, Insights and Forecast - by End User
- 6.2.1. Hospitals
- 6.2.2. Clinical Laboratories
- 6.2.3. Research Institutes
- 6.2.4. Other End Users
- 6.1. Market Analysis, Insights and Forecast - by Product Type
- 7. Europe Hematology Analyzers Industry Analysis, Insights and Forecast, 2019-2031
- 7.1. Market Analysis, Insights and Forecast - by Product Type
- 7.1.1. Instruments
- 7.1.1.1. 3 Part Hematology Analyzer
- 7.1.1.2. 5 Part Hematology Analyzer
- 7.1.1.3. Point-of-care Testing Hematology Analyzers
- 7.1.1.4. Others
- 7.1.2. Reagents
- 7.1.3. Services
- 7.1.1. Instruments
- 7.2. Market Analysis, Insights and Forecast - by End User
- 7.2.1. Hospitals
- 7.2.2. Clinical Laboratories
- 7.2.3. Research Institutes
- 7.2.4. Other End Users
- 7.1. Market Analysis, Insights and Forecast - by Product Type
- 8. Asia Pacific Hematology Analyzers Industry Analysis, Insights and Forecast, 2019-2031
- 8.1. Market Analysis, Insights and Forecast - by Product Type
- 8.1.1. Instruments
- 8.1.1.1. 3 Part Hematology Analyzer
- 8.1.1.2. 5 Part Hematology Analyzer
- 8.1.1.3. Point-of-care Testing Hematology Analyzers
- 8.1.1.4. Others
- 8.1.2. Reagents
- 8.1.3. Services
- 8.1.1. Instruments
- 8.2. Market Analysis, Insights and Forecast - by End User
- 8.2.1. Hospitals
- 8.2.2. Clinical Laboratories
- 8.2.3. Research Institutes
- 8.2.4. Other End Users
- 8.1. Market Analysis, Insights and Forecast - by Product Type
- 9. Middle East and Africa Hematology Analyzers Industry Analysis, Insights and Forecast, 2019-2031
- 9.1. Market Analysis, Insights and Forecast - by Product Type
- 9.1.1. Instruments
- 9.1.1.1. 3 Part Hematology Analyzer
- 9.1.1.2. 5 Part Hematology Analyzer
- 9.1.1.3. Point-of-care Testing Hematology Analyzers
- 9.1.1.4. Others
- 9.1.2. Reagents
- 9.1.3. Services
- 9.1.1. Instruments
- 9.2. Market Analysis, Insights and Forecast - by End User
- 9.2.1. Hospitals
- 9.2.2. Clinical Laboratories
- 9.2.3. Research Institutes
- 9.2.4. Other End Users
- 9.1. Market Analysis, Insights and Forecast - by Product Type
- 10. South America Hematology Analyzers Industry Analysis, Insights and Forecast, 2019-2031
- 10.1. Market Analysis, Insights and Forecast - by Product Type
- 10.1.1. Instruments
- 10.1.1.1. 3 Part Hematology Analyzer
- 10.1.1.2. 5 Part Hematology Analyzer
- 10.1.1.3. Point-of-care Testing Hematology Analyzers
- 10.1.1.4. Others
- 10.1.2. Reagents
- 10.1.3. Services
- 10.1.1. Instruments
- 10.2. Market Analysis, Insights and Forecast - by End User
- 10.2.1. Hospitals
- 10.2.2. Clinical Laboratories
- 10.2.3. Research Institutes
- 10.2.4. Other End Users
- 10.1. Market Analysis, Insights and Forecast - by Product Type
- 11. North America Hematology Analyzers Industry Analysis, Insights and Forecast, 2019-2031
- 11.1. Market Analysis, Insights and Forecast - By Country/Sub-region
- 11.1.1 United States
- 11.1.2 Canada
- 11.1.3 Mexico
- 12. South America Hematology Analyzers Industry Analysis, Insights and Forecast, 2019-2031
- 12.1. Market Analysis, Insights and Forecast - By Country/Sub-region
- 12.1.1 Brazil
- 12.1.2 Mexico
- 12.1.3 Rest of South America
- 13. Europe Hematology Analyzers Industry Analysis, Insights and Forecast, 2019-2031
- 13.1. Market Analysis, Insights and Forecast - By Country/Sub-region
- 13.1.1 United Kingdom
- 13.1.2 Germany
- 13.1.3 France
- 13.1.4 Italy
- 13.1.5 Spain
- 13.1.6 Russia
- 13.1.7 Rest of Europe
- 14. Asia Pacific Hematology Analyzers Industry Analysis, Insights and Forecast, 2019-2031
- 14.1. Market Analysis, Insights and Forecast - By Country/Sub-region
- 14.1.1 China
- 14.1.2 Japan
- 14.1.3 India
- 14.1.4 South Korea
- 14.1.5 Taiwan
- 14.1.6 Australia
- 14.1.7 Rest of Asia-Pacific
- 15. MEA Hematology Analyzers Industry Analysis, Insights and Forecast, 2019-2031
- 15.1. Market Analysis, Insights and Forecast - By Country/Sub-region
- 15.1.1 Middle East
- 15.1.2 Africa
- 16. Competitive Analysis
- 16.1. Global Market Share Analysis 2024
- 16.2. Company Profiles
- 16.2.1 Stratec Biomedical Systems (DIATRON)
- 16.2.1.1. Overview
- 16.2.1.2. Products
- 16.2.1.3. SWOT Analysis
- 16.2.1.4. Recent Developments
- 16.2.1.5. Financials (Based on Availability)
- 16.2.2 Horiba Ltd
- 16.2.2.1. Overview
- 16.2.2.2. Products
- 16.2.2.3. SWOT Analysis
- 16.2.2.4. Recent Developments
- 16.2.2.5. Financials (Based on Availability)
- 16.2.3 Siemens Healthineers
- 16.2.3.1. Overview
- 16.2.3.2. Products
- 16.2.3.3. SWOT Analysis
- 16.2.3.4. Recent Developments
- 16.2.3.5. Financials (Based on Availability)
- 16.2.4 Abbott Laboratories
- 16.2.4.1. Overview
- 16.2.4.2. Products
- 16.2.4.3. SWOT Analysis
- 16.2.4.4. Recent Developments
- 16.2.4.5. Financials (Based on Availability)
- 16.2.5 F Hoffmann-La Roche Ltd
- 16.2.5.1. Overview
- 16.2.5.2. Products
- 16.2.5.3. SWOT Analysis
- 16.2.5.4. Recent Developments
- 16.2.5.5. Financials (Based on Availability)
- 16.2.6 Ortho Clinical Diagnostics
- 16.2.6.1. Overview
- 16.2.6.2. Products
- 16.2.6.3. SWOT Analysis
- 16.2.6.4. Recent Developments
- 16.2.6.5. Financials (Based on Availability)
- 16.2.7 Boule Diagnostics AB
- 16.2.7.1. Overview
- 16.2.7.2. Products
- 16.2.7.3. SWOT Analysis
- 16.2.7.4. Recent Developments
- 16.2.7.5. Financials (Based on Availability)
- 16.2.8 Bio-Rad Laboratories
- 16.2.8.1. Overview
- 16.2.8.2. Products
- 16.2.8.3. SWOT Analysis
- 16.2.8.4. Recent Developments
- 16.2.8.5. Financials (Based on Availability)
- 16.2.9 Beckman Coulter Inc (Danaher Corporation)
- 16.2.9.1. Overview
- 16.2.9.2. Products
- 16.2.9.3. SWOT Analysis
- 16.2.9.4. Recent Developments
- 16.2.9.5. Financials (Based on Availability)
- 16.2.10 Sysmex Corporation
- 16.2.10.1. Overview
- 16.2.10.2. Products
- 16.2.10.3. SWOT Analysis
- 16.2.10.4. Recent Developments
- 16.2.10.5. Financials (Based on Availability)
- 16.2.11 Accurex Biomedical Pvt Ltd
- 16.2.11.1. Overview
- 16.2.11.2. Products
- 16.2.11.3. SWOT Analysis
- 16.2.11.4. Recent Developments
- 16.2.11.5. Financials (Based on Availability)
- 16.2.12 Nihon Kohden Corporation
- 16.2.12.1. Overview
- 16.2.12.2. Products
- 16.2.12.3. SWOT Analysis
- 16.2.12.4. Recent Developments
- 16.2.12.5. Financials (Based on Availability)
- 16.2.1 Stratec Biomedical Systems (DIATRON)
List of Figures
- Figure 1: Global Hematology Analyzers Industry Revenue Breakdown (Million, %) by Region 2024 & 2032
- Figure 2: Global Hematology Analyzers Industry Volume Breakdown (K Unit, %) by Region 2024 & 2032
- Figure 3: North America Hematology Analyzers Industry Revenue (Million), by Country 2024 & 2032
- Figure 4: North America Hematology Analyzers Industry Volume (K Unit), by Country 2024 & 2032
- Figure 5: North America Hematology Analyzers Industry Revenue Share (%), by Country 2024 & 2032
- Figure 6: North America Hematology Analyzers Industry Volume Share (%), by Country 2024 & 2032
- Figure 7: South America Hematology Analyzers Industry Revenue (Million), by Country 2024 & 2032
- Figure 8: South America Hematology Analyzers Industry Volume (K Unit), by Country 2024 & 2032
- Figure 9: South America Hematology Analyzers Industry Revenue Share (%), by Country 2024 & 2032
- Figure 10: South America Hematology Analyzers Industry Volume Share (%), by Country 2024 & 2032
- Figure 11: Europe Hematology Analyzers Industry Revenue (Million), by Country 2024 & 2032
- Figure 12: Europe Hematology Analyzers Industry Volume (K Unit), by Country 2024 & 2032
- Figure 13: Europe Hematology Analyzers Industry Revenue Share (%), by Country 2024 & 2032
- Figure 14: Europe Hematology Analyzers Industry Volume Share (%), by Country 2024 & 2032
- Figure 15: Asia Pacific Hematology Analyzers Industry Revenue (Million), by Country 2024 & 2032
- Figure 16: Asia Pacific Hematology Analyzers Industry Volume (K Unit), by Country 2024 & 2032
- Figure 17: Asia Pacific Hematology Analyzers Industry Revenue Share (%), by Country 2024 & 2032
- Figure 18: Asia Pacific Hematology Analyzers Industry Volume Share (%), by Country 2024 & 2032
- Figure 19: MEA Hematology Analyzers Industry Revenue (Million), by Country 2024 & 2032
- Figure 20: MEA Hematology Analyzers Industry Volume (K Unit), by Country 2024 & 2032
- Figure 21: MEA Hematology Analyzers Industry Revenue Share (%), by Country 2024 & 2032
- Figure 22: MEA Hematology Analyzers Industry Volume Share (%), by Country 2024 & 2032
- Figure 23: North America Hematology Analyzers Industry Revenue (Million), by Product Type 2024 & 2032
- Figure 24: North America Hematology Analyzers Industry Volume (K Unit), by Product Type 2024 & 2032
- Figure 25: North America Hematology Analyzers Industry Revenue Share (%), by Product Type 2024 & 2032
- Figure 26: North America Hematology Analyzers Industry Volume Share (%), by Product Type 2024 & 2032
- Figure 27: North America Hematology Analyzers Industry Revenue (Million), by End User 2024 & 2032
- Figure 28: North America Hematology Analyzers Industry Volume (K Unit), by End User 2024 & 2032
- Figure 29: North America Hematology Analyzers Industry Revenue Share (%), by End User 2024 & 2032
- Figure 30: North America Hematology Analyzers Industry Volume Share (%), by End User 2024 & 2032
- Figure 31: North America Hematology Analyzers Industry Revenue (Million), by Country 2024 & 2032
- Figure 32: North America Hematology Analyzers Industry Volume (K Unit), by Country 2024 & 2032
- Figure 33: North America Hematology Analyzers Industry Revenue Share (%), by Country 2024 & 2032
- Figure 34: North America Hematology Analyzers Industry Volume Share (%), by Country 2024 & 2032
- Figure 35: Europe Hematology Analyzers Industry Revenue (Million), by Product Type 2024 & 2032
- Figure 36: Europe Hematology Analyzers Industry Volume (K Unit), by Product Type 2024 & 2032
- Figure 37: Europe Hematology Analyzers Industry Revenue Share (%), by Product Type 2024 & 2032
- Figure 38: Europe Hematology Analyzers Industry Volume Share (%), by Product Type 2024 & 2032
- Figure 39: Europe Hematology Analyzers Industry Revenue (Million), by End User 2024 & 2032
- Figure 40: Europe Hematology Analyzers Industry Volume (K Unit), by End User 2024 & 2032
- Figure 41: Europe Hematology Analyzers Industry Revenue Share (%), by End User 2024 & 2032
- Figure 42: Europe Hematology Analyzers Industry Volume Share (%), by End User 2024 & 2032
- Figure 43: Europe Hematology Analyzers Industry Revenue (Million), by Country 2024 & 2032
- Figure 44: Europe Hematology Analyzers Industry Volume (K Unit), by Country 2024 & 2032
- Figure 45: Europe Hematology Analyzers Industry Revenue Share (%), by Country 2024 & 2032
- Figure 46: Europe Hematology Analyzers Industry Volume Share (%), by Country 2024 & 2032
- Figure 47: Asia Pacific Hematology Analyzers Industry Revenue (Million), by Product Type 2024 & 2032
- Figure 48: Asia Pacific Hematology Analyzers Industry Volume (K Unit), by Product Type 2024 & 2032
- Figure 49: Asia Pacific Hematology Analyzers Industry Revenue Share (%), by Product Type 2024 & 2032
- Figure 50: Asia Pacific Hematology Analyzers Industry Volume Share (%), by Product Type 2024 & 2032
- Figure 51: Asia Pacific Hematology Analyzers Industry Revenue (Million), by End User 2024 & 2032
- Figure 52: Asia Pacific Hematology Analyzers Industry Volume (K Unit), by End User 2024 & 2032
- Figure 53: Asia Pacific Hematology Analyzers Industry Revenue Share (%), by End User 2024 & 2032
- Figure 54: Asia Pacific Hematology Analyzers Industry Volume Share (%), by End User 2024 & 2032
- Figure 55: Asia Pacific Hematology Analyzers Industry Revenue (Million), by Country 2024 & 2032
- Figure 56: Asia Pacific Hematology Analyzers Industry Volume (K Unit), by Country 2024 & 2032
- Figure 57: Asia Pacific Hematology Analyzers Industry Revenue Share (%), by Country 2024 & 2032
- Figure 58: Asia Pacific Hematology Analyzers Industry Volume Share (%), by Country 2024 & 2032
- Figure 59: Middle East and Africa Hematology Analyzers Industry Revenue (Million), by Product Type 2024 & 2032
- Figure 60: Middle East and Africa Hematology Analyzers Industry Volume (K Unit), by Product Type 2024 & 2032
- Figure 61: Middle East and Africa Hematology Analyzers Industry Revenue Share (%), by Product Type 2024 & 2032
- Figure 62: Middle East and Africa Hematology Analyzers Industry Volume Share (%), by Product Type 2024 & 2032
- Figure 63: Middle East and Africa Hematology Analyzers Industry Revenue (Million), by End User 2024 & 2032
- Figure 64: Middle East and Africa Hematology Analyzers Industry Volume (K Unit), by End User 2024 & 2032
- Figure 65: Middle East and Africa Hematology Analyzers Industry Revenue Share (%), by End User 2024 & 2032
- Figure 66: Middle East and Africa Hematology Analyzers Industry Volume Share (%), by End User 2024 & 2032
- Figure 67: Middle East and Africa Hematology Analyzers Industry Revenue (Million), by Country 2024 & 2032
- Figure 68: Middle East and Africa Hematology Analyzers Industry Volume (K Unit), by Country 2024 & 2032
- Figure 69: Middle East and Africa Hematology Analyzers Industry Revenue Share (%), by Country 2024 & 2032
- Figure 70: Middle East and Africa Hematology Analyzers Industry Volume Share (%), by Country 2024 & 2032
- Figure 71: South America Hematology Analyzers Industry Revenue (Million), by Product Type 2024 & 2032
- Figure 72: South America Hematology Analyzers Industry Volume (K Unit), by Product Type 2024 & 2032
- Figure 73: South America Hematology Analyzers Industry Revenue Share (%), by Product Type 2024 & 2032
- Figure 74: South America Hematology Analyzers Industry Volume Share (%), by Product Type 2024 & 2032
- Figure 75: South America Hematology Analyzers Industry Revenue (Million), by End User 2024 & 2032
- Figure 76: South America Hematology Analyzers Industry Volume (K Unit), by End User 2024 & 2032
- Figure 77: South America Hematology Analyzers Industry Revenue Share (%), by End User 2024 & 2032
- Figure 78: South America Hematology Analyzers Industry Volume Share (%), by End User 2024 & 2032
- Figure 79: South America Hematology Analyzers Industry Revenue (Million), by Country 2024 & 2032
- Figure 80: South America Hematology Analyzers Industry Volume (K Unit), by Country 2024 & 2032
- Figure 81: South America Hematology Analyzers Industry Revenue Share (%), by Country 2024 & 2032
- Figure 82: South America Hematology Analyzers Industry Volume Share (%), by Country 2024 & 2032
List of Tables
- Table 1: Global Hematology Analyzers Industry Revenue Million Forecast, by Region 2019 & 2032
- Table 2: Global Hematology Analyzers Industry Volume K Unit Forecast, by Region 2019 & 2032
- Table 3: Global Hematology Analyzers Industry Revenue Million Forecast, by Product Type 2019 & 2032
- Table 4: Global Hematology Analyzers Industry Volume K Unit Forecast, by Product Type 2019 & 2032
- Table 5: Global Hematology Analyzers Industry Revenue Million Forecast, by End User 2019 & 2032
- Table 6: Global Hematology Analyzers Industry Volume K Unit Forecast, by End User 2019 & 2032
- Table 7: Global Hematology Analyzers Industry Revenue Million Forecast, by Region 2019 & 2032
- Table 8: Global Hematology Analyzers Industry Volume K Unit Forecast, by Region 2019 & 2032
- Table 9: Global Hematology Analyzers Industry Revenue Million Forecast, by Country 2019 & 2032
- Table 10: Global Hematology Analyzers Industry Volume K Unit Forecast, by Country 2019 & 2032
- Table 11: United States Hematology Analyzers Industry Revenue (Million) Forecast, by Application 2019 & 2032
- Table 12: United States Hematology Analyzers Industry Volume (K Unit) Forecast, by Application 2019 & 2032
- Table 13: Canada Hematology Analyzers Industry Revenue (Million) Forecast, by Application 2019 & 2032
- Table 14: Canada Hematology Analyzers Industry Volume (K Unit) Forecast, by Application 2019 & 2032
- Table 15: Mexico Hematology Analyzers Industry Revenue (Million) Forecast, by Application 2019 & 2032
- Table 16: Mexico Hematology Analyzers Industry Volume (K Unit) Forecast, by Application 2019 & 2032
- Table 17: Global Hematology Analyzers Industry Revenue Million Forecast, by Country 2019 & 2032
- Table 18: Global Hematology Analyzers Industry Volume K Unit Forecast, by Country 2019 & 2032
- Table 19: Brazil Hematology Analyzers Industry Revenue (Million) Forecast, by Application 2019 & 2032
- Table 20: Brazil Hematology Analyzers Industry Volume (K Unit) Forecast, by Application 2019 & 2032
- Table 21: Mexico Hematology Analyzers Industry Revenue (Million) Forecast, by Application 2019 & 2032
- Table 22: Mexico Hematology Analyzers Industry Volume (K Unit) Forecast, by Application 2019 & 2032
- Table 23: Rest of South America Hematology Analyzers Industry Revenue (Million) Forecast, by Application 2019 & 2032
- Table 24: Rest of South America Hematology Analyzers Industry Volume (K Unit) Forecast, by Application 2019 & 2032
- Table 25: Global Hematology Analyzers Industry Revenue Million Forecast, by Country 2019 & 2032
- Table 26: Global Hematology Analyzers Industry Volume K Unit Forecast, by Country 2019 & 2032
- Table 27: United Kingdom Hematology Analyzers Industry Revenue (Million) Forecast, by Application 2019 & 2032
- Table 28: United Kingdom Hematology Analyzers Industry Volume (K Unit) Forecast, by Application 2019 & 2032
- Table 29: Germany Hematology Analyzers Industry Revenue (Million) Forecast, by Application 2019 & 2032
- Table 30: Germany Hematology Analyzers Industry Volume (K Unit) Forecast, by Application 2019 & 2032
- Table 31: France Hematology Analyzers Industry Revenue (Million) Forecast, by Application 2019 & 2032
- Table 32: France Hematology Analyzers Industry Volume (K Unit) Forecast, by Application 2019 & 2032
- Table 33: Italy Hematology Analyzers Industry Revenue (Million) Forecast, by Application 2019 & 2032
- Table 34: Italy Hematology Analyzers Industry Volume (K Unit) Forecast, by Application 2019 & 2032
- Table 35: Spain Hematology Analyzers Industry Revenue (Million) Forecast, by Application 2019 & 2032
- Table 36: Spain Hematology Analyzers Industry Volume (K Unit) Forecast, by Application 2019 & 2032
- Table 37: Russia Hematology Analyzers Industry Revenue (Million) Forecast, by Application 2019 & 2032
- Table 38: Russia Hematology Analyzers Industry Volume (K Unit) Forecast, by Application 2019 & 2032
- Table 39: Rest of Europe Hematology Analyzers Industry Revenue (Million) Forecast, by Application 2019 & 2032
- Table 40: Rest of Europe Hematology Analyzers Industry Volume (K Unit) Forecast, by Application 2019 & 2032
- Table 41: Global Hematology Analyzers Industry Revenue Million Forecast, by Country 2019 & 2032
- Table 42: Global Hematology Analyzers Industry Volume K Unit Forecast, by Country 2019 & 2032
- Table 43: China Hematology Analyzers Industry Revenue (Million) Forecast, by Application 2019 & 2032
- Table 44: China Hematology Analyzers Industry Volume (K Unit) Forecast, by Application 2019 & 2032
- Table 45: Japan Hematology Analyzers Industry Revenue (Million) Forecast, by Application 2019 & 2032
- Table 46: Japan Hematology Analyzers Industry Volume (K Unit) Forecast, by Application 2019 & 2032
- Table 47: India Hematology Analyzers Industry Revenue (Million) Forecast, by Application 2019 & 2032
- Table 48: India Hematology Analyzers Industry Volume (K Unit) Forecast, by Application 2019 & 2032
- Table 49: South Korea Hematology Analyzers Industry Revenue (Million) Forecast, by Application 2019 & 2032
- Table 50: South Korea Hematology Analyzers Industry Volume (K Unit) Forecast, by Application 2019 & 2032
- Table 51: Taiwan Hematology Analyzers Industry Revenue (Million) Forecast, by Application 2019 & 2032
- Table 52: Taiwan Hematology Analyzers Industry Volume (K Unit) Forecast, by Application 2019 & 2032
- Table 53: Australia Hematology Analyzers Industry Revenue (Million) Forecast, by Application 2019 & 2032
- Table 54: Australia Hematology Analyzers Industry Volume (K Unit) Forecast, by Application 2019 & 2032
- Table 55: Rest of Asia-Pacific Hematology Analyzers Industry Revenue (Million) Forecast, by Application 2019 & 2032
- Table 56: Rest of Asia-Pacific Hematology Analyzers Industry Volume (K Unit) Forecast, by Application 2019 & 2032
- Table 57: Global Hematology Analyzers Industry Revenue Million Forecast, by Country 2019 & 2032
- Table 58: Global Hematology Analyzers Industry Volume K Unit Forecast, by Country 2019 & 2032
- Table 59: Middle East Hematology Analyzers Industry Revenue (Million) Forecast, by Application 2019 & 2032
- Table 60: Middle East Hematology Analyzers Industry Volume (K Unit) Forecast, by Application 2019 & 2032
- Table 61: Africa Hematology Analyzers Industry Revenue (Million) Forecast, by Application 2019 & 2032
- Table 62: Africa Hematology Analyzers Industry Volume (K Unit) Forecast, by Application 2019 & 2032
- Table 63: Global Hematology Analyzers Industry Revenue Million Forecast, by Product Type 2019 & 2032
- Table 64: Global Hematology Analyzers Industry Volume K Unit Forecast, by Product Type 2019 & 2032
- Table 65: Global Hematology Analyzers Industry Revenue Million Forecast, by End User 2019 & 2032
- Table 66: Global Hematology Analyzers Industry Volume K Unit Forecast, by End User 2019 & 2032
- Table 67: Global Hematology Analyzers Industry Revenue Million Forecast, by Country 2019 & 2032
- Table 68: Global Hematology Analyzers Industry Volume K Unit Forecast, by Country 2019 & 2032
- Table 69: United States Hematology Analyzers Industry Revenue (Million) Forecast, by Application 2019 & 2032
- Table 70: United States Hematology Analyzers Industry Volume (K Unit) Forecast, by Application 2019 & 2032
- Table 71: Canada Hematology Analyzers Industry Revenue (Million) Forecast, by Application 2019 & 2032
- Table 72: Canada Hematology Analyzers Industry Volume (K Unit) Forecast, by Application 2019 & 2032
- Table 73: Mexico Hematology Analyzers Industry Revenue (Million) Forecast, by Application 2019 & 2032
- Table 74: Mexico Hematology Analyzers Industry Volume (K Unit) Forecast, by Application 2019 & 2032
- Table 75: Global Hematology Analyzers Industry Revenue Million Forecast, by Product Type 2019 & 2032
- Table 76: Global Hematology Analyzers Industry Volume K Unit Forecast, by Product Type 2019 & 2032
- Table 77: Global Hematology Analyzers Industry Revenue Million Forecast, by End User 2019 & 2032
- Table 78: Global Hematology Analyzers Industry Volume K Unit Forecast, by End User 2019 & 2032
- Table 79: Global Hematology Analyzers Industry Revenue Million Forecast, by Country 2019 & 2032
- Table 80: Global Hematology Analyzers Industry Volume K Unit Forecast, by Country 2019 & 2032
- Table 81: Germany Hematology Analyzers Industry Revenue (Million) Forecast, by Application 2019 & 2032
- Table 82: Germany Hematology Analyzers Industry Volume (K Unit) Forecast, by Application 2019 & 2032
- Table 83: United Kingdom Hematology Analyzers Industry Revenue (Million) Forecast, by Application 2019 & 2032
- Table 84: United Kingdom Hematology Analyzers Industry Volume (K Unit) Forecast, by Application 2019 & 2032
- Table 85: France Hematology Analyzers Industry Revenue (Million) Forecast, by Application 2019 & 2032
- Table 86: France Hematology Analyzers Industry Volume (K Unit) Forecast, by Application 2019 & 2032
- Table 87: Italy Hematology Analyzers Industry Revenue (Million) Forecast, by Application 2019 & 2032
- Table 88: Italy Hematology Analyzers Industry Volume (K Unit) Forecast, by Application 2019 & 2032
- Table 89: Spain Hematology Analyzers Industry Revenue (Million) Forecast, by Application 2019 & 2032
- Table 90: Spain Hematology Analyzers Industry Volume (K Unit) Forecast, by Application 2019 & 2032
- Table 91: Rest of Europe Hematology Analyzers Industry Revenue (Million) Forecast, by Application 2019 & 2032
- Table 92: Rest of Europe Hematology Analyzers Industry Volume (K Unit) Forecast, by Application 2019 & 2032
- Table 93: Global Hematology Analyzers Industry Revenue Million Forecast, by Product Type 2019 & 2032
- Table 94: Global Hematology Analyzers Industry Volume K Unit Forecast, by Product Type 2019 & 2032
- Table 95: Global Hematology Analyzers Industry Revenue Million Forecast, by End User 2019 & 2032
- Table 96: Global Hematology Analyzers Industry Volume K Unit Forecast, by End User 2019 & 2032
- Table 97: Global Hematology Analyzers Industry Revenue Million Forecast, by Country 2019 & 2032
- Table 98: Global Hematology Analyzers Industry Volume K Unit Forecast, by Country 2019 & 2032
- Table 99: China Hematology Analyzers Industry Revenue (Million) Forecast, by Application 2019 & 2032
- Table 100: China Hematology Analyzers Industry Volume (K Unit) Forecast, by Application 2019 & 2032
- Table 101: Japan Hematology Analyzers Industry Revenue (Million) Forecast, by Application 2019 & 2032
- Table 102: Japan Hematology Analyzers Industry Volume (K Unit) Forecast, by Application 2019 & 2032
- Table 103: India Hematology Analyzers Industry Revenue (Million) Forecast, by Application 2019 & 2032
- Table 104: India Hematology Analyzers Industry Volume (K Unit) Forecast, by Application 2019 & 2032
- Table 105: Australia Hematology Analyzers Industry Revenue (Million) Forecast, by Application 2019 & 2032
- Table 106: Australia Hematology Analyzers Industry Volume (K Unit) Forecast, by Application 2019 & 2032
- Table 107: South Korea Hematology Analyzers Industry Revenue (Million) Forecast, by Application 2019 & 2032
- Table 108: South Korea Hematology Analyzers Industry Volume (K Unit) Forecast, by Application 2019 & 2032
- Table 109: Rest of Asia Pacific Hematology Analyzers Industry Revenue (Million) Forecast, by Application 2019 & 2032
- Table 110: Rest of Asia Pacific Hematology Analyzers Industry Volume (K Unit) Forecast, by Application 2019 & 2032
- Table 111: Global Hematology Analyzers Industry Revenue Million Forecast, by Product Type 2019 & 2032
- Table 112: Global Hematology Analyzers Industry Volume K Unit Forecast, by Product Type 2019 & 2032
- Table 113: Global Hematology Analyzers Industry Revenue Million Forecast, by End User 2019 & 2032
- Table 114: Global Hematology Analyzers Industry Volume K Unit Forecast, by End User 2019 & 2032
- Table 115: Global Hematology Analyzers Industry Revenue Million Forecast, by Country 2019 & 2032
- Table 116: Global Hematology Analyzers Industry Volume K Unit Forecast, by Country 2019 & 2032
- Table 117: GCC Hematology Analyzers Industry Revenue (Million) Forecast, by Application 2019 & 2032
- Table 118: GCC Hematology Analyzers Industry Volume (K Unit) Forecast, by Application 2019 & 2032
- Table 119: South Africa Hematology Analyzers Industry Revenue (Million) Forecast, by Application 2019 & 2032
- Table 120: South Africa Hematology Analyzers Industry Volume (K Unit) Forecast, by Application 2019 & 2032
- Table 121: Rest of Middle East and Africa Hematology Analyzers Industry Revenue (Million) Forecast, by Application 2019 & 2032
- Table 122: Rest of Middle East and Africa Hematology Analyzers Industry Volume (K Unit) Forecast, by Application 2019 & 2032
- Table 123: Global Hematology Analyzers Industry Revenue Million Forecast, by Product Type 2019 & 2032
- Table 124: Global Hematology Analyzers Industry Volume K Unit Forecast, by Product Type 2019 & 2032
- Table 125: Global Hematology Analyzers Industry Revenue Million Forecast, by End User 2019 & 2032
- Table 126: Global Hematology Analyzers Industry Volume K Unit Forecast, by End User 2019 & 2032
- Table 127: Global Hematology Analyzers Industry Revenue Million Forecast, by Country 2019 & 2032
- Table 128: Global Hematology Analyzers Industry Volume K Unit Forecast, by Country 2019 & 2032
- Table 129: Brazil Hematology Analyzers Industry Revenue (Million) Forecast, by Application 2019 & 2032
- Table 130: Brazil Hematology Analyzers Industry Volume (K Unit) Forecast, by Application 2019 & 2032
- Table 131: Argentina Hematology Analyzers Industry Revenue (Million) Forecast, by Application 2019 & 2032
- Table 132: Argentina Hematology Analyzers Industry Volume (K Unit) Forecast, by Application 2019 & 2032
- Table 133: Rest of South America Hematology Analyzers Industry Revenue (Million) Forecast, by Application 2019 & 2032
- Table 134: Rest of South America Hematology Analyzers Industry Volume (K Unit) Forecast, by Application 2019 & 2032
Frequently Asked Questions
1. What is the projected Compound Annual Growth Rate (CAGR) of the Hematology Analyzers Industry?
The projected CAGR is approximately 7.10%.
2. Which companies are prominent players in the Hematology Analyzers Industry?
Key companies in the market include Stratec Biomedical Systems (DIATRON), Horiba Ltd, Siemens Healthineers, Abbott Laboratories, F Hoffmann-La Roche Ltd, Ortho Clinical Diagnostics, Boule Diagnostics AB, Bio-Rad Laboratories, Beckman Coulter Inc (Danaher Corporation), Sysmex Corporation, Accurex Biomedical Pvt Ltd , Nihon Kohden Corporation.
3. What are the main segments of the Hematology Analyzers Industry?
The market segments include Product Type, End User.
4. Can you provide details about the market size?
The market size is estimated to be USD 6.23 Million as of 2022.
5. What are some drivers contributing to market growth?
Rising Burden of Blood Disorders; Increasing Technological Advancements and Rising Adoption Rates of Automated Hematology Instruments.
6. What are the notable trends driving market growth?
3 Part Hematology Analyzer is the Segment by Instruments Expected to Hold Significant Market Share Over the Forecast Period.
7. Are there any restraints impacting market growth?
High Cost of Hematology Analyzers; Time-consuming and Stringent Rregulatory Policies.
8. Can you provide examples of recent developments in the market?
In May 2022, Nihon Kohden India established a new hematology analyzer reagent factory.
9. What pricing options are available for accessing the report?
Pricing options include single-user, multi-user, and enterprise licenses priced at USD 4750, USD 5250, and USD 8750 respectively.
10. Is the market size provided in terms of value or volume?
The market size is provided in terms of value, measured in Million and volume, measured in K Unit.
11. Are there any specific market keywords associated with the report?
Yes, the market keyword associated with the report is "Hematology Analyzers Industry," which aids in identifying and referencing the specific market segment covered.
12. How do I determine which pricing option suits my needs best?
The pricing options vary based on user requirements and access needs. Individual users may opt for single-user licenses, while businesses requiring broader access may choose multi-user or enterprise licenses for cost-effective access to the report.
13. Are there any additional resources or data provided in the Hematology Analyzers Industry report?
While the report offers comprehensive insights, it's advisable to review the specific contents or supplementary materials provided to ascertain if additional resources or data are available.
14. How can I stay updated on further developments or reports in the Hematology Analyzers Industry?
To stay informed about further developments, trends, and reports in the Hematology Analyzers Industry, consider subscribing to industry newsletters, following relevant companies and organizations, or regularly checking reputable industry news sources and publications.
Methodology
Step 1 - Identification of Relevant Samples Size from Population Database


Step 2 - Approaches for Defining Global Market Size (Value, Volume* & Price*)

Note*: In applicable scenarios
Step 3 - Data Sources
Primary Research
- Web Analytics
- Survey Reports
- Research Institute
- Latest Research Reports
- Opinion Leaders
Secondary Research
- Annual Reports
- White Paper
- Latest Press Release
- Industry Association
- Paid Database
- Investor Presentations

Step 4 - Data Triangulation
Involves using different sources of information in order to increase the validity of a study
These sources are likely to be stakeholders in a program - participants, other researchers, program staff, other community members, and so on.
Then we put all data in single framework & apply various statistical tools to find out the dynamic on the market.
During the analysis stage, feedback from the stakeholder groups would be compared to determine areas of agreement as well as areas of divergence


