
Key Insights
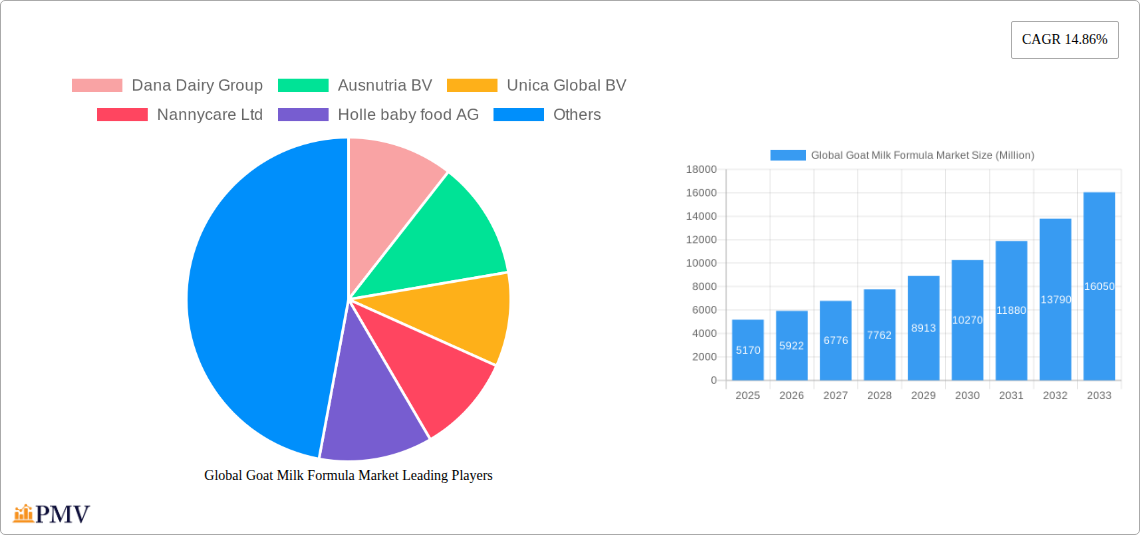
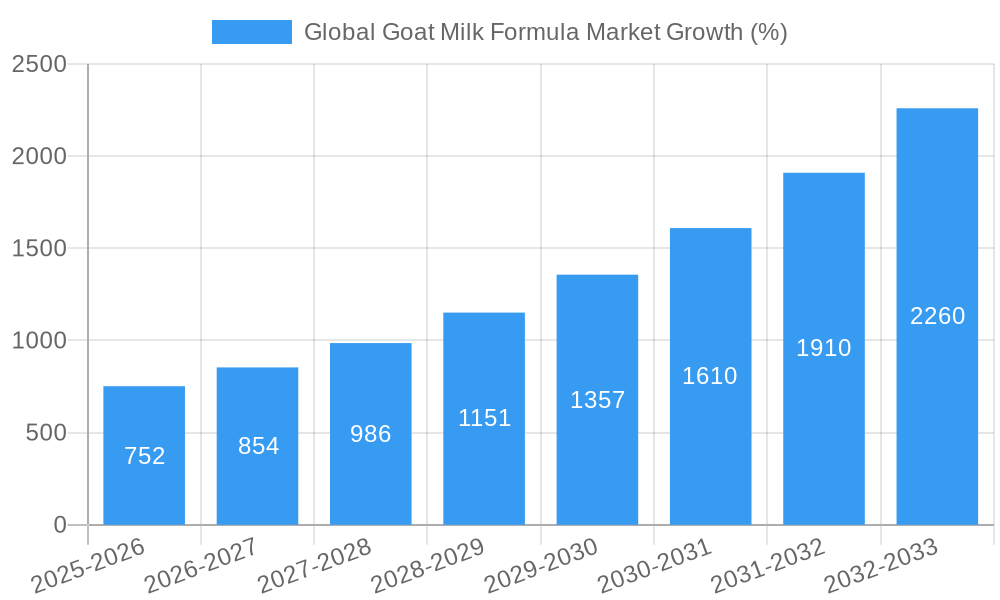
The global goat milk formula market is experiencing robust growth, projected to reach $5.17 billion in 2025 and maintain a Compound Annual Growth Rate (CAGR) of 14.86% from 2025 to 2033. This expansion is fueled by several key factors. Increasing awareness of the potential health benefits of goat milk, such as easier digestibility for infants with sensitive stomachs and reduced allergy risks compared to cow's milk, is a primary driver. The rising prevalence of infant allergies and lactose intolerance is further bolstering demand. Furthermore, the growing preference for organic and natural products among health-conscious parents contributes significantly to market growth. The market also benefits from increased disposable incomes in developing economies and expanding distribution channels, making goat milk formula more accessible globally. Key players like Dana Dairy Group, Ausnutria BV, and Danone are strategically investing in research and development, product innovation, and expanding their market presence to capitalize on this growth opportunity. Premiumization, with the introduction of specialized formulas targeting specific nutritional needs, also represents a notable market trend.
Competition in the goat milk formula market is intensifying, with both established players and emerging brands vying for market share. However, challenges remain, including the relatively higher cost of production compared to cow's milk-based formulas, which can limit accessibility in price-sensitive markets. Fluctuations in raw material costs and stringent regulatory requirements in various regions also pose potential restraints to market expansion. Nevertheless, the long-term outlook remains positive, with significant growth potential driven by continued consumer preference for healthier alternatives and ongoing product innovation within the goat milk formula sector. Geographic expansion into untapped markets and strategic partnerships are likely to be key strategies for companies aiming to capture a larger share of this burgeoning market.
Global Goat Milk Formula Market: A Comprehensive Market Report (2019-2033)
This detailed report provides a comprehensive analysis of the Global Goat Milk Formula Market, covering market structure, competitive dynamics, industry trends, key players, and future growth prospects. The study period spans 2019-2033, with 2025 as the base and estimated year, and a forecast period of 2025-2033. This report is essential for industry stakeholders, investors, and anyone seeking to understand this rapidly evolving market.
Global Goat Milk Formula Market Structure & Competitive Dynamics
The global goat milk formula market exhibits a moderately concentrated structure, with several key players vying for market share. Market concentration is influenced by factors including brand recognition, distribution networks, and regulatory approvals. Innovation is a crucial driver, with companies continuously developing new formulations and product features to cater to evolving consumer preferences. Regulatory frameworks vary across regions, impacting market access and product approval timelines. The market also sees competition from substitute products like cow milk-based formulas and plant-based alternatives. End-user trends, particularly increased awareness of infant nutrition and health, are driving demand. Mergers and acquisitions (M&A) activity within the sector is moderate, with deals focused on expanding product portfolios and market reach. In 2024, the estimated value of M&A deals in this market was approximately xx Million, reflecting the strategic importance of consolidation within the industry. Market share distribution among the top five players is estimated to be around xx%, indicating a relatively fragmented landscape.
Global Goat Milk Formula Market Industry Trends & Insights
The global goat milk formula market is experiencing robust growth, projected to reach xx Million by 2033, with a Compound Annual Growth Rate (CAGR) of xx% during the forecast period (2025-2033). This growth is fueled by several key factors: increasing awareness of the potential health benefits of goat milk formula, rising disposable incomes in developing economies, and changing consumer preferences toward natural and organic products. Technological advancements in formula production and packaging further enhance market growth. Market penetration continues to rise, especially in regions with growing middle classes and increased access to information on infant nutrition. Competitive intensity is high, driven by new entrants and product innovation. However, challenges remain, including stringent regulatory requirements, variations in consumer perceptions across different geographies, and pricing pressures.
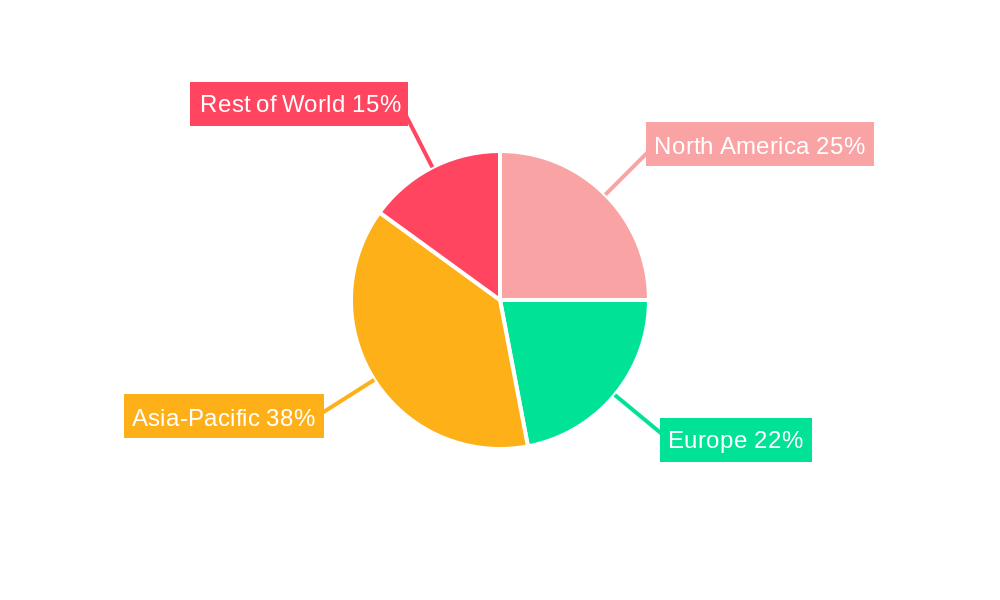
Dominant Markets & Segments in Global Goat Milk Formula Market
The Asia-Pacific region currently dominates the global goat milk formula market, owing to a large population base, rising disposable incomes, and increasing awareness of the benefits of goat milk-based nutrition for infants. China, in particular, represents a significant market segment, driving considerable regional growth.
- Key Drivers in Asia-Pacific:
- Rapidly growing middle class.
- Increased disposable incomes.
- Growing awareness of infant nutrition.
- Government initiatives promoting child health.
- Strong distribution networks.
The dominance of Asia-Pacific is primarily attributable to its massive consumer base and evolving dietary habits. Other regions, such as North America and Europe, also exhibit significant market potential, though the pace of growth is influenced by factors including regulatory environments and consumer acceptance of goat milk formulas.
Global Goat Milk Formula Market Product Innovations
Recent innovations in the goat milk formula market focus on enhancing digestibility, improving nutritional profiles (e.g., adding probiotics or prebiotics), and developing specialized formulas for specific infant needs. Technological advancements, such as improved processing techniques and packaging innovations, contribute to product quality and shelf life. These innovations are aimed at improving product efficacy, addressing consumer demands for healthier alternatives, and achieving a competitive edge in the marketplace.
Report Segmentation & Scope
This report segments the global goat milk formula market based on various factors, including product type (infant formula, toddler formula), distribution channel (online, offline), and region (North America, Europe, Asia-Pacific, Latin America, Middle East & Africa). Growth projections and market size estimates are provided for each segment. The competitive landscape within each segment is also analyzed, highlighting key players, their strategies, and market shares. Each segment offers unique opportunities and challenges. For example, the online distribution channel is witnessing significant growth due to convenience and accessibility.
Key Drivers of Global Goat Milk Formula Market Growth
Several factors contribute to the growth of the goat milk formula market. These include the perceived health benefits of goat milk (easier digestion, hypoallergenic properties), rising consumer awareness of infant nutrition, and increasing disposable incomes in developing economies. Favorable government regulations supporting infant nutrition also boost market growth. Technological advancements, like improved processing techniques, enhance product quality and contribute to the market expansion.
Challenges in the Global Goat Milk Formula Market Sector
Despite its growth potential, the goat milk formula market faces challenges, including stringent regulatory requirements in certain countries, fluctuating raw material prices, and maintaining a consistent supply chain. Competition from established players in the infant formula market, coupled with the emergence of new entrants, creates a competitive landscape. Consumer perceptions and acceptance of goat milk formulas may also vary across regions, affecting market penetration.
Leading Players in the Global Goat Milk Formula Market
- Dana Dairy Group
- Ausnutria BV
- Unica Global BV
- Nannycare Ltd
- Holle baby food AG
- Pure Goat Company
- Loulouka
- Danone SA
- Biostime Nutrition
- The LittleOak Company
- List Not Exhaustive
Key Developments in Global Goat Milk Formula Market Sector
- January 2024: Kabrita secured long-term FDA authorization for its goat milk-based infant formula in the US, ensuring consistent market availability.
- August 2023: Kendamil launched its Goat Milk Infant and Toddler Formula range in the United States, providing a new, gentle option.
- March 2023: ObvioHealth, IQVIA Consumer Health, and Jovie USA launched a decentralized clinical trial for a goat milk-based infant formula in the US, utilizing innovative trial design.
Strategic Global Goat Milk Formula Market Outlook
The global goat milk formula market presents significant growth potential. Strategic opportunities exist for companies to focus on product innovation, enhance distribution networks, and effectively address consumer concerns regarding product safety and efficacy. Expanding into untapped markets, particularly in developing economies, offers considerable growth prospects. Strategic partnerships and collaborations can help navigate regulatory hurdles and optimize supply chains. The future success of companies in this market hinges on adapting to evolving consumer demands and embracing technological advancements.
Global Goat Milk Formula Market Segmentation
-
1. Distribution Channel
- 1.1. Supermarkets/Hypermarkets
- 1.2. Convenience Stores
- 1.3. Pharmacy/Drug Stores
- 1.4. Online Stores
- 1.5. Other Distribution Channels
Global Goat Milk Formula Market Segmentation By Geography
-
1. North America
- 1.1. United States
- 1.2. Canada
- 1.3. Mexico
- 1.4. Rest of North America
-
2. Europe
- 2.1. Spain
- 2.2. United Kingdom
- 2.3. France
- 2.4. Germany
- 2.5. Italy
- 2.6. Russia
- 2.7. Rest of Europe
-
3. Asia Pacific
- 3.1. China
- 3.2. Japan
- 3.3. India
- 3.4. Australia
- 3.5. Rest of Asia Pacific
-
4. South America
- 4.1. Brazil
- 4.2. Argentina
- 4.3. Rest of South America
-
5. Middle East and Africa
- 5.1. South Africa
- 5.2. Saudi Arabia
- 5.3. Rest of Middle East and Africa
Global Goat Milk Formula Market REPORT HIGHLIGHTS
| Aspects | Details |
|---|---|
| Study Period | 2019-2033 |
| Base Year | 2024 |
| Estimated Year | 2025 |
| Forecast Period | 2025-2033 |
| Historical Period | 2019-2024 |
| Growth Rate | CAGR of 14.86% from 2019-2033 |
| Segmentation |
|
Table of Contents
- 1. Introduction
- 1.1. Research Scope
- 1.2. Market Segmentation
- 1.3. Research Methodology
- 1.4. Definitions and Assumptions
- 2. Executive Summary
- 2.1. Introduction
- 3. Market Dynamics
- 3.1. Introduction
- 3.2. Market Drivers
- 3.2.1. Health Benefits Associated with The Consumption of Goat Milk in Infants and Children; Surging Demand for Clean-label and Organic Products
- 3.3. Market Restrains
- 3.3.1. Health Benefits Associated with The Consumption of Goat Milk in Infants and Children; Surging Demand for Clean-label and Organic Products
- 3.4. Market Trends
- 3.4.1. Online Retail Channels are Projected to be the Fastest-growing Distribution Channel
- 4. Market Factor Analysis
- 4.1. Porters Five Forces
- 4.2. Supply/Value Chain
- 4.3. PESTEL analysis
- 4.4. Market Entropy
- 4.5. Patent/Trademark Analysis
- 5. Global Goat Milk Formula Market Analysis, Insights and Forecast, 2019-2031
- 5.1. Market Analysis, Insights and Forecast - by Distribution Channel
- 5.1.1. Supermarkets/Hypermarkets
- 5.1.2. Convenience Stores
- 5.1.3. Pharmacy/Drug Stores
- 5.1.4. Online Stores
- 5.1.5. Other Distribution Channels
- 5.2. Market Analysis, Insights and Forecast - by Region
- 5.2.1. North America
- 5.2.2. Europe
- 5.2.3. Asia Pacific
- 5.2.4. South America
- 5.2.5. Middle East and Africa
- 5.1. Market Analysis, Insights and Forecast - by Distribution Channel
- 6. North America Global Goat Milk Formula Market Analysis, Insights and Forecast, 2019-2031
- 6.1. Market Analysis, Insights and Forecast - by Distribution Channel
- 6.1.1. Supermarkets/Hypermarkets
- 6.1.2. Convenience Stores
- 6.1.3. Pharmacy/Drug Stores
- 6.1.4. Online Stores
- 6.1.5. Other Distribution Channels
- 6.1. Market Analysis, Insights and Forecast - by Distribution Channel
- 7. Europe Global Goat Milk Formula Market Analysis, Insights and Forecast, 2019-2031
- 7.1. Market Analysis, Insights and Forecast - by Distribution Channel
- 7.1.1. Supermarkets/Hypermarkets
- 7.1.2. Convenience Stores
- 7.1.3. Pharmacy/Drug Stores
- 7.1.4. Online Stores
- 7.1.5. Other Distribution Channels
- 7.1. Market Analysis, Insights and Forecast - by Distribution Channel
- 8. Asia Pacific Global Goat Milk Formula Market Analysis, Insights and Forecast, 2019-2031
- 8.1. Market Analysis, Insights and Forecast - by Distribution Channel
- 8.1.1. Supermarkets/Hypermarkets
- 8.1.2. Convenience Stores
- 8.1.3. Pharmacy/Drug Stores
- 8.1.4. Online Stores
- 8.1.5. Other Distribution Channels
- 8.1. Market Analysis, Insights and Forecast - by Distribution Channel
- 9. South America Global Goat Milk Formula Market Analysis, Insights and Forecast, 2019-2031
- 9.1. Market Analysis, Insights and Forecast - by Distribution Channel
- 9.1.1. Supermarkets/Hypermarkets
- 9.1.2. Convenience Stores
- 9.1.3. Pharmacy/Drug Stores
- 9.1.4. Online Stores
- 9.1.5. Other Distribution Channels
- 9.1. Market Analysis, Insights and Forecast - by Distribution Channel
- 10. Middle East and Africa Global Goat Milk Formula Market Analysis, Insights and Forecast, 2019-2031
- 10.1. Market Analysis, Insights and Forecast - by Distribution Channel
- 10.1.1. Supermarkets/Hypermarkets
- 10.1.2. Convenience Stores
- 10.1.3. Pharmacy/Drug Stores
- 10.1.4. Online Stores
- 10.1.5. Other Distribution Channels
- 10.1. Market Analysis, Insights and Forecast - by Distribution Channel
- 11. Competitive Analysis
- 11.1. Market Share Analysis 2024
- 11.2. Company Profiles
- 11.2.1 Dana Dairy Group
- 11.2.1.1. Overview
- 11.2.1.2. Products
- 11.2.1.3. SWOT Analysis
- 11.2.1.4. Recent Developments
- 11.2.1.5. Financials (Based on Availability)
- 11.2.2 Ausnutria BV
- 11.2.2.1. Overview
- 11.2.2.2. Products
- 11.2.2.3. SWOT Analysis
- 11.2.2.4. Recent Developments
- 11.2.2.5. Financials (Based on Availability)
- 11.2.3 Unica Global BV
- 11.2.3.1. Overview
- 11.2.3.2. Products
- 11.2.3.3. SWOT Analysis
- 11.2.3.4. Recent Developments
- 11.2.3.5. Financials (Based on Availability)
- 11.2.4 Nannycare Ltd
- 11.2.4.1. Overview
- 11.2.4.2. Products
- 11.2.4.3. SWOT Analysis
- 11.2.4.4. Recent Developments
- 11.2.4.5. Financials (Based on Availability)
- 11.2.5 Holle baby food AG
- 11.2.5.1. Overview
- 11.2.5.2. Products
- 11.2.5.3. SWOT Analysis
- 11.2.5.4. Recent Developments
- 11.2.5.5. Financials (Based on Availability)
- 11.2.6 Pure Goat Company
- 11.2.6.1. Overview
- 11.2.6.2. Products
- 11.2.6.3. SWOT Analysis
- 11.2.6.4. Recent Developments
- 11.2.6.5. Financials (Based on Availability)
- 11.2.7 Loulouka
- 11.2.7.1. Overview
- 11.2.7.2. Products
- 11.2.7.3. SWOT Analysis
- 11.2.7.4. Recent Developments
- 11.2.7.5. Financials (Based on Availability)
- 11.2.8 Danone SA
- 11.2.8.1. Overview
- 11.2.8.2. Products
- 11.2.8.3. SWOT Analysis
- 11.2.8.4. Recent Developments
- 11.2.8.5. Financials (Based on Availability)
- 11.2.9 Biostime Nutrition
- 11.2.9.1. Overview
- 11.2.9.2. Products
- 11.2.9.3. SWOT Analysis
- 11.2.9.4. Recent Developments
- 11.2.9.5. Financials (Based on Availability)
- 11.2.10 The LittleOak Company*List Not Exhaustive
- 11.2.10.1. Overview
- 11.2.10.2. Products
- 11.2.10.3. SWOT Analysis
- 11.2.10.4. Recent Developments
- 11.2.10.5. Financials (Based on Availability)
- 11.2.1 Dana Dairy Group
List of Figures
- Figure 1: Global Global Goat Milk Formula Market Revenue Breakdown (Million, %) by Region 2024 & 2032
- Figure 2: Global Global Goat Milk Formula Market Volume Breakdown (Billion, %) by Region 2024 & 2032
- Figure 3: North America Global Goat Milk Formula Market Revenue (Million), by Distribution Channel 2024 & 2032
- Figure 4: North America Global Goat Milk Formula Market Volume (Billion), by Distribution Channel 2024 & 2032
- Figure 5: North America Global Goat Milk Formula Market Revenue Share (%), by Distribution Channel 2024 & 2032
- Figure 6: North America Global Goat Milk Formula Market Volume Share (%), by Distribution Channel 2024 & 2032
- Figure 7: North America Global Goat Milk Formula Market Revenue (Million), by Country 2024 & 2032
- Figure 8: North America Global Goat Milk Formula Market Volume (Billion), by Country 2024 & 2032
- Figure 9: North America Global Goat Milk Formula Market Revenue Share (%), by Country 2024 & 2032
- Figure 10: North America Global Goat Milk Formula Market Volume Share (%), by Country 2024 & 2032
- Figure 11: Europe Global Goat Milk Formula Market Revenue (Million), by Distribution Channel 2024 & 2032
- Figure 12: Europe Global Goat Milk Formula Market Volume (Billion), by Distribution Channel 2024 & 2032
- Figure 13: Europe Global Goat Milk Formula Market Revenue Share (%), by Distribution Channel 2024 & 2032
- Figure 14: Europe Global Goat Milk Formula Market Volume Share (%), by Distribution Channel 2024 & 2032
- Figure 15: Europe Global Goat Milk Formula Market Revenue (Million), by Country 2024 & 2032
- Figure 16: Europe Global Goat Milk Formula Market Volume (Billion), by Country 2024 & 2032
- Figure 17: Europe Global Goat Milk Formula Market Revenue Share (%), by Country 2024 & 2032
- Figure 18: Europe Global Goat Milk Formula Market Volume Share (%), by Country 2024 & 2032
- Figure 19: Asia Pacific Global Goat Milk Formula Market Revenue (Million), by Distribution Channel 2024 & 2032
- Figure 20: Asia Pacific Global Goat Milk Formula Market Volume (Billion), by Distribution Channel 2024 & 2032
- Figure 21: Asia Pacific Global Goat Milk Formula Market Revenue Share (%), by Distribution Channel 2024 & 2032
- Figure 22: Asia Pacific Global Goat Milk Formula Market Volume Share (%), by Distribution Channel 2024 & 2032
- Figure 23: Asia Pacific Global Goat Milk Formula Market Revenue (Million), by Country 2024 & 2032
- Figure 24: Asia Pacific Global Goat Milk Formula Market Volume (Billion), by Country 2024 & 2032
- Figure 25: Asia Pacific Global Goat Milk Formula Market Revenue Share (%), by Country 2024 & 2032
- Figure 26: Asia Pacific Global Goat Milk Formula Market Volume Share (%), by Country 2024 & 2032
- Figure 27: South America Global Goat Milk Formula Market Revenue (Million), by Distribution Channel 2024 & 2032
- Figure 28: South America Global Goat Milk Formula Market Volume (Billion), by Distribution Channel 2024 & 2032
- Figure 29: South America Global Goat Milk Formula Market Revenue Share (%), by Distribution Channel 2024 & 2032
- Figure 30: South America Global Goat Milk Formula Market Volume Share (%), by Distribution Channel 2024 & 2032
- Figure 31: South America Global Goat Milk Formula Market Revenue (Million), by Country 2024 & 2032
- Figure 32: South America Global Goat Milk Formula Market Volume (Billion), by Country 2024 & 2032
- Figure 33: South America Global Goat Milk Formula Market Revenue Share (%), by Country 2024 & 2032
- Figure 34: South America Global Goat Milk Formula Market Volume Share (%), by Country 2024 & 2032
- Figure 35: Middle East and Africa Global Goat Milk Formula Market Revenue (Million), by Distribution Channel 2024 & 2032
- Figure 36: Middle East and Africa Global Goat Milk Formula Market Volume (Billion), by Distribution Channel 2024 & 2032
- Figure 37: Middle East and Africa Global Goat Milk Formula Market Revenue Share (%), by Distribution Channel 2024 & 2032
- Figure 38: Middle East and Africa Global Goat Milk Formula Market Volume Share (%), by Distribution Channel 2024 & 2032
- Figure 39: Middle East and Africa Global Goat Milk Formula Market Revenue (Million), by Country 2024 & 2032
- Figure 40: Middle East and Africa Global Goat Milk Formula Market Volume (Billion), by Country 2024 & 2032
- Figure 41: Middle East and Africa Global Goat Milk Formula Market Revenue Share (%), by Country 2024 & 2032
- Figure 42: Middle East and Africa Global Goat Milk Formula Market Volume Share (%), by Country 2024 & 2032
List of Tables
- Table 1: Global Goat Milk Formula Market Revenue Million Forecast, by Region 2019 & 2032
- Table 2: Global Goat Milk Formula Market Volume Billion Forecast, by Region 2019 & 2032
- Table 3: Global Goat Milk Formula Market Revenue Million Forecast, by Distribution Channel 2019 & 2032
- Table 4: Global Goat Milk Formula Market Volume Billion Forecast, by Distribution Channel 2019 & 2032
- Table 5: Global Goat Milk Formula Market Revenue Million Forecast, by Region 2019 & 2032
- Table 6: Global Goat Milk Formula Market Volume Billion Forecast, by Region 2019 & 2032
- Table 7: Global Goat Milk Formula Market Revenue Million Forecast, by Distribution Channel 2019 & 2032
- Table 8: Global Goat Milk Formula Market Volume Billion Forecast, by Distribution Channel 2019 & 2032
- Table 9: Global Goat Milk Formula Market Revenue Million Forecast, by Country 2019 & 2032
- Table 10: Global Goat Milk Formula Market Volume Billion Forecast, by Country 2019 & 2032
- Table 11: United States Global Goat Milk Formula Market Revenue (Million) Forecast, by Application 2019 & 2032
- Table 12: United States Global Goat Milk Formula Market Volume (Billion) Forecast, by Application 2019 & 2032
- Table 13: Canada Global Goat Milk Formula Market Revenue (Million) Forecast, by Application 2019 & 2032
- Table 14: Canada Global Goat Milk Formula Market Volume (Billion) Forecast, by Application 2019 & 2032
- Table 15: Mexico Global Goat Milk Formula Market Revenue (Million) Forecast, by Application 2019 & 2032
- Table 16: Mexico Global Goat Milk Formula Market Volume (Billion) Forecast, by Application 2019 & 2032
- Table 17: Rest of North America Global Goat Milk Formula Market Revenue (Million) Forecast, by Application 2019 & 2032
- Table 18: Rest of North America Global Goat Milk Formula Market Volume (Billion) Forecast, by Application 2019 & 2032
- Table 19: Global Goat Milk Formula Market Revenue Million Forecast, by Distribution Channel 2019 & 2032
- Table 20: Global Goat Milk Formula Market Volume Billion Forecast, by Distribution Channel 2019 & 2032
- Table 21: Global Goat Milk Formula Market Revenue Million Forecast, by Country 2019 & 2032
- Table 22: Global Goat Milk Formula Market Volume Billion Forecast, by Country 2019 & 2032
- Table 23: Spain Global Goat Milk Formula Market Revenue (Million) Forecast, by Application 2019 & 2032
- Table 24: Spain Global Goat Milk Formula Market Volume (Billion) Forecast, by Application 2019 & 2032
- Table 25: United Kingdom Global Goat Milk Formula Market Revenue (Million) Forecast, by Application 2019 & 2032
- Table 26: United Kingdom Global Goat Milk Formula Market Volume (Billion) Forecast, by Application 2019 & 2032
- Table 27: France Global Goat Milk Formula Market Revenue (Million) Forecast, by Application 2019 & 2032
- Table 28: France Global Goat Milk Formula Market Volume (Billion) Forecast, by Application 2019 & 2032
- Table 29: Germany Global Goat Milk Formula Market Revenue (Million) Forecast, by Application 2019 & 2032
- Table 30: Germany Global Goat Milk Formula Market Volume (Billion) Forecast, by Application 2019 & 2032
- Table 31: Italy Global Goat Milk Formula Market Revenue (Million) Forecast, by Application 2019 & 2032
- Table 32: Italy Global Goat Milk Formula Market Volume (Billion) Forecast, by Application 2019 & 2032
- Table 33: Russia Global Goat Milk Formula Market Revenue (Million) Forecast, by Application 2019 & 2032
- Table 34: Russia Global Goat Milk Formula Market Volume (Billion) Forecast, by Application 2019 & 2032
- Table 35: Rest of Europe Global Goat Milk Formula Market Revenue (Million) Forecast, by Application 2019 & 2032
- Table 36: Rest of Europe Global Goat Milk Formula Market Volume (Billion) Forecast, by Application 2019 & 2032
- Table 37: Global Goat Milk Formula Market Revenue Million Forecast, by Distribution Channel 2019 & 2032
- Table 38: Global Goat Milk Formula Market Volume Billion Forecast, by Distribution Channel 2019 & 2032
- Table 39: Global Goat Milk Formula Market Revenue Million Forecast, by Country 2019 & 2032
- Table 40: Global Goat Milk Formula Market Volume Billion Forecast, by Country 2019 & 2032
- Table 41: China Global Goat Milk Formula Market Revenue (Million) Forecast, by Application 2019 & 2032
- Table 42: China Global Goat Milk Formula Market Volume (Billion) Forecast, by Application 2019 & 2032
- Table 43: Japan Global Goat Milk Formula Market Revenue (Million) Forecast, by Application 2019 & 2032
- Table 44: Japan Global Goat Milk Formula Market Volume (Billion) Forecast, by Application 2019 & 2032
- Table 45: India Global Goat Milk Formula Market Revenue (Million) Forecast, by Application 2019 & 2032
- Table 46: India Global Goat Milk Formula Market Volume (Billion) Forecast, by Application 2019 & 2032
- Table 47: Australia Global Goat Milk Formula Market Revenue (Million) Forecast, by Application 2019 & 2032
- Table 48: Australia Global Goat Milk Formula Market Volume (Billion) Forecast, by Application 2019 & 2032
- Table 49: Rest of Asia Pacific Global Goat Milk Formula Market Revenue (Million) Forecast, by Application 2019 & 2032
- Table 50: Rest of Asia Pacific Global Goat Milk Formula Market Volume (Billion) Forecast, by Application 2019 & 2032
- Table 51: Global Goat Milk Formula Market Revenue Million Forecast, by Distribution Channel 2019 & 2032
- Table 52: Global Goat Milk Formula Market Volume Billion Forecast, by Distribution Channel 2019 & 2032
- Table 53: Global Goat Milk Formula Market Revenue Million Forecast, by Country 2019 & 2032
- Table 54: Global Goat Milk Formula Market Volume Billion Forecast, by Country 2019 & 2032
- Table 55: Brazil Global Goat Milk Formula Market Revenue (Million) Forecast, by Application 2019 & 2032
- Table 56: Brazil Global Goat Milk Formula Market Volume (Billion) Forecast, by Application 2019 & 2032
- Table 57: Argentina Global Goat Milk Formula Market Revenue (Million) Forecast, by Application 2019 & 2032
- Table 58: Argentina Global Goat Milk Formula Market Volume (Billion) Forecast, by Application 2019 & 2032
- Table 59: Rest of South America Global Goat Milk Formula Market Revenue (Million) Forecast, by Application 2019 & 2032
- Table 60: Rest of South America Global Goat Milk Formula Market Volume (Billion) Forecast, by Application 2019 & 2032
- Table 61: Global Goat Milk Formula Market Revenue Million Forecast, by Distribution Channel 2019 & 2032
- Table 62: Global Goat Milk Formula Market Volume Billion Forecast, by Distribution Channel 2019 & 2032
- Table 63: Global Goat Milk Formula Market Revenue Million Forecast, by Country 2019 & 2032
- Table 64: Global Goat Milk Formula Market Volume Billion Forecast, by Country 2019 & 2032
- Table 65: South Africa Global Goat Milk Formula Market Revenue (Million) Forecast, by Application 2019 & 2032
- Table 66: South Africa Global Goat Milk Formula Market Volume (Billion) Forecast, by Application 2019 & 2032
- Table 67: Saudi Arabia Global Goat Milk Formula Market Revenue (Million) Forecast, by Application 2019 & 2032
- Table 68: Saudi Arabia Global Goat Milk Formula Market Volume (Billion) Forecast, by Application 2019 & 2032
- Table 69: Rest of Middle East and Africa Global Goat Milk Formula Market Revenue (Million) Forecast, by Application 2019 & 2032
- Table 70: Rest of Middle East and Africa Global Goat Milk Formula Market Volume (Billion) Forecast, by Application 2019 & 2032
Frequently Asked Questions
1. What is the projected Compound Annual Growth Rate (CAGR) of the Global Goat Milk Formula Market?
The projected CAGR is approximately 14.86%.
2. Which companies are prominent players in the Global Goat Milk Formula Market?
Key companies in the market include Dana Dairy Group, Ausnutria BV, Unica Global BV, Nannycare Ltd, Holle baby food AG, Pure Goat Company, Loulouka, Danone SA, Biostime Nutrition, The LittleOak Company*List Not Exhaustive.
3. What are the main segments of the Global Goat Milk Formula Market?
The market segments include Distribution Channel.
4. Can you provide details about the market size?
The market size is estimated to be USD 5.17 Million as of 2022.
5. What are some drivers contributing to market growth?
Health Benefits Associated with The Consumption of Goat Milk in Infants and Children; Surging Demand for Clean-label and Organic Products.
6. What are the notable trends driving market growth?
Online Retail Channels are Projected to be the Fastest-growing Distribution Channel.
7. Are there any restraints impacting market growth?
Health Benefits Associated with The Consumption of Goat Milk in Infants and Children; Surging Demand for Clean-label and Organic Products.
8. Can you provide examples of recent developments in the market?
January 2024: Kabrita officially unveiled the first and only long-term FDA-authorized goat milk-based infant formula in the United States. The long-term FDA authorization ensures consistent product availability, assuring parents of the permanence of the infant formula in the US market.
9. What pricing options are available for accessing the report?
Pricing options include single-user, multi-user, and enterprise licenses priced at USD 4750, USD 5250, and USD 8750 respectively.
10. Is the market size provided in terms of value or volume?
The market size is provided in terms of value, measured in Million and volume, measured in Billion.
11. Are there any specific market keywords associated with the report?
Yes, the market keyword associated with the report is "Global Goat Milk Formula Market," which aids in identifying and referencing the specific market segment covered.
12. How do I determine which pricing option suits my needs best?
The pricing options vary based on user requirements and access needs. Individual users may opt for single-user licenses, while businesses requiring broader access may choose multi-user or enterprise licenses for cost-effective access to the report.
13. Are there any additional resources or data provided in the Global Goat Milk Formula Market report?
While the report offers comprehensive insights, it's advisable to review the specific contents or supplementary materials provided to ascertain if additional resources or data are available.
14. How can I stay updated on further developments or reports in the Global Goat Milk Formula Market?
To stay informed about further developments, trends, and reports in the Global Goat Milk Formula Market, consider subscribing to industry newsletters, following relevant companies and organizations, or regularly checking reputable industry news sources and publications.
Methodology
Step 1 - Identification of Relevant Samples Size from Population Database


Step 2 - Approaches for Defining Global Market Size (Value, Volume* & Price*)

Note*: In applicable scenarios
Step 3 - Data Sources
Primary Research
- Web Analytics
- Survey Reports
- Research Institute
- Latest Research Reports
- Opinion Leaders
Secondary Research
- Annual Reports
- White Paper
- Latest Press Release
- Industry Association
- Paid Database
- Investor Presentations

Step 4 - Data Triangulation
Involves using different sources of information in order to increase the validity of a study
These sources are likely to be stakeholders in a program - participants, other researchers, program staff, other community members, and so on.
Then we put all data in single framework & apply various statistical tools to find out the dynamic on the market.
During the analysis stage, feedback from the stakeholder groups would be compared to determine areas of agreement as well as areas of divergence


