
Key Insights
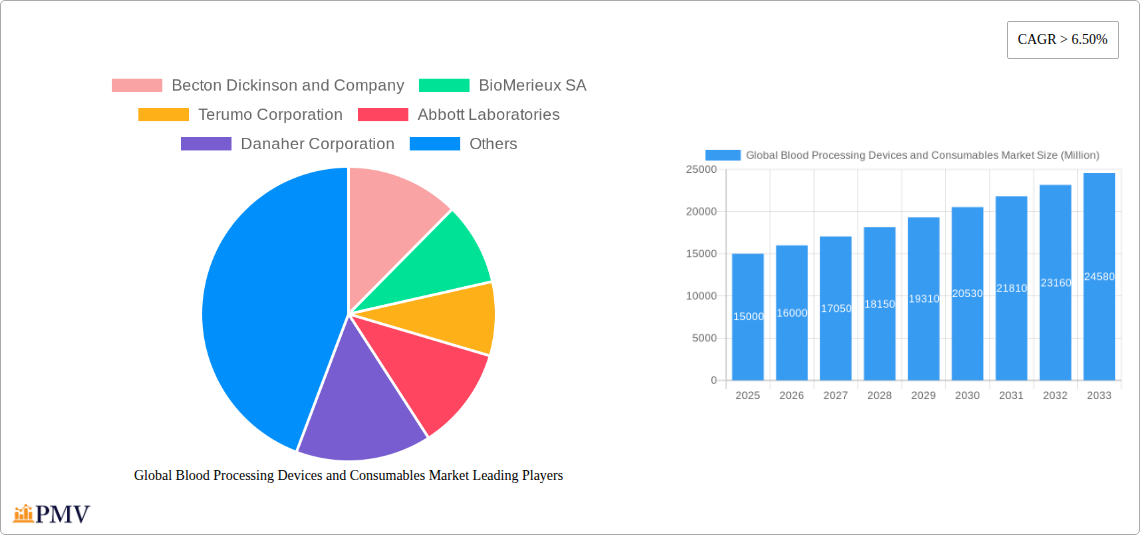
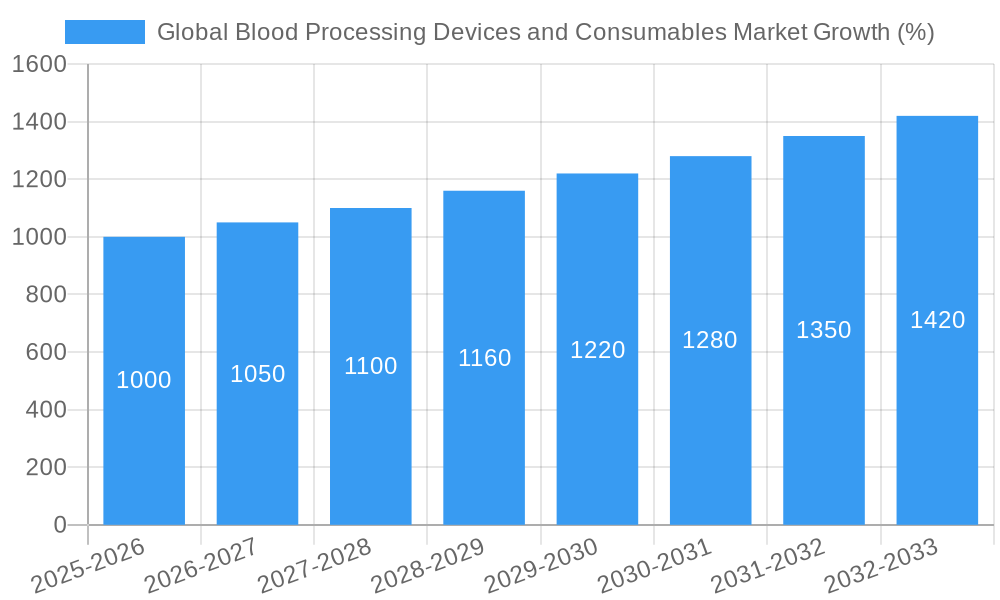
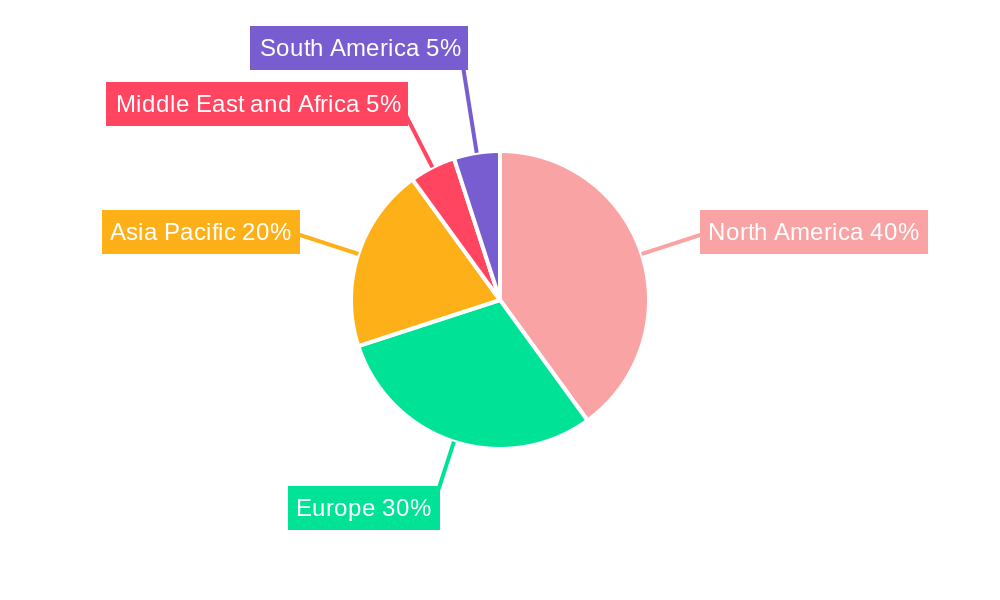
The global blood processing devices and consumables market is experiencing robust growth, projected to maintain a Compound Annual Growth Rate (CAGR) exceeding 6.50% from 2025 to 2033. This expansion is fueled by several key factors. Firstly, the rising prevalence of chronic diseases like cardiovascular ailments and blood-related disorders necessitates increased blood processing procedures, driving demand for advanced devices and consumables. Technological advancements, such as the development of automated systems and improved diagnostic tools, are enhancing efficiency and accuracy in blood processing, further stimulating market growth. Moreover, the increasing number of blood transfusions and the growing adoption of point-of-care testing are contributing to market expansion. The market is segmented by product type (devices and consumables) and end-user (hospitals and clinics, diagnostic laboratories, and other end-users). Hospitals and clinics currently constitute the largest segment due to the high volume of blood processing activities performed in these settings. However, the diagnostic laboratory segment is witnessing rapid growth due to the increasing demand for accurate and timely blood testing. Leading market players, including Becton Dickinson, BioMerieux, Terumo, Abbott Laboratories, and others, are investing heavily in research and development to introduce innovative products and expand their market share. Geographic distribution reveals a strong market presence in North America and Europe, driven by advanced healthcare infrastructure and high healthcare expenditure. However, the Asia-Pacific region is expected to witness significant growth in the coming years due to rising healthcare awareness, increasing disposable incomes, and expanding healthcare infrastructure.
The market's growth is not without challenges. Regulatory hurdles related to device approvals and stringent quality control standards can impede market expansion. Furthermore, the high cost of advanced blood processing devices and consumables can limit accessibility in low- and middle-income countries. Nevertheless, the overall outlook for the global blood processing devices and consumables market remains highly positive, with substantial growth potential driven by technological advancements, increasing disease prevalence, and growing healthcare spending globally. The competitive landscape is dynamic, with established players continuously innovating and smaller companies entering the market with specialized solutions. This dynamic environment ensures that the market continues its trajectory of growth and expansion, providing opportunities for both established players and new entrants.
Global Blood Processing Devices and Consumables Market: A Comprehensive Report (2019-2033)
This comprehensive report provides an in-depth analysis of the global blood processing devices and consumables market, offering invaluable insights for stakeholders across the healthcare industry. The study period spans from 2019 to 2033, with 2025 serving as the base and estimated year. The forecast period covers 2025-2033, and the historical period encompasses 2019-2024. The market is segmented by product (devices and consumables) and end-user (hospitals and clinics, diagnostic laboratories, and other end-users). Key players like Becton Dickinson and Company, BioMerieux SA, Terumo Corporation, and Abbott Laboratories are thoroughly examined. The report projects a market size of xx Million by 2033, with a CAGR of xx% during the forecast period.
Global Blood Processing Devices and Consumables Market Market Structure & Competitive Dynamics
The global blood processing devices and consumables market exhibits a moderately concentrated structure, with several multinational corporations holding significant market share. Becton Dickinson and Company, Abbott Laboratories, and Danaher Corporation are among the leading players, consistently investing in research and development to maintain their competitive edge. The market is characterized by a dynamic innovation ecosystem, driven by advancements in automation, miniaturization, and point-of-care diagnostics. Stringent regulatory frameworks, particularly regarding safety and efficacy, influence market entry and product development. Substitutes are limited, primarily consisting of manual blood processing techniques, which are gradually being replaced by automated systems. End-user trends favor increased adoption of automated and efficient blood processing solutions to enhance diagnostic accuracy and improve workflow efficiency.
Mergers and acquisitions (M&A) activity has been significant, with deal values exceeding xx Million in recent years. These activities often involve companies seeking to expand their product portfolios, enhance their technological capabilities, or gain access to new markets.
- Market Concentration: Moderately concentrated, with top 5 players holding approximately xx% market share.
- M&A Activity: Significant, with total deal value exceeding xx Million in the last 5 years. Examples include [Insert specific M&A examples if available, otherwise state "Examples unavailable"].
- Innovation: Driven by automation, miniaturization, and point-of-care technologies.
- Regulatory Landscape: Stringent regulations regarding safety and efficacy.
Global Blood Processing Devices and Consumables Market Industry Trends & Insights
The global blood processing devices and consumables market is experiencing robust growth, primarily driven by the rising prevalence of chronic diseases, increasing demand for accurate and timely diagnostics, and technological advancements leading to improved efficiency and automation in blood processing. The market is characterized by a growing adoption of advanced technologies such as automated blood collection systems, sophisticated analyzers, and innovative consumables designed to optimize sample handling and minimize errors. The increasing focus on point-of-care diagnostics is further driving market growth, allowing for faster turnaround times and improved patient outcomes. Consumer preferences are shifting towards more convenient, user-friendly, and minimally invasive blood collection methods, leading to innovation in areas such as self-collection devices and microfluidic systems. Competitive dynamics remain intense, with established players and emerging companies vying for market share through product innovation, strategic partnerships, and acquisitions. The projected CAGR for the market is xx%, reflecting strong market penetration rates, particularly in developed economies.
Dominant Markets & Segments in Global Blood Processing Devices and Consumables Market
The North American region currently holds the largest market share, driven by factors including robust healthcare infrastructure, high adoption rates of advanced technologies, and favorable regulatory frameworks. Within this region, the United States stands out as the dominant market. However, emerging economies in Asia-Pacific and Latin America are exhibiting rapid growth, fueled by increasing healthcare spending, rising prevalence of infectious diseases, and government initiatives aimed at improving healthcare infrastructure.
- Dominant Region: North America (United States)
- Key Drivers (North America): High healthcare expenditure, advanced healthcare infrastructure, stringent regulatory framework leading to high-quality product adoption.
- Key Drivers (Asia-Pacific): Rising healthcare expenditure, increasing prevalence of chronic diseases, government initiatives to improve healthcare infrastructure.
Product Segmentation:
- Devices: This segment holds a larger market share due to the increasing demand for automated systems and advanced technologies. Market growth is driven by the need for enhanced efficiency and accuracy in blood processing.
- Consumables: This segment is expected to witness steady growth due to consistent demand for reagents, testing kits, and other related supplies. Growth is largely driven by increasing testing volumes.
End-User Segmentation:
- Hospitals and Clinics: This segment remains the largest end-user segment, owing to the high volume of blood tests conducted in these settings.
- Diagnostic Laboratories: This segment is experiencing growth due to an increased demand for specialized testing services.
- Other End-Users: This segment includes smaller clinics, blood banks, and research institutions. Growth in this segment is driven by the increased focus on research and personalized medicine.
Global Blood Processing Devices and Consumables Market Product Innovations
Recent years have witnessed significant advancements in blood processing technologies, focusing on automation, miniaturization, and improved sample handling. New devices incorporate advanced features like integrated barcoding, automated centrifugation, and automated sample tracking, improving efficiency and reducing human error. The development of point-of-care devices enables rapid and accurate diagnostics in various settings, including remote areas and resource-limited environments. These innovations offer significant competitive advantages, allowing companies to differentiate their offerings and cater to the growing demand for faster, more efficient, and cost-effective blood processing solutions.
Report Segmentation & Scope
This report comprehensively segments the global blood processing devices and consumables market based on product type (devices and consumables) and end-user (hospitals and clinics, diagnostic laboratories, and other end-users). Each segment's growth projections, market size, and competitive dynamics are detailed. The analysis encompasses historical data (2019-2024), current estimations (2025), and future forecasts (2025-2033), providing a holistic understanding of market trends. The report further assesses market drivers, challenges, and opportunities to present a robust overview of the industry landscape.
Key Drivers of Global Blood Processing Devices and Consumables Market Growth
The market's growth is fueled by several factors, including the rising prevalence of chronic diseases requiring frequent blood testing, technological advancements leading to more efficient and accurate blood processing techniques, the increasing demand for point-of-care diagnostics, and government initiatives supporting healthcare infrastructure development. These factors, along with increasing healthcare expenditure globally, are creating significant growth opportunities for market players.
Challenges in the Global Blood Processing Devices and Consumables Market Sector
Despite significant growth potential, the market faces challenges including stringent regulatory approvals impacting time-to-market for new products, fluctuating raw material prices impacting manufacturing costs, and intense competition among established players and emerging companies. Supply chain disruptions and skilled labor shortages also pose significant hurdles, impacting operational efficiency and product availability.
Leading Players in the Global Blood Processing Devices and Consumables Market Market
- Becton Dickinson and Company
- BioMerieux SA
- Terumo Corporation
- Abbott Laboratories
- Danaher Corporation
- Roche Holdings AG
- Bio-Rad Laboratories
- Haemonetics Corporation
- Immucor Inc
- Grifols International
- Thermogenesis Corporation
- Macopharma SA
- Beurer GmbH
Key Developments in Global Blood Processing Devices and Consumables Market Sector
- July 2022: Rhinostics launched the patent-pending VERIstic Collection Device for small-volume blood collection, marking a significant advancement in automated sample collection technology.
- May 2022: Vitestro launched an autonomous blood collection device, empowering patients with self-efficacy in blood collection procedures.
Strategic Global Blood Processing Devices and Consumables Market Market Outlook
The future of the global blood processing devices and consumables market appears promising, driven by sustained demand for advanced diagnostic tools, technological advancements, and increasing healthcare expenditure. Strategic opportunities exist for companies focusing on point-of-care diagnostics, miniaturized devices, and innovative consumables designed to improve efficiency and reduce costs. Companies prioritizing research and development, strategic partnerships, and expansion into emerging markets are poised to capitalize on the significant growth potential of this dynamic sector.
Global Blood Processing Devices and Consumables Market Segmentation
-
1. Product
-
1.1. By Blood Processing Devices
- 1.1.1. Blood Bank Freezers
- 1.1.2. Blood Grouping Analyzers
- 1.1.3. Blood Warmer
- 1.1.4. Blood Cell Processers
- 1.1.5. Other Blood Processing Devices
-
1.2. By Blood Processing Consumables
- 1.2.1. Blood Bags
- 1.2.2. Blood Lancets
- 1.2.3. Vials
- 1.2.4. Blood Administration Sets
- 1.2.5. Other Blood Processing Consumables
-
1.1. By Blood Processing Devices
-
2. End User
- 2.1. Hospitals and Clinics
- 2.2. Diagnostic Laboratories
- 2.3. Other End Users
Global Blood Processing Devices and Consumables Market Segmentation By Geography
-
1. North America
- 1.1. United States
- 1.2. Canada
- 1.3. Mexico
-
2. Europe
- 2.1. Germany
- 2.2. United Kingdom
- 2.3. France
- 2.4. Italy
- 2.5. Spain
- 2.6. Rest of Europe
-
3. Asia Pacific
- 3.1. China
- 3.2. Japan
- 3.3. India
- 3.4. Australia
- 3.5. South Korea
- 3.6. Rest of Asia Pacific
-
4. Middle East and Africa
- 4.1. GCC
- 4.2. South Africa
- 4.3. Rest of Middle East and Africa
-
5. South America
- 5.1. Brazil
- 5.2. Argentina
- 5.3. Rest of South America
Global Blood Processing Devices and Consumables Market REPORT HIGHLIGHTS
| Aspects | Details |
|---|---|
| Study Period | 2019-2033 |
| Base Year | 2024 |
| Estimated Year | 2025 |
| Forecast Period | 2025-2033 |
| Historical Period | 2019-2024 |
| Growth Rate | CAGR of > 6.50% from 2019-2033 |
| Segmentation |
|
Table of Contents
- 1. Introduction
- 1.1. Research Scope
- 1.2. Market Segmentation
- 1.3. Research Methodology
- 1.4. Definitions and Assumptions
- 2. Executive Summary
- 2.1. Introduction
- 3. Market Dynamics
- 3.1. Introduction
- 3.2. Market Drivers
- 3.2.1. Rising Prevenlance of Infectious Disorders Involving Blood Transfusions and Surgical Treatment; Growing Number of Initiatives in Regenerative Medicine and Cell Therapies; Increasing Geriatric Population
- 3.3. Market Restrains
- 3.3.1. Stringent Regulations; High Cost of Blood Processing Devices
- 3.4. Market Trends
- 3.4.1. Blood Cell Processors Segment is Expected to Hold a Major Market Share in the Blood Processing Devices and Consumables Market
- 4. Market Factor Analysis
- 4.1. Porters Five Forces
- 4.2. Supply/Value Chain
- 4.3. PESTEL analysis
- 4.4. Market Entropy
- 4.5. Patent/Trademark Analysis
- 5. Global Blood Processing Devices and Consumables Market Analysis, Insights and Forecast, 2019-2031
- 5.1. Market Analysis, Insights and Forecast - by Product
- 5.1.1. By Blood Processing Devices
- 5.1.1.1. Blood Bank Freezers
- 5.1.1.2. Blood Grouping Analyzers
- 5.1.1.3. Blood Warmer
- 5.1.1.4. Blood Cell Processers
- 5.1.1.5. Other Blood Processing Devices
- 5.1.2. By Blood Processing Consumables
- 5.1.2.1. Blood Bags
- 5.1.2.2. Blood Lancets
- 5.1.2.3. Vials
- 5.1.2.4. Blood Administration Sets
- 5.1.2.5. Other Blood Processing Consumables
- 5.1.1. By Blood Processing Devices
- 5.2. Market Analysis, Insights and Forecast - by End User
- 5.2.1. Hospitals and Clinics
- 5.2.2. Diagnostic Laboratories
- 5.2.3. Other End Users
- 5.3. Market Analysis, Insights and Forecast - by Region
- 5.3.1. North America
- 5.3.2. Europe
- 5.3.3. Asia Pacific
- 5.3.4. Middle East and Africa
- 5.3.5. South America
- 5.1. Market Analysis, Insights and Forecast - by Product
- 6. North America Global Blood Processing Devices and Consumables Market Analysis, Insights and Forecast, 2019-2031
- 6.1. Market Analysis, Insights and Forecast - by Product
- 6.1.1. By Blood Processing Devices
- 6.1.1.1. Blood Bank Freezers
- 6.1.1.2. Blood Grouping Analyzers
- 6.1.1.3. Blood Warmer
- 6.1.1.4. Blood Cell Processers
- 6.1.1.5. Other Blood Processing Devices
- 6.1.2. By Blood Processing Consumables
- 6.1.2.1. Blood Bags
- 6.1.2.2. Blood Lancets
- 6.1.2.3. Vials
- 6.1.2.4. Blood Administration Sets
- 6.1.2.5. Other Blood Processing Consumables
- 6.1.1. By Blood Processing Devices
- 6.2. Market Analysis, Insights and Forecast - by End User
- 6.2.1. Hospitals and Clinics
- 6.2.2. Diagnostic Laboratories
- 6.2.3. Other End Users
- 6.1. Market Analysis, Insights and Forecast - by Product
- 7. Europe Global Blood Processing Devices and Consumables Market Analysis, Insights and Forecast, 2019-2031
- 7.1. Market Analysis, Insights and Forecast - by Product
- 7.1.1. By Blood Processing Devices
- 7.1.1.1. Blood Bank Freezers
- 7.1.1.2. Blood Grouping Analyzers
- 7.1.1.3. Blood Warmer
- 7.1.1.4. Blood Cell Processers
- 7.1.1.5. Other Blood Processing Devices
- 7.1.2. By Blood Processing Consumables
- 7.1.2.1. Blood Bags
- 7.1.2.2. Blood Lancets
- 7.1.2.3. Vials
- 7.1.2.4. Blood Administration Sets
- 7.1.2.5. Other Blood Processing Consumables
- 7.1.1. By Blood Processing Devices
- 7.2. Market Analysis, Insights and Forecast - by End User
- 7.2.1. Hospitals and Clinics
- 7.2.2. Diagnostic Laboratories
- 7.2.3. Other End Users
- 7.1. Market Analysis, Insights and Forecast - by Product
- 8. Asia Pacific Global Blood Processing Devices and Consumables Market Analysis, Insights and Forecast, 2019-2031
- 8.1. Market Analysis, Insights and Forecast - by Product
- 8.1.1. By Blood Processing Devices
- 8.1.1.1. Blood Bank Freezers
- 8.1.1.2. Blood Grouping Analyzers
- 8.1.1.3. Blood Warmer
- 8.1.1.4. Blood Cell Processers
- 8.1.1.5. Other Blood Processing Devices
- 8.1.2. By Blood Processing Consumables
- 8.1.2.1. Blood Bags
- 8.1.2.2. Blood Lancets
- 8.1.2.3. Vials
- 8.1.2.4. Blood Administration Sets
- 8.1.2.5. Other Blood Processing Consumables
- 8.1.1. By Blood Processing Devices
- 8.2. Market Analysis, Insights and Forecast - by End User
- 8.2.1. Hospitals and Clinics
- 8.2.2. Diagnostic Laboratories
- 8.2.3. Other End Users
- 8.1. Market Analysis, Insights and Forecast - by Product
- 9. Middle East and Africa Global Blood Processing Devices and Consumables Market Analysis, Insights and Forecast, 2019-2031
- 9.1. Market Analysis, Insights and Forecast - by Product
- 9.1.1. By Blood Processing Devices
- 9.1.1.1. Blood Bank Freezers
- 9.1.1.2. Blood Grouping Analyzers
- 9.1.1.3. Blood Warmer
- 9.1.1.4. Blood Cell Processers
- 9.1.1.5. Other Blood Processing Devices
- 9.1.2. By Blood Processing Consumables
- 9.1.2.1. Blood Bags
- 9.1.2.2. Blood Lancets
- 9.1.2.3. Vials
- 9.1.2.4. Blood Administration Sets
- 9.1.2.5. Other Blood Processing Consumables
- 9.1.1. By Blood Processing Devices
- 9.2. Market Analysis, Insights and Forecast - by End User
- 9.2.1. Hospitals and Clinics
- 9.2.2. Diagnostic Laboratories
- 9.2.3. Other End Users
- 9.1. Market Analysis, Insights and Forecast - by Product
- 10. South America Global Blood Processing Devices and Consumables Market Analysis, Insights and Forecast, 2019-2031
- 10.1. Market Analysis, Insights and Forecast - by Product
- 10.1.1. By Blood Processing Devices
- 10.1.1.1. Blood Bank Freezers
- 10.1.1.2. Blood Grouping Analyzers
- 10.1.1.3. Blood Warmer
- 10.1.1.4. Blood Cell Processers
- 10.1.1.5. Other Blood Processing Devices
- 10.1.2. By Blood Processing Consumables
- 10.1.2.1. Blood Bags
- 10.1.2.2. Blood Lancets
- 10.1.2.3. Vials
- 10.1.2.4. Blood Administration Sets
- 10.1.2.5. Other Blood Processing Consumables
- 10.1.1. By Blood Processing Devices
- 10.2. Market Analysis, Insights and Forecast - by End User
- 10.2.1. Hospitals and Clinics
- 10.2.2. Diagnostic Laboratories
- 10.2.3. Other End Users
- 10.1. Market Analysis, Insights and Forecast - by Product
- 11. North America Global Blood Processing Devices and Consumables Market Analysis, Insights and Forecast, 2019-2031
- 11.1. Market Analysis, Insights and Forecast - By Country/Sub-region
- 11.1.1 United States
- 11.1.2 Canada
- 11.1.3 Mexico
- 12. Europe Global Blood Processing Devices and Consumables Market Analysis, Insights and Forecast, 2019-2031
- 12.1. Market Analysis, Insights and Forecast - By Country/Sub-region
- 12.1.1 Germany
- 12.1.2 United Kingdom
- 12.1.3 France
- 12.1.4 Italy
- 12.1.5 Spain
- 12.1.6 Rest of Europe
- 13. Asia Pacific Global Blood Processing Devices and Consumables Market Analysis, Insights and Forecast, 2019-2031
- 13.1. Market Analysis, Insights and Forecast - By Country/Sub-region
- 13.1.1 China
- 13.1.2 Japan
- 13.1.3 India
- 13.1.4 Australia
- 13.1.5 South Korea
- 13.1.6 Rest of Asia Pacific
- 14. Middle East and Africa Global Blood Processing Devices and Consumables Market Analysis, Insights and Forecast, 2019-2031
- 14.1. Market Analysis, Insights and Forecast - By Country/Sub-region
- 14.1.1 GCC
- 14.1.2 South Africa
- 14.1.3 Rest of Middle East and Africa
- 15. South America Global Blood Processing Devices and Consumables Market Analysis, Insights and Forecast, 2019-2031
- 15.1. Market Analysis, Insights and Forecast - By Country/Sub-region
- 15.1.1 Brazil
- 15.1.2 Argentina
- 15.1.3 Rest of South America
- 16. Competitive Analysis
- 16.1. Market Share Analysis 2024
- 16.2. Company Profiles
- 16.2.1 Becton Dickinson and Company
- 16.2.1.1. Overview
- 16.2.1.2. Products
- 16.2.1.3. SWOT Analysis
- 16.2.1.4. Recent Developments
- 16.2.1.5. Financials (Based on Availability)
- 16.2.2 BioMerieux SA
- 16.2.2.1. Overview
- 16.2.2.2. Products
- 16.2.2.3. SWOT Analysis
- 16.2.2.4. Recent Developments
- 16.2.2.5. Financials (Based on Availability)
- 16.2.3 Terumo Corporation
- 16.2.3.1. Overview
- 16.2.3.2. Products
- 16.2.3.3. SWOT Analysis
- 16.2.3.4. Recent Developments
- 16.2.3.5. Financials (Based on Availability)
- 16.2.4 Abbott Laboratories
- 16.2.4.1. Overview
- 16.2.4.2. Products
- 16.2.4.3. SWOT Analysis
- 16.2.4.4. Recent Developments
- 16.2.4.5. Financials (Based on Availability)
- 16.2.5 Danaher Corporation
- 16.2.5.1. Overview
- 16.2.5.2. Products
- 16.2.5.3. SWOT Analysis
- 16.2.5.4. Recent Developments
- 16.2.5.5. Financials (Based on Availability)
- 16.2.6 Roche Holdings AG
- 16.2.6.1. Overview
- 16.2.6.2. Products
- 16.2.6.3. SWOT Analysis
- 16.2.6.4. Recent Developments
- 16.2.6.5. Financials (Based on Availability)
- 16.2.7 Bio-Rad Laboratories
- 16.2.7.1. Overview
- 16.2.7.2. Products
- 16.2.7.3. SWOT Analysis
- 16.2.7.4. Recent Developments
- 16.2.7.5. Financials (Based on Availability)
- 16.2.8 Haemonetics Corporation
- 16.2.8.1. Overview
- 16.2.8.2. Products
- 16.2.8.3. SWOT Analysis
- 16.2.8.4. Recent Developments
- 16.2.8.5. Financials (Based on Availability)
- 16.2.9 Immucor Inc
- 16.2.9.1. Overview
- 16.2.9.2. Products
- 16.2.9.3. SWOT Analysis
- 16.2.9.4. Recent Developments
- 16.2.9.5. Financials (Based on Availability)
- 16.2.10 Grifols International
- 16.2.10.1. Overview
- 16.2.10.2. Products
- 16.2.10.3. SWOT Analysis
- 16.2.10.4. Recent Developments
- 16.2.10.5. Financials (Based on Availability)
- 16.2.11 Thermogenesis Corporation
- 16.2.11.1. Overview
- 16.2.11.2. Products
- 16.2.11.3. SWOT Analysis
- 16.2.11.4. Recent Developments
- 16.2.11.5. Financials (Based on Availability)
- 16.2.12 Macopharma SA Beurer GmbH
- 16.2.12.1. Overview
- 16.2.12.2. Products
- 16.2.12.3. SWOT Analysis
- 16.2.12.4. Recent Developments
- 16.2.12.5. Financials (Based on Availability)
- 16.2.1 Becton Dickinson and Company
List of Figures
- Figure 1: Global Global Blood Processing Devices and Consumables Market Revenue Breakdown (Million, %) by Region 2024 & 2032
- Figure 2: Global Global Blood Processing Devices and Consumables Market Volume Breakdown (K Units, %) by Region 2024 & 2032
- Figure 3: North America Global Blood Processing Devices and Consumables Market Revenue (Million), by Country 2024 & 2032
- Figure 4: North America Global Blood Processing Devices and Consumables Market Volume (K Units), by Country 2024 & 2032
- Figure 5: North America Global Blood Processing Devices and Consumables Market Revenue Share (%), by Country 2024 & 2032
- Figure 6: North America Global Blood Processing Devices and Consumables Market Volume Share (%), by Country 2024 & 2032
- Figure 7: Europe Global Blood Processing Devices and Consumables Market Revenue (Million), by Country 2024 & 2032
- Figure 8: Europe Global Blood Processing Devices and Consumables Market Volume (K Units), by Country 2024 & 2032
- Figure 9: Europe Global Blood Processing Devices and Consumables Market Revenue Share (%), by Country 2024 & 2032
- Figure 10: Europe Global Blood Processing Devices and Consumables Market Volume Share (%), by Country 2024 & 2032
- Figure 11: Asia Pacific Global Blood Processing Devices and Consumables Market Revenue (Million), by Country 2024 & 2032
- Figure 12: Asia Pacific Global Blood Processing Devices and Consumables Market Volume (K Units), by Country 2024 & 2032
- Figure 13: Asia Pacific Global Blood Processing Devices and Consumables Market Revenue Share (%), by Country 2024 & 2032
- Figure 14: Asia Pacific Global Blood Processing Devices and Consumables Market Volume Share (%), by Country 2024 & 2032
- Figure 15: Middle East and Africa Global Blood Processing Devices and Consumables Market Revenue (Million), by Country 2024 & 2032
- Figure 16: Middle East and Africa Global Blood Processing Devices and Consumables Market Volume (K Units), by Country 2024 & 2032
- Figure 17: Middle East and Africa Global Blood Processing Devices and Consumables Market Revenue Share (%), by Country 2024 & 2032
- Figure 18: Middle East and Africa Global Blood Processing Devices and Consumables Market Volume Share (%), by Country 2024 & 2032
- Figure 19: South America Global Blood Processing Devices and Consumables Market Revenue (Million), by Country 2024 & 2032
- Figure 20: South America Global Blood Processing Devices and Consumables Market Volume (K Units), by Country 2024 & 2032
- Figure 21: South America Global Blood Processing Devices and Consumables Market Revenue Share (%), by Country 2024 & 2032
- Figure 22: South America Global Blood Processing Devices and Consumables Market Volume Share (%), by Country 2024 & 2032
- Figure 23: North America Global Blood Processing Devices and Consumables Market Revenue (Million), by Product 2024 & 2032
- Figure 24: North America Global Blood Processing Devices and Consumables Market Volume (K Units), by Product 2024 & 2032
- Figure 25: North America Global Blood Processing Devices and Consumables Market Revenue Share (%), by Product 2024 & 2032
- Figure 26: North America Global Blood Processing Devices and Consumables Market Volume Share (%), by Product 2024 & 2032
- Figure 27: North America Global Blood Processing Devices and Consumables Market Revenue (Million), by End User 2024 & 2032
- Figure 28: North America Global Blood Processing Devices and Consumables Market Volume (K Units), by End User 2024 & 2032
- Figure 29: North America Global Blood Processing Devices and Consumables Market Revenue Share (%), by End User 2024 & 2032
- Figure 30: North America Global Blood Processing Devices and Consumables Market Volume Share (%), by End User 2024 & 2032
- Figure 31: North America Global Blood Processing Devices and Consumables Market Revenue (Million), by Country 2024 & 2032
- Figure 32: North America Global Blood Processing Devices and Consumables Market Volume (K Units), by Country 2024 & 2032
- Figure 33: North America Global Blood Processing Devices and Consumables Market Revenue Share (%), by Country 2024 & 2032
- Figure 34: North America Global Blood Processing Devices and Consumables Market Volume Share (%), by Country 2024 & 2032
- Figure 35: Europe Global Blood Processing Devices and Consumables Market Revenue (Million), by Product 2024 & 2032
- Figure 36: Europe Global Blood Processing Devices and Consumables Market Volume (K Units), by Product 2024 & 2032
- Figure 37: Europe Global Blood Processing Devices and Consumables Market Revenue Share (%), by Product 2024 & 2032
- Figure 38: Europe Global Blood Processing Devices and Consumables Market Volume Share (%), by Product 2024 & 2032
- Figure 39: Europe Global Blood Processing Devices and Consumables Market Revenue (Million), by End User 2024 & 2032
- Figure 40: Europe Global Blood Processing Devices and Consumables Market Volume (K Units), by End User 2024 & 2032
- Figure 41: Europe Global Blood Processing Devices and Consumables Market Revenue Share (%), by End User 2024 & 2032
- Figure 42: Europe Global Blood Processing Devices and Consumables Market Volume Share (%), by End User 2024 & 2032
- Figure 43: Europe Global Blood Processing Devices and Consumables Market Revenue (Million), by Country 2024 & 2032
- Figure 44: Europe Global Blood Processing Devices and Consumables Market Volume (K Units), by Country 2024 & 2032
- Figure 45: Europe Global Blood Processing Devices and Consumables Market Revenue Share (%), by Country 2024 & 2032
- Figure 46: Europe Global Blood Processing Devices and Consumables Market Volume Share (%), by Country 2024 & 2032
- Figure 47: Asia Pacific Global Blood Processing Devices and Consumables Market Revenue (Million), by Product 2024 & 2032
- Figure 48: Asia Pacific Global Blood Processing Devices and Consumables Market Volume (K Units), by Product 2024 & 2032
- Figure 49: Asia Pacific Global Blood Processing Devices and Consumables Market Revenue Share (%), by Product 2024 & 2032
- Figure 50: Asia Pacific Global Blood Processing Devices and Consumables Market Volume Share (%), by Product 2024 & 2032
- Figure 51: Asia Pacific Global Blood Processing Devices and Consumables Market Revenue (Million), by End User 2024 & 2032
- Figure 52: Asia Pacific Global Blood Processing Devices and Consumables Market Volume (K Units), by End User 2024 & 2032
- Figure 53: Asia Pacific Global Blood Processing Devices and Consumables Market Revenue Share (%), by End User 2024 & 2032
- Figure 54: Asia Pacific Global Blood Processing Devices and Consumables Market Volume Share (%), by End User 2024 & 2032
- Figure 55: Asia Pacific Global Blood Processing Devices and Consumables Market Revenue (Million), by Country 2024 & 2032
- Figure 56: Asia Pacific Global Blood Processing Devices and Consumables Market Volume (K Units), by Country 2024 & 2032
- Figure 57: Asia Pacific Global Blood Processing Devices and Consumables Market Revenue Share (%), by Country 2024 & 2032
- Figure 58: Asia Pacific Global Blood Processing Devices and Consumables Market Volume Share (%), by Country 2024 & 2032
- Figure 59: Middle East and Africa Global Blood Processing Devices and Consumables Market Revenue (Million), by Product 2024 & 2032
- Figure 60: Middle East and Africa Global Blood Processing Devices and Consumables Market Volume (K Units), by Product 2024 & 2032
- Figure 61: Middle East and Africa Global Blood Processing Devices and Consumables Market Revenue Share (%), by Product 2024 & 2032
- Figure 62: Middle East and Africa Global Blood Processing Devices and Consumables Market Volume Share (%), by Product 2024 & 2032
- Figure 63: Middle East and Africa Global Blood Processing Devices and Consumables Market Revenue (Million), by End User 2024 & 2032
- Figure 64: Middle East and Africa Global Blood Processing Devices and Consumables Market Volume (K Units), by End User 2024 & 2032
- Figure 65: Middle East and Africa Global Blood Processing Devices and Consumables Market Revenue Share (%), by End User 2024 & 2032
- Figure 66: Middle East and Africa Global Blood Processing Devices and Consumables Market Volume Share (%), by End User 2024 & 2032
- Figure 67: Middle East and Africa Global Blood Processing Devices and Consumables Market Revenue (Million), by Country 2024 & 2032
- Figure 68: Middle East and Africa Global Blood Processing Devices and Consumables Market Volume (K Units), by Country 2024 & 2032
- Figure 69: Middle East and Africa Global Blood Processing Devices and Consumables Market Revenue Share (%), by Country 2024 & 2032
- Figure 70: Middle East and Africa Global Blood Processing Devices and Consumables Market Volume Share (%), by Country 2024 & 2032
- Figure 71: South America Global Blood Processing Devices and Consumables Market Revenue (Million), by Product 2024 & 2032
- Figure 72: South America Global Blood Processing Devices and Consumables Market Volume (K Units), by Product 2024 & 2032
- Figure 73: South America Global Blood Processing Devices and Consumables Market Revenue Share (%), by Product 2024 & 2032
- Figure 74: South America Global Blood Processing Devices and Consumables Market Volume Share (%), by Product 2024 & 2032
- Figure 75: South America Global Blood Processing Devices and Consumables Market Revenue (Million), by End User 2024 & 2032
- Figure 76: South America Global Blood Processing Devices and Consumables Market Volume (K Units), by End User 2024 & 2032
- Figure 77: South America Global Blood Processing Devices and Consumables Market Revenue Share (%), by End User 2024 & 2032
- Figure 78: South America Global Blood Processing Devices and Consumables Market Volume Share (%), by End User 2024 & 2032
- Figure 79: South America Global Blood Processing Devices and Consumables Market Revenue (Million), by Country 2024 & 2032
- Figure 80: South America Global Blood Processing Devices and Consumables Market Volume (K Units), by Country 2024 & 2032
- Figure 81: South America Global Blood Processing Devices and Consumables Market Revenue Share (%), by Country 2024 & 2032
- Figure 82: South America Global Blood Processing Devices and Consumables Market Volume Share (%), by Country 2024 & 2032
List of Tables
- Table 1: Global Blood Processing Devices and Consumables Market Revenue Million Forecast, by Region 2019 & 2032
- Table 2: Global Blood Processing Devices and Consumables Market Volume K Units Forecast, by Region 2019 & 2032
- Table 3: Global Blood Processing Devices and Consumables Market Revenue Million Forecast, by Product 2019 & 2032
- Table 4: Global Blood Processing Devices and Consumables Market Volume K Units Forecast, by Product 2019 & 2032
- Table 5: Global Blood Processing Devices and Consumables Market Revenue Million Forecast, by End User 2019 & 2032
- Table 6: Global Blood Processing Devices and Consumables Market Volume K Units Forecast, by End User 2019 & 2032
- Table 7: Global Blood Processing Devices and Consumables Market Revenue Million Forecast, by Region 2019 & 2032
- Table 8: Global Blood Processing Devices and Consumables Market Volume K Units Forecast, by Region 2019 & 2032
- Table 9: Global Blood Processing Devices and Consumables Market Revenue Million Forecast, by Country 2019 & 2032
- Table 10: Global Blood Processing Devices and Consumables Market Volume K Units Forecast, by Country 2019 & 2032
- Table 11: United States Global Blood Processing Devices and Consumables Market Revenue (Million) Forecast, by Application 2019 & 2032
- Table 12: United States Global Blood Processing Devices and Consumables Market Volume (K Units) Forecast, by Application 2019 & 2032
- Table 13: Canada Global Blood Processing Devices and Consumables Market Revenue (Million) Forecast, by Application 2019 & 2032
- Table 14: Canada Global Blood Processing Devices and Consumables Market Volume (K Units) Forecast, by Application 2019 & 2032
- Table 15: Mexico Global Blood Processing Devices and Consumables Market Revenue (Million) Forecast, by Application 2019 & 2032
- Table 16: Mexico Global Blood Processing Devices and Consumables Market Volume (K Units) Forecast, by Application 2019 & 2032
- Table 17: Global Blood Processing Devices and Consumables Market Revenue Million Forecast, by Country 2019 & 2032
- Table 18: Global Blood Processing Devices and Consumables Market Volume K Units Forecast, by Country 2019 & 2032
- Table 19: Germany Global Blood Processing Devices and Consumables Market Revenue (Million) Forecast, by Application 2019 & 2032
- Table 20: Germany Global Blood Processing Devices and Consumables Market Volume (K Units) Forecast, by Application 2019 & 2032
- Table 21: United Kingdom Global Blood Processing Devices and Consumables Market Revenue (Million) Forecast, by Application 2019 & 2032
- Table 22: United Kingdom Global Blood Processing Devices and Consumables Market Volume (K Units) Forecast, by Application 2019 & 2032
- Table 23: France Global Blood Processing Devices and Consumables Market Revenue (Million) Forecast, by Application 2019 & 2032
- Table 24: France Global Blood Processing Devices and Consumables Market Volume (K Units) Forecast, by Application 2019 & 2032
- Table 25: Italy Global Blood Processing Devices and Consumables Market Revenue (Million) Forecast, by Application 2019 & 2032
- Table 26: Italy Global Blood Processing Devices and Consumables Market Volume (K Units) Forecast, by Application 2019 & 2032
- Table 27: Spain Global Blood Processing Devices and Consumables Market Revenue (Million) Forecast, by Application 2019 & 2032
- Table 28: Spain Global Blood Processing Devices and Consumables Market Volume (K Units) Forecast, by Application 2019 & 2032
- Table 29: Rest of Europe Global Blood Processing Devices and Consumables Market Revenue (Million) Forecast, by Application 2019 & 2032
- Table 30: Rest of Europe Global Blood Processing Devices and Consumables Market Volume (K Units) Forecast, by Application 2019 & 2032
- Table 31: Global Blood Processing Devices and Consumables Market Revenue Million Forecast, by Country 2019 & 2032
- Table 32: Global Blood Processing Devices and Consumables Market Volume K Units Forecast, by Country 2019 & 2032
- Table 33: China Global Blood Processing Devices and Consumables Market Revenue (Million) Forecast, by Application 2019 & 2032
- Table 34: China Global Blood Processing Devices and Consumables Market Volume (K Units) Forecast, by Application 2019 & 2032
- Table 35: Japan Global Blood Processing Devices and Consumables Market Revenue (Million) Forecast, by Application 2019 & 2032
- Table 36: Japan Global Blood Processing Devices and Consumables Market Volume (K Units) Forecast, by Application 2019 & 2032
- Table 37: India Global Blood Processing Devices and Consumables Market Revenue (Million) Forecast, by Application 2019 & 2032
- Table 38: India Global Blood Processing Devices and Consumables Market Volume (K Units) Forecast, by Application 2019 & 2032
- Table 39: Australia Global Blood Processing Devices and Consumables Market Revenue (Million) Forecast, by Application 2019 & 2032
- Table 40: Australia Global Blood Processing Devices and Consumables Market Volume (K Units) Forecast, by Application 2019 & 2032
- Table 41: South Korea Global Blood Processing Devices and Consumables Market Revenue (Million) Forecast, by Application 2019 & 2032
- Table 42: South Korea Global Blood Processing Devices and Consumables Market Volume (K Units) Forecast, by Application 2019 & 2032
- Table 43: Rest of Asia Pacific Global Blood Processing Devices and Consumables Market Revenue (Million) Forecast, by Application 2019 & 2032
- Table 44: Rest of Asia Pacific Global Blood Processing Devices and Consumables Market Volume (K Units) Forecast, by Application 2019 & 2032
- Table 45: Global Blood Processing Devices and Consumables Market Revenue Million Forecast, by Country 2019 & 2032
- Table 46: Global Blood Processing Devices and Consumables Market Volume K Units Forecast, by Country 2019 & 2032
- Table 47: GCC Global Blood Processing Devices and Consumables Market Revenue (Million) Forecast, by Application 2019 & 2032
- Table 48: GCC Global Blood Processing Devices and Consumables Market Volume (K Units) Forecast, by Application 2019 & 2032
- Table 49: South Africa Global Blood Processing Devices and Consumables Market Revenue (Million) Forecast, by Application 2019 & 2032
- Table 50: South Africa Global Blood Processing Devices and Consumables Market Volume (K Units) Forecast, by Application 2019 & 2032
- Table 51: Rest of Middle East and Africa Global Blood Processing Devices and Consumables Market Revenue (Million) Forecast, by Application 2019 & 2032
- Table 52: Rest of Middle East and Africa Global Blood Processing Devices and Consumables Market Volume (K Units) Forecast, by Application 2019 & 2032
- Table 53: Global Blood Processing Devices and Consumables Market Revenue Million Forecast, by Country 2019 & 2032
- Table 54: Global Blood Processing Devices and Consumables Market Volume K Units Forecast, by Country 2019 & 2032
- Table 55: Brazil Global Blood Processing Devices and Consumables Market Revenue (Million) Forecast, by Application 2019 & 2032
- Table 56: Brazil Global Blood Processing Devices and Consumables Market Volume (K Units) Forecast, by Application 2019 & 2032
- Table 57: Argentina Global Blood Processing Devices and Consumables Market Revenue (Million) Forecast, by Application 2019 & 2032
- Table 58: Argentina Global Blood Processing Devices and Consumables Market Volume (K Units) Forecast, by Application 2019 & 2032
- Table 59: Rest of South America Global Blood Processing Devices and Consumables Market Revenue (Million) Forecast, by Application 2019 & 2032
- Table 60: Rest of South America Global Blood Processing Devices and Consumables Market Volume (K Units) Forecast, by Application 2019 & 2032
- Table 61: Global Blood Processing Devices and Consumables Market Revenue Million Forecast, by Product 2019 & 2032
- Table 62: Global Blood Processing Devices and Consumables Market Volume K Units Forecast, by Product 2019 & 2032
- Table 63: Global Blood Processing Devices and Consumables Market Revenue Million Forecast, by End User 2019 & 2032
- Table 64: Global Blood Processing Devices and Consumables Market Volume K Units Forecast, by End User 2019 & 2032
- Table 65: Global Blood Processing Devices and Consumables Market Revenue Million Forecast, by Country 2019 & 2032
- Table 66: Global Blood Processing Devices and Consumables Market Volume K Units Forecast, by Country 2019 & 2032
- Table 67: United States Global Blood Processing Devices and Consumables Market Revenue (Million) Forecast, by Application 2019 & 2032
- Table 68: United States Global Blood Processing Devices and Consumables Market Volume (K Units) Forecast, by Application 2019 & 2032
- Table 69: Canada Global Blood Processing Devices and Consumables Market Revenue (Million) Forecast, by Application 2019 & 2032
- Table 70: Canada Global Blood Processing Devices and Consumables Market Volume (K Units) Forecast, by Application 2019 & 2032
- Table 71: Mexico Global Blood Processing Devices and Consumables Market Revenue (Million) Forecast, by Application 2019 & 2032
- Table 72: Mexico Global Blood Processing Devices and Consumables Market Volume (K Units) Forecast, by Application 2019 & 2032
- Table 73: Global Blood Processing Devices and Consumables Market Revenue Million Forecast, by Product 2019 & 2032
- Table 74: Global Blood Processing Devices and Consumables Market Volume K Units Forecast, by Product 2019 & 2032
- Table 75: Global Blood Processing Devices and Consumables Market Revenue Million Forecast, by End User 2019 & 2032
- Table 76: Global Blood Processing Devices and Consumables Market Volume K Units Forecast, by End User 2019 & 2032
- Table 77: Global Blood Processing Devices and Consumables Market Revenue Million Forecast, by Country 2019 & 2032
- Table 78: Global Blood Processing Devices and Consumables Market Volume K Units Forecast, by Country 2019 & 2032
- Table 79: Germany Global Blood Processing Devices and Consumables Market Revenue (Million) Forecast, by Application 2019 & 2032
- Table 80: Germany Global Blood Processing Devices and Consumables Market Volume (K Units) Forecast, by Application 2019 & 2032
- Table 81: United Kingdom Global Blood Processing Devices and Consumables Market Revenue (Million) Forecast, by Application 2019 & 2032
- Table 82: United Kingdom Global Blood Processing Devices and Consumables Market Volume (K Units) Forecast, by Application 2019 & 2032
- Table 83: France Global Blood Processing Devices and Consumables Market Revenue (Million) Forecast, by Application 2019 & 2032
- Table 84: France Global Blood Processing Devices and Consumables Market Volume (K Units) Forecast, by Application 2019 & 2032
- Table 85: Italy Global Blood Processing Devices and Consumables Market Revenue (Million) Forecast, by Application 2019 & 2032
- Table 86: Italy Global Blood Processing Devices and Consumables Market Volume (K Units) Forecast, by Application 2019 & 2032
- Table 87: Spain Global Blood Processing Devices and Consumables Market Revenue (Million) Forecast, by Application 2019 & 2032
- Table 88: Spain Global Blood Processing Devices and Consumables Market Volume (K Units) Forecast, by Application 2019 & 2032
- Table 89: Rest of Europe Global Blood Processing Devices and Consumables Market Revenue (Million) Forecast, by Application 2019 & 2032
- Table 90: Rest of Europe Global Blood Processing Devices and Consumables Market Volume (K Units) Forecast, by Application 2019 & 2032
- Table 91: Global Blood Processing Devices and Consumables Market Revenue Million Forecast, by Product 2019 & 2032
- Table 92: Global Blood Processing Devices and Consumables Market Volume K Units Forecast, by Product 2019 & 2032
- Table 93: Global Blood Processing Devices and Consumables Market Revenue Million Forecast, by End User 2019 & 2032
- Table 94: Global Blood Processing Devices and Consumables Market Volume K Units Forecast, by End User 2019 & 2032
- Table 95: Global Blood Processing Devices and Consumables Market Revenue Million Forecast, by Country 2019 & 2032
- Table 96: Global Blood Processing Devices and Consumables Market Volume K Units Forecast, by Country 2019 & 2032
- Table 97: China Global Blood Processing Devices and Consumables Market Revenue (Million) Forecast, by Application 2019 & 2032
- Table 98: China Global Blood Processing Devices and Consumables Market Volume (K Units) Forecast, by Application 2019 & 2032
- Table 99: Japan Global Blood Processing Devices and Consumables Market Revenue (Million) Forecast, by Application 2019 & 2032
- Table 100: Japan Global Blood Processing Devices and Consumables Market Volume (K Units) Forecast, by Application 2019 & 2032
- Table 101: India Global Blood Processing Devices and Consumables Market Revenue (Million) Forecast, by Application 2019 & 2032
- Table 102: India Global Blood Processing Devices and Consumables Market Volume (K Units) Forecast, by Application 2019 & 2032
- Table 103: Australia Global Blood Processing Devices and Consumables Market Revenue (Million) Forecast, by Application 2019 & 2032
- Table 104: Australia Global Blood Processing Devices and Consumables Market Volume (K Units) Forecast, by Application 2019 & 2032
- Table 105: South Korea Global Blood Processing Devices and Consumables Market Revenue (Million) Forecast, by Application 2019 & 2032
- Table 106: South Korea Global Blood Processing Devices and Consumables Market Volume (K Units) Forecast, by Application 2019 & 2032
- Table 107: Rest of Asia Pacific Global Blood Processing Devices and Consumables Market Revenue (Million) Forecast, by Application 2019 & 2032
- Table 108: Rest of Asia Pacific Global Blood Processing Devices and Consumables Market Volume (K Units) Forecast, by Application 2019 & 2032
- Table 109: Global Blood Processing Devices and Consumables Market Revenue Million Forecast, by Product 2019 & 2032
- Table 110: Global Blood Processing Devices and Consumables Market Volume K Units Forecast, by Product 2019 & 2032
- Table 111: Global Blood Processing Devices and Consumables Market Revenue Million Forecast, by End User 2019 & 2032
- Table 112: Global Blood Processing Devices and Consumables Market Volume K Units Forecast, by End User 2019 & 2032
- Table 113: Global Blood Processing Devices and Consumables Market Revenue Million Forecast, by Country 2019 & 2032
- Table 114: Global Blood Processing Devices and Consumables Market Volume K Units Forecast, by Country 2019 & 2032
- Table 115: GCC Global Blood Processing Devices and Consumables Market Revenue (Million) Forecast, by Application 2019 & 2032
- Table 116: GCC Global Blood Processing Devices and Consumables Market Volume (K Units) Forecast, by Application 2019 & 2032
- Table 117: South Africa Global Blood Processing Devices and Consumables Market Revenue (Million) Forecast, by Application 2019 & 2032
- Table 118: South Africa Global Blood Processing Devices and Consumables Market Volume (K Units) Forecast, by Application 2019 & 2032
- Table 119: Rest of Middle East and Africa Global Blood Processing Devices and Consumables Market Revenue (Million) Forecast, by Application 2019 & 2032
- Table 120: Rest of Middle East and Africa Global Blood Processing Devices and Consumables Market Volume (K Units) Forecast, by Application 2019 & 2032
- Table 121: Global Blood Processing Devices and Consumables Market Revenue Million Forecast, by Product 2019 & 2032
- Table 122: Global Blood Processing Devices and Consumables Market Volume K Units Forecast, by Product 2019 & 2032
- Table 123: Global Blood Processing Devices and Consumables Market Revenue Million Forecast, by End User 2019 & 2032
- Table 124: Global Blood Processing Devices and Consumables Market Volume K Units Forecast, by End User 2019 & 2032
- Table 125: Global Blood Processing Devices and Consumables Market Revenue Million Forecast, by Country 2019 & 2032
- Table 126: Global Blood Processing Devices and Consumables Market Volume K Units Forecast, by Country 2019 & 2032
- Table 127: Brazil Global Blood Processing Devices and Consumables Market Revenue (Million) Forecast, by Application 2019 & 2032
- Table 128: Brazil Global Blood Processing Devices and Consumables Market Volume (K Units) Forecast, by Application 2019 & 2032
- Table 129: Argentina Global Blood Processing Devices and Consumables Market Revenue (Million) Forecast, by Application 2019 & 2032
- Table 130: Argentina Global Blood Processing Devices and Consumables Market Volume (K Units) Forecast, by Application 2019 & 2032
- Table 131: Rest of South America Global Blood Processing Devices and Consumables Market Revenue (Million) Forecast, by Application 2019 & 2032
- Table 132: Rest of South America Global Blood Processing Devices and Consumables Market Volume (K Units) Forecast, by Application 2019 & 2032
Frequently Asked Questions
1. What is the projected Compound Annual Growth Rate (CAGR) of the Global Blood Processing Devices and Consumables Market?
The projected CAGR is approximately > 6.50%.
2. Which companies are prominent players in the Global Blood Processing Devices and Consumables Market?
Key companies in the market include Becton Dickinson and Company, BioMerieux SA, Terumo Corporation, Abbott Laboratories, Danaher Corporation, Roche Holdings AG, Bio-Rad Laboratories, Haemonetics Corporation, Immucor Inc, Grifols International, Thermogenesis Corporation, Macopharma SA Beurer GmbH.
3. What are the main segments of the Global Blood Processing Devices and Consumables Market?
The market segments include Product, End User.
4. Can you provide details about the market size?
The market size is estimated to be USD XX Million as of 2022.
5. What are some drivers contributing to market growth?
Rising Prevenlance of Infectious Disorders Involving Blood Transfusions and Surgical Treatment; Growing Number of Initiatives in Regenerative Medicine and Cell Therapies; Increasing Geriatric Population.
6. What are the notable trends driving market growth?
Blood Cell Processors Segment is Expected to Hold a Major Market Share in the Blood Processing Devices and Consumables Market.
7. Are there any restraints impacting market growth?
Stringent Regulations; High Cost of Blood Processing Devices.
8. Can you provide examples of recent developments in the market?
In July 2022, Rhinostics introduced another breakthrough in automated sample collection technologies with the launch of the patent-pending VERIstic Collection Device focused on small volume blood collection.
9. What pricing options are available for accessing the report?
Pricing options include single-user, multi-user, and enterprise licenses priced at USD 4750, USD 5250, and USD 8750 respectively.
10. Is the market size provided in terms of value or volume?
The market size is provided in terms of value, measured in Million and volume, measured in K Units.
11. Are there any specific market keywords associated with the report?
Yes, the market keyword associated with the report is "Global Blood Processing Devices and Consumables Market," which aids in identifying and referencing the specific market segment covered.
12. How do I determine which pricing option suits my needs best?
The pricing options vary based on user requirements and access needs. Individual users may opt for single-user licenses, while businesses requiring broader access may choose multi-user or enterprise licenses for cost-effective access to the report.
13. Are there any additional resources or data provided in the Global Blood Processing Devices and Consumables Market report?
While the report offers comprehensive insights, it's advisable to review the specific contents or supplementary materials provided to ascertain if additional resources or data are available.
14. How can I stay updated on further developments or reports in the Global Blood Processing Devices and Consumables Market?
To stay informed about further developments, trends, and reports in the Global Blood Processing Devices and Consumables Market, consider subscribing to industry newsletters, following relevant companies and organizations, or regularly checking reputable industry news sources and publications.
Methodology
Step 1 - Identification of Relevant Samples Size from Population Database


Step 2 - Approaches for Defining Global Market Size (Value, Volume* & Price*)

Note*: In applicable scenarios
Step 3 - Data Sources
Primary Research
- Web Analytics
- Survey Reports
- Research Institute
- Latest Research Reports
- Opinion Leaders
Secondary Research
- Annual Reports
- White Paper
- Latest Press Release
- Industry Association
- Paid Database
- Investor Presentations

Step 4 - Data Triangulation
Involves using different sources of information in order to increase the validity of a study
These sources are likely to be stakeholders in a program - participants, other researchers, program staff, other community members, and so on.
Then we put all data in single framework & apply various statistical tools to find out the dynamic on the market.
During the analysis stage, feedback from the stakeholder groups would be compared to determine areas of agreement as well as areas of divergence


