
Key Insights
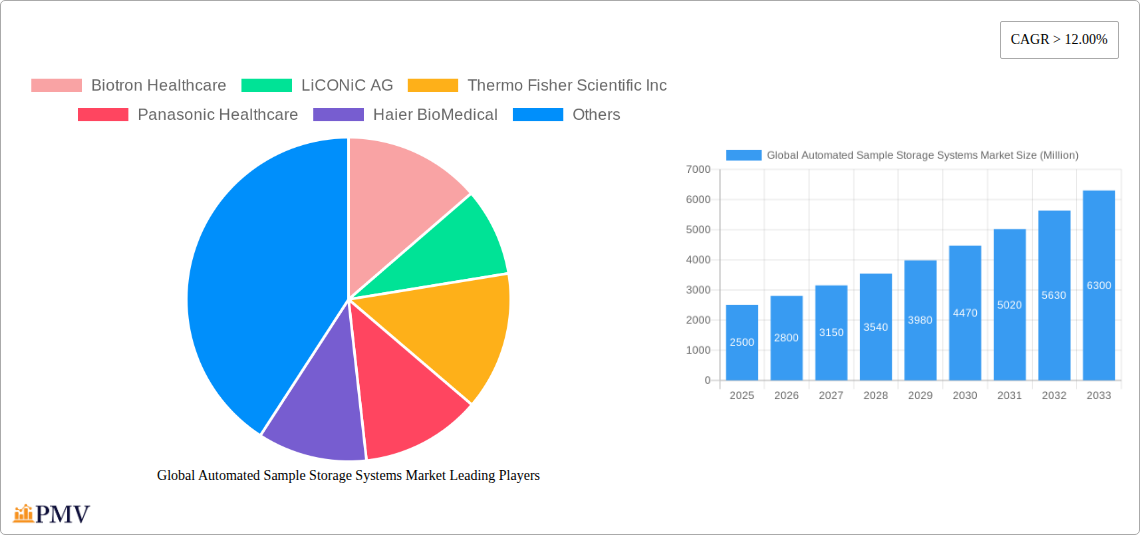
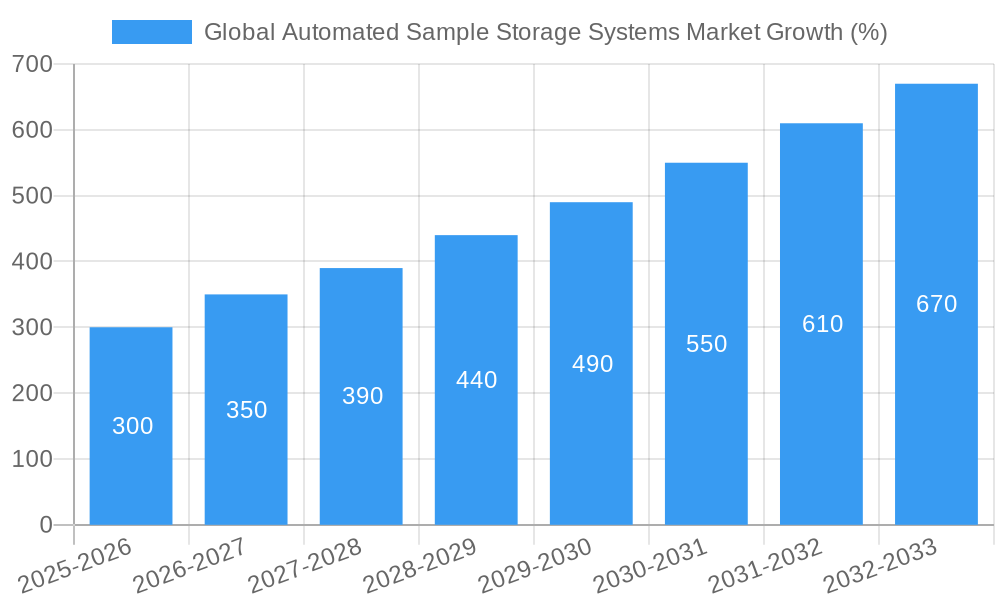
The global automated sample storage systems market is experiencing robust growth, driven by the increasing demand for high-throughput screening in pharmaceutical and biotechnology research, coupled with the need for efficient sample management in clinical trials and biobanks. The market's Compound Annual Growth Rate (CAGR) exceeding 12% from 2019 to 2024 indicates a significant upward trajectory. This growth is fueled by several key factors: the rising prevalence of chronic diseases necessitating extensive sample storage and analysis; advancements in automation technology leading to improved efficiency, reduced human error, and increased throughput; and the growing adoption of LIMS (Laboratory Information Management Systems) for seamless sample tracking and management. Furthermore, the increasing emphasis on regulatory compliance and data integrity within the pharmaceutical and biotech industries further boosts the demand for automated systems. We estimate the market size in 2025 to be approximately $2.5 Billion, based on the provided CAGR and considering market expansion within various segments.
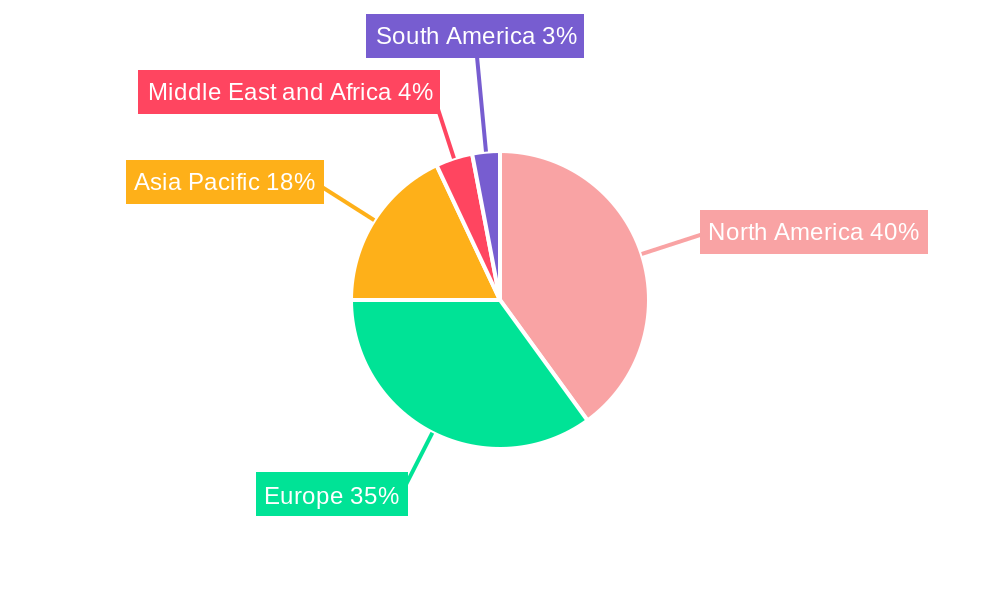
Market segmentation reveals that automated compound storage systems and automated liquid handling systems are significant revenue contributors, while biological samples constitute the largest share of the sample type segment. Pharmaceutical and biotech companies remain the dominant end-users, reflecting their critical need for efficient sample management. Geographic analysis shows that North America and Europe currently hold the largest market shares, driven by advanced research infrastructure and stringent regulatory frameworks. However, the Asia-Pacific region is projected to exhibit substantial growth in the coming years, driven by increasing investments in R&D and a growing pharmaceutical industry. While potential restraints such as high initial investment costs and the need for specialized technical expertise exist, the overall market outlook remains positive, driven by the aforementioned factors and the ongoing technological advancements in the field.
Global Automated Sample Storage Systems Market: A Comprehensive Report (2019-2033)
This in-depth report provides a comprehensive analysis of the global automated sample storage systems market, offering valuable insights for stakeholders across the pharmaceutical, biotech, chemical, and biobanking industries. With a study period spanning 2019-2033, a base year of 2025, and a forecast period of 2025-2033, this report delivers actionable intelligence to navigate the evolving landscape. The market is projected to reach xx Million by 2033, exhibiting a CAGR of xx% during the forecast period.
Global Automated Sample Storage Systems Market Market Structure & Competitive Dynamics
The global automated sample storage systems market is characterized by a moderately concentrated landscape, with key players such as Thermo Fisher Scientific Inc, Hamilton Company, Brooks Automation, and others competing fiercely. Market share is dynamic, with ongoing mergers and acquisitions (M&A) significantly shaping the competitive dynamics. The total M&A deal value in the last 5 years is estimated at xx Million. Innovation is a crucial differentiator, driven by advancements in robotics, automation, and software integration. Stringent regulatory frameworks, particularly concerning data security and sample integrity in regulated industries like pharmaceuticals, influence market practices. Product substitution is limited, with the primary alternatives being manual sample storage methods, which lack the efficiency and scalability of automated systems. End-user trends reflect a growing preference for integrated solutions that streamline workflows and improve data management.
- Market Concentration: Moderately concentrated, with top 5 players holding approximately xx% market share in 2024.
- Innovation Ecosystem: Strong emphasis on robotics, AI, and cloud integration for enhanced efficiency and data management.
- Regulatory Landscape: Stringent regulations regarding data security and sample integrity, particularly in pharmaceutical and biobanking sectors.
- M&A Activity: Significant M&A activity observed in recent years, driven by strategic acquisitions to expand product portfolios and market reach. For example, the acquisition of Precise Automation by Brooks Automation in 2021 significantly enhanced robotic capabilities.
Global Automated Sample Storage Systems Market Industry Trends & Insights
The automated sample storage systems market is experiencing robust growth, propelled by several key factors. The increasing demand for high-throughput screening in drug discovery and development is a major driver. Advancements in robotics and AI are leading to more efficient and reliable systems, while the rising prevalence of chronic diseases and growing investments in personalized medicine are boosting the need for sophisticated sample management. Consumer preferences are shifting towards compact, user-friendly systems that minimize manual intervention and maximize sample security. The market is also witnessing technological disruptions, with the integration of cloud-based data management systems gaining traction. The market penetration rate for automated systems in pharmaceutical and biotech companies is approximately xx% in 2024, projected to increase to xx% by 2033.
The market is segmented by product type (automated compound storage systems, automated liquid handling systems, other products), sample type (biological samples, chemical compounds, other sample types), and end-user (pharmaceutical and biotech companies, chemical industries, private biobanks, other end-users). The CAGR for the overall market during the forecast period (2025-2033) is estimated at xx%. Competitive dynamics are intense, with companies focusing on product innovation, strategic partnerships, and acquisitions to maintain a competitive edge.
Dominant Markets & Segments in Global Automated Sample Storage Systems Market
The North American region currently holds the largest market share, driven by strong pharmaceutical and biotech industries, coupled with significant investments in research and development. Within the product segment, automated compound storage systems dominate due to the high volume of compounds used in drug discovery. Biological samples constitute the largest sample type segment. Pharmaceutical and biotech companies account for the majority of end-user spending.
- Key Drivers for North American Dominance: Robust pharmaceutical and biotech industries, high R&D spending, and supportive regulatory environment.
- Automated Compound Storage Systems: High demand in drug discovery and development, driven by high-throughput screening needs.
- Biological Samples: Largest sample type segment, driven by applications in genomics, proteomics, and cell-based assays.
- Pharmaceutical and Biotech Companies: Largest end-user segment due to their substantial needs for efficient sample management.
Global Automated Sample Storage Systems Market Product Innovations
Recent innovations in automated sample storage systems focus on enhancing efficiency, scalability, and security. Miniaturization, improved robotics, and advanced data management capabilities are key trends. Systems are becoming more user-friendly, requiring less technical expertise for operation and maintenance. This enhanced usability and streamlined integration with other laboratory equipment are major competitive advantages.
Report Segmentation & Scope
The report segments the global automated sample storage systems market by:
Products: Automated Compound Storage Systems (growth projection: xx%, market size in 2024: xx Million), Automated Liquid Handling Systems (growth projection: xx%, market size in 2024: xx Million), Other Products (growth projection: xx%, market size in 2024: xx Million). Competitive dynamics vary across these segments, with specialized players emerging in certain niches.
Sample Type: Biological Samples (growth projection: xx%, market size in 2024: xx Million), Chemical Compounds (growth projection: xx%, market size in 2024: xx Million), Other Sample Types (growth projection: xx%, market size in 2024: xx Million). The choice of system is heavily influenced by the specific requirements of the sample type.
End-Users: Pharmaceutical and Biotech Companies (growth projection: xx%, market size in 2024: xx Million), Chemical Industries (growth projection: xx%, market size in 2024: xx Million), Private Biobanks (growth projection: xx%, market size in 2024: xx Million), Other End-Users (growth projection: xx%, market size in 2024: xx Million). The needs and investment capacity of each end-user segment significantly impact market demand.
Key Drivers of Global Automated Sample Storage Systems Market Growth
Several factors fuel the growth of the global automated sample storage systems market. Technological advancements, such as improved robotics and AI-powered data management, enhance efficiency and accuracy. The increasing demand for high-throughput screening in drug discovery and personalized medicine creates substantial market opportunities. Favorable regulatory environments in some regions encourage the adoption of automated systems.
Challenges in the Global Automated Sample Storage Systems Market Sector
Despite positive growth prospects, the market faces certain challenges. High initial investment costs can be a barrier for smaller laboratories. The need for specialized technical expertise to operate and maintain complex systems presents a hurdle for adoption. Competition from established players and emerging startups intensifies market pressures, impacting profitability and pricing strategies. Supply chain disruptions can impact the availability and affordability of crucial components.
Leading Players in the Global Automated Sample Storage Systems Market Market
- Biotron Healthcare
- LiCONiC AG
- Thermo Fisher Scientific Inc
- Panasonic Healthcare
- Haier BioMedical
- Tsubakimoto Chain
- TTP LabTech
- Hamilton Company
- Brooks Automation
- ASKION GmbH
- Angelantoni Life Science
Key Developments in Global Automated Sample Storage Systems Market Sector
- April 2021: Brooks Automation, Inc. acquired Precise Automation, Inc., bolstering its robotic automation capabilities for laboratory applications.
- February 2022: Hamilton launched the Verso Q50 and Verso Q75 automated sample storage systems, offering enhanced capacity and efficiency.
Strategic Global Automated Sample Storage Systems Market Market Outlook
The future of the automated sample storage systems market is bright, with substantial growth potential driven by technological advancements, increasing demand from various end-user segments, and ongoing investment in research and development. Strategic opportunities exist for companies focusing on developing innovative, user-friendly, and cost-effective systems that cater to specific niche markets. Partnerships and collaborations to integrate solutions and enhance data management capabilities will be crucial for success.
Global Automated Sample Storage Systems Market Segmentation
-
1. Products
- 1.1. Automated Compound Storage Systems
- 1.2. Automated Liquid Handling Systems
- 1.3. Other Products
-
2. Sample Type
- 2.1. Biological Samples
- 2.2. Chemical Compounds
- 2.3. Other Sample Types
-
3. End-Users
- 3.1. Pharmaceutical and Biotech Companies
- 3.2. Chemical Industries
- 3.3. Private Biobanks
- 3.4. Other End-Users
Global Automated Sample Storage Systems Market Segmentation By Geography
-
1. North America
- 1.1. United states
- 1.2. Canada
- 1.3. Mexico
-
2. Europe
- 2.1. Germany
- 2.2. United Kingdom
- 2.3. France
- 2.4. Italy
- 2.5. Spain
- 2.6. Rest of Europe
-
3. Asia Pacific
- 3.1. China
- 3.2. Japan
- 3.3. India
- 3.4. Australia
- 3.5. South Korea
- 3.6. Rest of Asia Pacific
-
4. Middle East and Africa
- 4.1. GCC
- 4.2. South Africa
- 4.3. Rest of Middle East and Africa
-
5. South America
- 5.1. Brazil
- 5.2. Argentina
- 5.3. Rest of South America
Global Automated Sample Storage Systems Market REPORT HIGHLIGHTS
| Aspects | Details |
|---|---|
| Study Period | 2019-2033 |
| Base Year | 2024 |
| Estimated Year | 2025 |
| Forecast Period | 2025-2033 |
| Historical Period | 2019-2024 |
| Growth Rate | CAGR of > 12.00% from 2019-2033 |
| Segmentation |
|
Table of Contents
- 1. Introduction
- 1.1. Research Scope
- 1.2. Market Segmentation
- 1.3. Research Methodology
- 1.4. Definitions and Assumptions
- 2. Executive Summary
- 2.1. Introduction
- 3. Market Dynamics
- 3.1. Introduction
- 3.2. Market Drivers
- 3.2.1. Increasing Research Activities in Biopharmaceutical Industry and Bio Banking Sectors; Reduced Labor Cost
- 3.3. Market Restrains
- 3.3.1. The Requirement for Consecutive Electricity; High Installation and Maintenance Cost
- 3.4. Market Trends
- 3.4.1. The Automated Compound Storage Systems Segment to Witness Significant Growth over the Forecast Period (2022-2027)
- 4. Market Factor Analysis
- 4.1. Porters Five Forces
- 4.2. Supply/Value Chain
- 4.3. PESTEL analysis
- 4.4. Market Entropy
- 4.5. Patent/Trademark Analysis
- 5. Global Automated Sample Storage Systems Market Analysis, Insights and Forecast, 2019-2031
- 5.1. Market Analysis, Insights and Forecast - by Products
- 5.1.1. Automated Compound Storage Systems
- 5.1.2. Automated Liquid Handling Systems
- 5.1.3. Other Products
- 5.2. Market Analysis, Insights and Forecast - by Sample Type
- 5.2.1. Biological Samples
- 5.2.2. Chemical Compounds
- 5.2.3. Other Sample Types
- 5.3. Market Analysis, Insights and Forecast - by End-Users
- 5.3.1. Pharmaceutical and Biotech Companies
- 5.3.2. Chemical Industries
- 5.3.3. Private Biobanks
- 5.3.4. Other End-Users
- 5.4. Market Analysis, Insights and Forecast - by Region
- 5.4.1. North America
- 5.4.2. Europe
- 5.4.3. Asia Pacific
- 5.4.4. Middle East and Africa
- 5.4.5. South America
- 5.1. Market Analysis, Insights and Forecast - by Products
- 6. North America Global Automated Sample Storage Systems Market Analysis, Insights and Forecast, 2019-2031
- 6.1. Market Analysis, Insights and Forecast - by Products
- 6.1.1. Automated Compound Storage Systems
- 6.1.2. Automated Liquid Handling Systems
- 6.1.3. Other Products
- 6.2. Market Analysis, Insights and Forecast - by Sample Type
- 6.2.1. Biological Samples
- 6.2.2. Chemical Compounds
- 6.2.3. Other Sample Types
- 6.3. Market Analysis, Insights and Forecast - by End-Users
- 6.3.1. Pharmaceutical and Biotech Companies
- 6.3.2. Chemical Industries
- 6.3.3. Private Biobanks
- 6.3.4. Other End-Users
- 6.1. Market Analysis, Insights and Forecast - by Products
- 7. Europe Global Automated Sample Storage Systems Market Analysis, Insights and Forecast, 2019-2031
- 7.1. Market Analysis, Insights and Forecast - by Products
- 7.1.1. Automated Compound Storage Systems
- 7.1.2. Automated Liquid Handling Systems
- 7.1.3. Other Products
- 7.2. Market Analysis, Insights and Forecast - by Sample Type
- 7.2.1. Biological Samples
- 7.2.2. Chemical Compounds
- 7.2.3. Other Sample Types
- 7.3. Market Analysis, Insights and Forecast - by End-Users
- 7.3.1. Pharmaceutical and Biotech Companies
- 7.3.2. Chemical Industries
- 7.3.3. Private Biobanks
- 7.3.4. Other End-Users
- 7.1. Market Analysis, Insights and Forecast - by Products
- 8. Asia Pacific Global Automated Sample Storage Systems Market Analysis, Insights and Forecast, 2019-2031
- 8.1. Market Analysis, Insights and Forecast - by Products
- 8.1.1. Automated Compound Storage Systems
- 8.1.2. Automated Liquid Handling Systems
- 8.1.3. Other Products
- 8.2. Market Analysis, Insights and Forecast - by Sample Type
- 8.2.1. Biological Samples
- 8.2.2. Chemical Compounds
- 8.2.3. Other Sample Types
- 8.3. Market Analysis, Insights and Forecast - by End-Users
- 8.3.1. Pharmaceutical and Biotech Companies
- 8.3.2. Chemical Industries
- 8.3.3. Private Biobanks
- 8.3.4. Other End-Users
- 8.1. Market Analysis, Insights and Forecast - by Products
- 9. Middle East and Africa Global Automated Sample Storage Systems Market Analysis, Insights and Forecast, 2019-2031
- 9.1. Market Analysis, Insights and Forecast - by Products
- 9.1.1. Automated Compound Storage Systems
- 9.1.2. Automated Liquid Handling Systems
- 9.1.3. Other Products
- 9.2. Market Analysis, Insights and Forecast - by Sample Type
- 9.2.1. Biological Samples
- 9.2.2. Chemical Compounds
- 9.2.3. Other Sample Types
- 9.3. Market Analysis, Insights and Forecast - by End-Users
- 9.3.1. Pharmaceutical and Biotech Companies
- 9.3.2. Chemical Industries
- 9.3.3. Private Biobanks
- 9.3.4. Other End-Users
- 9.1. Market Analysis, Insights and Forecast - by Products
- 10. South America Global Automated Sample Storage Systems Market Analysis, Insights and Forecast, 2019-2031
- 10.1. Market Analysis, Insights and Forecast - by Products
- 10.1.1. Automated Compound Storage Systems
- 10.1.2. Automated Liquid Handling Systems
- 10.1.3. Other Products
- 10.2. Market Analysis, Insights and Forecast - by Sample Type
- 10.2.1. Biological Samples
- 10.2.2. Chemical Compounds
- 10.2.3. Other Sample Types
- 10.3. Market Analysis, Insights and Forecast - by End-Users
- 10.3.1. Pharmaceutical and Biotech Companies
- 10.3.2. Chemical Industries
- 10.3.3. Private Biobanks
- 10.3.4. Other End-Users
- 10.1. Market Analysis, Insights and Forecast - by Products
- 11. North America Global Automated Sample Storage Systems Market Analysis, Insights and Forecast, 2019-2031
- 11.1. Market Analysis, Insights and Forecast - By Country/Sub-region
- 11.1.1 United states
- 11.1.2 Canada
- 11.1.3 Mexico
- 12. Europe Global Automated Sample Storage Systems Market Analysis, Insights and Forecast, 2019-2031
- 12.1. Market Analysis, Insights and Forecast - By Country/Sub-region
- 12.1.1 Germany
- 12.1.2 United Kingdom
- 12.1.3 France
- 12.1.4 Italy
- 12.1.5 Spain
- 12.1.6 Rest of Europe
- 13. Asia Pacific Global Automated Sample Storage Systems Market Analysis, Insights and Forecast, 2019-2031
- 13.1. Market Analysis, Insights and Forecast - By Country/Sub-region
- 13.1.1 China
- 13.1.2 Japan
- 13.1.3 India
- 13.1.4 Australia
- 13.1.5 South Korea
- 13.1.6 Rest of Asia Pacific
- 14. Middle East and Africa Global Automated Sample Storage Systems Market Analysis, Insights and Forecast, 2019-2031
- 14.1. Market Analysis, Insights and Forecast - By Country/Sub-region
- 14.1.1 GCC
- 14.1.2 South Africa
- 14.1.3 Rest of Middle East and Africa
- 15. South America Global Automated Sample Storage Systems Market Analysis, Insights and Forecast, 2019-2031
- 15.1. Market Analysis, Insights and Forecast - By Country/Sub-region
- 15.1.1 Brazil
- 15.1.2 Argentina
- 15.1.3 Rest of South America
- 16. Competitive Analysis
- 16.1. Market Share Analysis 2024
- 16.2. Company Profiles
- 16.2.1 Biotron Healthcare
- 16.2.1.1. Overview
- 16.2.1.2. Products
- 16.2.1.3. SWOT Analysis
- 16.2.1.4. Recent Developments
- 16.2.1.5. Financials (Based on Availability)
- 16.2.2 LiCONiC AG
- 16.2.2.1. Overview
- 16.2.2.2. Products
- 16.2.2.3. SWOT Analysis
- 16.2.2.4. Recent Developments
- 16.2.2.5. Financials (Based on Availability)
- 16.2.3 Thermo Fisher Scientific Inc
- 16.2.3.1. Overview
- 16.2.3.2. Products
- 16.2.3.3. SWOT Analysis
- 16.2.3.4. Recent Developments
- 16.2.3.5. Financials (Based on Availability)
- 16.2.4 Panasonic Healthcare
- 16.2.4.1. Overview
- 16.2.4.2. Products
- 16.2.4.3. SWOT Analysis
- 16.2.4.4. Recent Developments
- 16.2.4.5. Financials (Based on Availability)
- 16.2.5 Haier BioMedical
- 16.2.5.1. Overview
- 16.2.5.2. Products
- 16.2.5.3. SWOT Analysis
- 16.2.5.4. Recent Developments
- 16.2.5.5. Financials (Based on Availability)
- 16.2.6 Tsubakimoto Chain*List Not Exhaustive
- 16.2.6.1. Overview
- 16.2.6.2. Products
- 16.2.6.3. SWOT Analysis
- 16.2.6.4. Recent Developments
- 16.2.6.5. Financials (Based on Availability)
- 16.2.7 TTP LabTech
- 16.2.7.1. Overview
- 16.2.7.2. Products
- 16.2.7.3. SWOT Analysis
- 16.2.7.4. Recent Developments
- 16.2.7.5. Financials (Based on Availability)
- 16.2.8 Hamilton Company
- 16.2.8.1. Overview
- 16.2.8.2. Products
- 16.2.8.3. SWOT Analysis
- 16.2.8.4. Recent Developments
- 16.2.8.5. Financials (Based on Availability)
- 16.2.9 Brooks Automation
- 16.2.9.1. Overview
- 16.2.9.2. Products
- 16.2.9.3. SWOT Analysis
- 16.2.9.4. Recent Developments
- 16.2.9.5. Financials (Based on Availability)
- 16.2.10 ASKION GmbH
- 16.2.10.1. Overview
- 16.2.10.2. Products
- 16.2.10.3. SWOT Analysis
- 16.2.10.4. Recent Developments
- 16.2.10.5. Financials (Based on Availability)
- 16.2.11 Angelantoni Life Science
- 16.2.11.1. Overview
- 16.2.11.2. Products
- 16.2.11.3. SWOT Analysis
- 16.2.11.4. Recent Developments
- 16.2.11.5. Financials (Based on Availability)
- 16.2.1 Biotron Healthcare
List of Figures
- Figure 1: Global Global Automated Sample Storage Systems Market Revenue Breakdown (Million, %) by Region 2024 & 2032
- Figure 2: North America Global Automated Sample Storage Systems Market Revenue (Million), by Country 2024 & 2032
- Figure 3: North America Global Automated Sample Storage Systems Market Revenue Share (%), by Country 2024 & 2032
- Figure 4: Europe Global Automated Sample Storage Systems Market Revenue (Million), by Country 2024 & 2032
- Figure 5: Europe Global Automated Sample Storage Systems Market Revenue Share (%), by Country 2024 & 2032
- Figure 6: Asia Pacific Global Automated Sample Storage Systems Market Revenue (Million), by Country 2024 & 2032
- Figure 7: Asia Pacific Global Automated Sample Storage Systems Market Revenue Share (%), by Country 2024 & 2032
- Figure 8: Middle East and Africa Global Automated Sample Storage Systems Market Revenue (Million), by Country 2024 & 2032
- Figure 9: Middle East and Africa Global Automated Sample Storage Systems Market Revenue Share (%), by Country 2024 & 2032
- Figure 10: South America Global Automated Sample Storage Systems Market Revenue (Million), by Country 2024 & 2032
- Figure 11: South America Global Automated Sample Storage Systems Market Revenue Share (%), by Country 2024 & 2032
- Figure 12: North America Global Automated Sample Storage Systems Market Revenue (Million), by Products 2024 & 2032
- Figure 13: North America Global Automated Sample Storage Systems Market Revenue Share (%), by Products 2024 & 2032
- Figure 14: North America Global Automated Sample Storage Systems Market Revenue (Million), by Sample Type 2024 & 2032
- Figure 15: North America Global Automated Sample Storage Systems Market Revenue Share (%), by Sample Type 2024 & 2032
- Figure 16: North America Global Automated Sample Storage Systems Market Revenue (Million), by End-Users 2024 & 2032
- Figure 17: North America Global Automated Sample Storage Systems Market Revenue Share (%), by End-Users 2024 & 2032
- Figure 18: North America Global Automated Sample Storage Systems Market Revenue (Million), by Country 2024 & 2032
- Figure 19: North America Global Automated Sample Storage Systems Market Revenue Share (%), by Country 2024 & 2032
- Figure 20: Europe Global Automated Sample Storage Systems Market Revenue (Million), by Products 2024 & 2032
- Figure 21: Europe Global Automated Sample Storage Systems Market Revenue Share (%), by Products 2024 & 2032
- Figure 22: Europe Global Automated Sample Storage Systems Market Revenue (Million), by Sample Type 2024 & 2032
- Figure 23: Europe Global Automated Sample Storage Systems Market Revenue Share (%), by Sample Type 2024 & 2032
- Figure 24: Europe Global Automated Sample Storage Systems Market Revenue (Million), by End-Users 2024 & 2032
- Figure 25: Europe Global Automated Sample Storage Systems Market Revenue Share (%), by End-Users 2024 & 2032
- Figure 26: Europe Global Automated Sample Storage Systems Market Revenue (Million), by Country 2024 & 2032
- Figure 27: Europe Global Automated Sample Storage Systems Market Revenue Share (%), by Country 2024 & 2032
- Figure 28: Asia Pacific Global Automated Sample Storage Systems Market Revenue (Million), by Products 2024 & 2032
- Figure 29: Asia Pacific Global Automated Sample Storage Systems Market Revenue Share (%), by Products 2024 & 2032
- Figure 30: Asia Pacific Global Automated Sample Storage Systems Market Revenue (Million), by Sample Type 2024 & 2032
- Figure 31: Asia Pacific Global Automated Sample Storage Systems Market Revenue Share (%), by Sample Type 2024 & 2032
- Figure 32: Asia Pacific Global Automated Sample Storage Systems Market Revenue (Million), by End-Users 2024 & 2032
- Figure 33: Asia Pacific Global Automated Sample Storage Systems Market Revenue Share (%), by End-Users 2024 & 2032
- Figure 34: Asia Pacific Global Automated Sample Storage Systems Market Revenue (Million), by Country 2024 & 2032
- Figure 35: Asia Pacific Global Automated Sample Storage Systems Market Revenue Share (%), by Country 2024 & 2032
- Figure 36: Middle East and Africa Global Automated Sample Storage Systems Market Revenue (Million), by Products 2024 & 2032
- Figure 37: Middle East and Africa Global Automated Sample Storage Systems Market Revenue Share (%), by Products 2024 & 2032
- Figure 38: Middle East and Africa Global Automated Sample Storage Systems Market Revenue (Million), by Sample Type 2024 & 2032
- Figure 39: Middle East and Africa Global Automated Sample Storage Systems Market Revenue Share (%), by Sample Type 2024 & 2032
- Figure 40: Middle East and Africa Global Automated Sample Storage Systems Market Revenue (Million), by End-Users 2024 & 2032
- Figure 41: Middle East and Africa Global Automated Sample Storage Systems Market Revenue Share (%), by End-Users 2024 & 2032
- Figure 42: Middle East and Africa Global Automated Sample Storage Systems Market Revenue (Million), by Country 2024 & 2032
- Figure 43: Middle East and Africa Global Automated Sample Storage Systems Market Revenue Share (%), by Country 2024 & 2032
- Figure 44: South America Global Automated Sample Storage Systems Market Revenue (Million), by Products 2024 & 2032
- Figure 45: South America Global Automated Sample Storage Systems Market Revenue Share (%), by Products 2024 & 2032
- Figure 46: South America Global Automated Sample Storage Systems Market Revenue (Million), by Sample Type 2024 & 2032
- Figure 47: South America Global Automated Sample Storage Systems Market Revenue Share (%), by Sample Type 2024 & 2032
- Figure 48: South America Global Automated Sample Storage Systems Market Revenue (Million), by End-Users 2024 & 2032
- Figure 49: South America Global Automated Sample Storage Systems Market Revenue Share (%), by End-Users 2024 & 2032
- Figure 50: South America Global Automated Sample Storage Systems Market Revenue (Million), by Country 2024 & 2032
- Figure 51: South America Global Automated Sample Storage Systems Market Revenue Share (%), by Country 2024 & 2032
List of Tables
- Table 1: Global Automated Sample Storage Systems Market Revenue Million Forecast, by Region 2019 & 2032
- Table 2: Global Automated Sample Storage Systems Market Revenue Million Forecast, by Products 2019 & 2032
- Table 3: Global Automated Sample Storage Systems Market Revenue Million Forecast, by Sample Type 2019 & 2032
- Table 4: Global Automated Sample Storage Systems Market Revenue Million Forecast, by End-Users 2019 & 2032
- Table 5: Global Automated Sample Storage Systems Market Revenue Million Forecast, by Region 2019 & 2032
- Table 6: Global Automated Sample Storage Systems Market Revenue Million Forecast, by Country 2019 & 2032
- Table 7: United states Global Automated Sample Storage Systems Market Revenue (Million) Forecast, by Application 2019 & 2032
- Table 8: Canada Global Automated Sample Storage Systems Market Revenue (Million) Forecast, by Application 2019 & 2032
- Table 9: Mexico Global Automated Sample Storage Systems Market Revenue (Million) Forecast, by Application 2019 & 2032
- Table 10: Global Automated Sample Storage Systems Market Revenue Million Forecast, by Country 2019 & 2032
- Table 11: Germany Global Automated Sample Storage Systems Market Revenue (Million) Forecast, by Application 2019 & 2032
- Table 12: United Kingdom Global Automated Sample Storage Systems Market Revenue (Million) Forecast, by Application 2019 & 2032
- Table 13: France Global Automated Sample Storage Systems Market Revenue (Million) Forecast, by Application 2019 & 2032
- Table 14: Italy Global Automated Sample Storage Systems Market Revenue (Million) Forecast, by Application 2019 & 2032
- Table 15: Spain Global Automated Sample Storage Systems Market Revenue (Million) Forecast, by Application 2019 & 2032
- Table 16: Rest of Europe Global Automated Sample Storage Systems Market Revenue (Million) Forecast, by Application 2019 & 2032
- Table 17: Global Automated Sample Storage Systems Market Revenue Million Forecast, by Country 2019 & 2032
- Table 18: China Global Automated Sample Storage Systems Market Revenue (Million) Forecast, by Application 2019 & 2032
- Table 19: Japan Global Automated Sample Storage Systems Market Revenue (Million) Forecast, by Application 2019 & 2032
- Table 20: India Global Automated Sample Storage Systems Market Revenue (Million) Forecast, by Application 2019 & 2032
- Table 21: Australia Global Automated Sample Storage Systems Market Revenue (Million) Forecast, by Application 2019 & 2032
- Table 22: South Korea Global Automated Sample Storage Systems Market Revenue (Million) Forecast, by Application 2019 & 2032
- Table 23: Rest of Asia Pacific Global Automated Sample Storage Systems Market Revenue (Million) Forecast, by Application 2019 & 2032
- Table 24: Global Automated Sample Storage Systems Market Revenue Million Forecast, by Country 2019 & 2032
- Table 25: GCC Global Automated Sample Storage Systems Market Revenue (Million) Forecast, by Application 2019 & 2032
- Table 26: South Africa Global Automated Sample Storage Systems Market Revenue (Million) Forecast, by Application 2019 & 2032
- Table 27: Rest of Middle East and Africa Global Automated Sample Storage Systems Market Revenue (Million) Forecast, by Application 2019 & 2032
- Table 28: Global Automated Sample Storage Systems Market Revenue Million Forecast, by Country 2019 & 2032
- Table 29: Brazil Global Automated Sample Storage Systems Market Revenue (Million) Forecast, by Application 2019 & 2032
- Table 30: Argentina Global Automated Sample Storage Systems Market Revenue (Million) Forecast, by Application 2019 & 2032
- Table 31: Rest of South America Global Automated Sample Storage Systems Market Revenue (Million) Forecast, by Application 2019 & 2032
- Table 32: Global Automated Sample Storage Systems Market Revenue Million Forecast, by Products 2019 & 2032
- Table 33: Global Automated Sample Storage Systems Market Revenue Million Forecast, by Sample Type 2019 & 2032
- Table 34: Global Automated Sample Storage Systems Market Revenue Million Forecast, by End-Users 2019 & 2032
- Table 35: Global Automated Sample Storage Systems Market Revenue Million Forecast, by Country 2019 & 2032
- Table 36: United states Global Automated Sample Storage Systems Market Revenue (Million) Forecast, by Application 2019 & 2032
- Table 37: Canada Global Automated Sample Storage Systems Market Revenue (Million) Forecast, by Application 2019 & 2032
- Table 38: Mexico Global Automated Sample Storage Systems Market Revenue (Million) Forecast, by Application 2019 & 2032
- Table 39: Global Automated Sample Storage Systems Market Revenue Million Forecast, by Products 2019 & 2032
- Table 40: Global Automated Sample Storage Systems Market Revenue Million Forecast, by Sample Type 2019 & 2032
- Table 41: Global Automated Sample Storage Systems Market Revenue Million Forecast, by End-Users 2019 & 2032
- Table 42: Global Automated Sample Storage Systems Market Revenue Million Forecast, by Country 2019 & 2032
- Table 43: Germany Global Automated Sample Storage Systems Market Revenue (Million) Forecast, by Application 2019 & 2032
- Table 44: United Kingdom Global Automated Sample Storage Systems Market Revenue (Million) Forecast, by Application 2019 & 2032
- Table 45: France Global Automated Sample Storage Systems Market Revenue (Million) Forecast, by Application 2019 & 2032
- Table 46: Italy Global Automated Sample Storage Systems Market Revenue (Million) Forecast, by Application 2019 & 2032
- Table 47: Spain Global Automated Sample Storage Systems Market Revenue (Million) Forecast, by Application 2019 & 2032
- Table 48: Rest of Europe Global Automated Sample Storage Systems Market Revenue (Million) Forecast, by Application 2019 & 2032
- Table 49: Global Automated Sample Storage Systems Market Revenue Million Forecast, by Products 2019 & 2032
- Table 50: Global Automated Sample Storage Systems Market Revenue Million Forecast, by Sample Type 2019 & 2032
- Table 51: Global Automated Sample Storage Systems Market Revenue Million Forecast, by End-Users 2019 & 2032
- Table 52: Global Automated Sample Storage Systems Market Revenue Million Forecast, by Country 2019 & 2032
- Table 53: China Global Automated Sample Storage Systems Market Revenue (Million) Forecast, by Application 2019 & 2032
- Table 54: Japan Global Automated Sample Storage Systems Market Revenue (Million) Forecast, by Application 2019 & 2032
- Table 55: India Global Automated Sample Storage Systems Market Revenue (Million) Forecast, by Application 2019 & 2032
- Table 56: Australia Global Automated Sample Storage Systems Market Revenue (Million) Forecast, by Application 2019 & 2032
- Table 57: South Korea Global Automated Sample Storage Systems Market Revenue (Million) Forecast, by Application 2019 & 2032
- Table 58: Rest of Asia Pacific Global Automated Sample Storage Systems Market Revenue (Million) Forecast, by Application 2019 & 2032
- Table 59: Global Automated Sample Storage Systems Market Revenue Million Forecast, by Products 2019 & 2032
- Table 60: Global Automated Sample Storage Systems Market Revenue Million Forecast, by Sample Type 2019 & 2032
- Table 61: Global Automated Sample Storage Systems Market Revenue Million Forecast, by End-Users 2019 & 2032
- Table 62: Global Automated Sample Storage Systems Market Revenue Million Forecast, by Country 2019 & 2032
- Table 63: GCC Global Automated Sample Storage Systems Market Revenue (Million) Forecast, by Application 2019 & 2032
- Table 64: South Africa Global Automated Sample Storage Systems Market Revenue (Million) Forecast, by Application 2019 & 2032
- Table 65: Rest of Middle East and Africa Global Automated Sample Storage Systems Market Revenue (Million) Forecast, by Application 2019 & 2032
- Table 66: Global Automated Sample Storage Systems Market Revenue Million Forecast, by Products 2019 & 2032
- Table 67: Global Automated Sample Storage Systems Market Revenue Million Forecast, by Sample Type 2019 & 2032
- Table 68: Global Automated Sample Storage Systems Market Revenue Million Forecast, by End-Users 2019 & 2032
- Table 69: Global Automated Sample Storage Systems Market Revenue Million Forecast, by Country 2019 & 2032
- Table 70: Brazil Global Automated Sample Storage Systems Market Revenue (Million) Forecast, by Application 2019 & 2032
- Table 71: Argentina Global Automated Sample Storage Systems Market Revenue (Million) Forecast, by Application 2019 & 2032
- Table 72: Rest of South America Global Automated Sample Storage Systems Market Revenue (Million) Forecast, by Application 2019 & 2032
Frequently Asked Questions
1. What is the projected Compound Annual Growth Rate (CAGR) of the Global Automated Sample Storage Systems Market?
The projected CAGR is approximately > 12.00%.
2. Which companies are prominent players in the Global Automated Sample Storage Systems Market?
Key companies in the market include Biotron Healthcare, LiCONiC AG, Thermo Fisher Scientific Inc, Panasonic Healthcare, Haier BioMedical, Tsubakimoto Chain*List Not Exhaustive, TTP LabTech, Hamilton Company, Brooks Automation, ASKION GmbH, Angelantoni Life Science.
3. What are the main segments of the Global Automated Sample Storage Systems Market?
The market segments include Products, Sample Type, End-Users.
4. Can you provide details about the market size?
The market size is estimated to be USD XX Million as of 2022.
5. What are some drivers contributing to market growth?
Increasing Research Activities in Biopharmaceutical Industry and Bio Banking Sectors; Reduced Labor Cost.
6. What are the notable trends driving market growth?
The Automated Compound Storage Systems Segment to Witness Significant Growth over the Forecast Period (2022-2027).
7. Are there any restraints impacting market growth?
The Requirement for Consecutive Electricity; High Installation and Maintenance Cost.
8. Can you provide examples of recent developments in the market?
In April 2021, Brooks Automation, Inc. announced the acquisition of Precise Automation, Inc. Precise Automation's proprietary technology has enabled human-robot workflows in a safe and easy-to-use manner, automating processes. Precise Automation's products can be used in a variety of end markets including laboratory automation.
9. What pricing options are available for accessing the report?
Pricing options include single-user, multi-user, and enterprise licenses priced at USD 4750, USD 5250, and USD 8750 respectively.
10. Is the market size provided in terms of value or volume?
The market size is provided in terms of value, measured in Million.
11. Are there any specific market keywords associated with the report?
Yes, the market keyword associated with the report is "Global Automated Sample Storage Systems Market," which aids in identifying and referencing the specific market segment covered.
12. How do I determine which pricing option suits my needs best?
The pricing options vary based on user requirements and access needs. Individual users may opt for single-user licenses, while businesses requiring broader access may choose multi-user or enterprise licenses for cost-effective access to the report.
13. Are there any additional resources or data provided in the Global Automated Sample Storage Systems Market report?
While the report offers comprehensive insights, it's advisable to review the specific contents or supplementary materials provided to ascertain if additional resources or data are available.
14. How can I stay updated on further developments or reports in the Global Automated Sample Storage Systems Market?
To stay informed about further developments, trends, and reports in the Global Automated Sample Storage Systems Market, consider subscribing to industry newsletters, following relevant companies and organizations, or regularly checking reputable industry news sources and publications.
Methodology
Step 1 - Identification of Relevant Samples Size from Population Database


Step 2 - Approaches for Defining Global Market Size (Value, Volume* & Price*)

Note*: In applicable scenarios
Step 3 - Data Sources
Primary Research
- Web Analytics
- Survey Reports
- Research Institute
- Latest Research Reports
- Opinion Leaders
Secondary Research
- Annual Reports
- White Paper
- Latest Press Release
- Industry Association
- Paid Database
- Investor Presentations

Step 4 - Data Triangulation
Involves using different sources of information in order to increase the validity of a study
These sources are likely to be stakeholders in a program - participants, other researchers, program staff, other community members, and so on.
Then we put all data in single framework & apply various statistical tools to find out the dynamic on the market.
During the analysis stage, feedback from the stakeholder groups would be compared to determine areas of agreement as well as areas of divergence


