
Key Insights
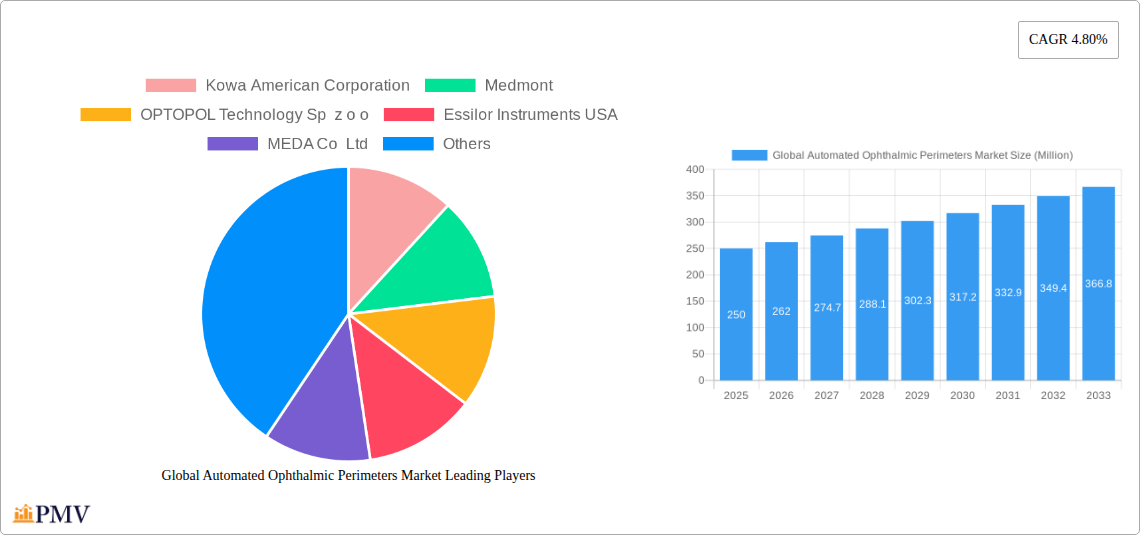
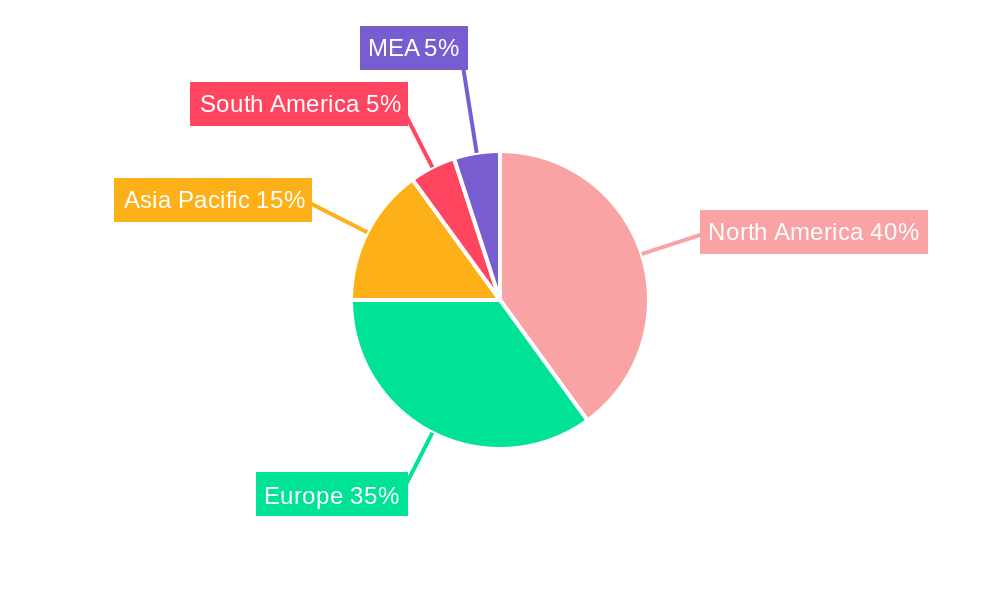
The global automated ophthalmic perimeters market, valued at approximately $250 million in 2025, is projected to experience robust growth, driven by several key factors. The increasing prevalence of glaucoma and other vision-impairing diseases necessitates advanced diagnostic tools like automated perimeters for early detection and effective management. Technological advancements, including enhanced image processing, improved software for data analysis, and integration with electronic health records (EHRs), are contributing to increased adoption. Furthermore, the rising geriatric population, a significant demographic prone to age-related eye conditions, fuels market expansion. The market is segmented by product type (static and kinetic) and end-user (hospitals, ophthalmic clinics, and others), with hospitals and ophthalmic clinics representing the major segments. While the market faces restraints such as high initial investment costs for advanced equipment and the availability of less expensive, alternative diagnostic methods, these are offset by the long-term benefits of early disease detection and improved patient outcomes. Geographic expansion, particularly in emerging economies with growing healthcare infrastructure, presents significant growth opportunities. North America and Europe currently dominate the market, but Asia Pacific is expected to witness the fastest growth rate over the forecast period (2025-2033) due to increasing healthcare expenditure and rising awareness of eye health.
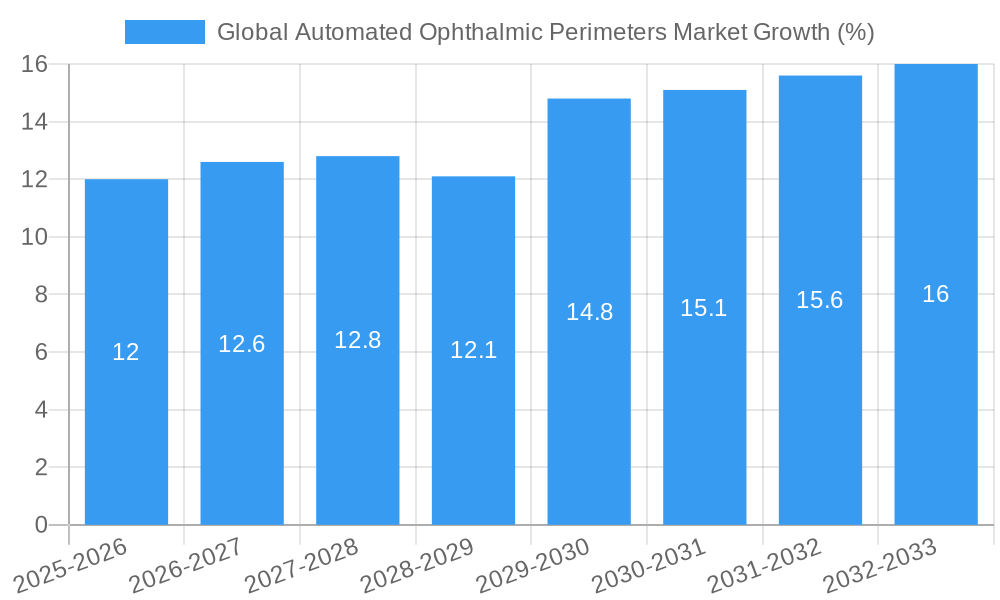
The forecast period of 2025-2033 anticipates a sustained compound annual growth rate (CAGR) of 4.80%. This growth will be propelled by the continued development of more sophisticated and user-friendly automated perimeters, coupled with ongoing efforts to improve healthcare access and affordability in both developed and developing nations. Key players in the market, including Kowa American Corporation, Medmont, OPTOPOL Technology, Essilor Instruments USA, and ZEISS International, are actively investing in research and development to enhance product offerings and expand their market reach. Competitive strategies, such as strategic partnerships, mergers, and acquisitions, are likely to shape the market landscape in the coming years. The focus will remain on providing accurate, efficient, and cost-effective diagnostic solutions for ophthalmologists and healthcare professionals globally.
Global Automated Ophthalmic Perimeters Market: A Comprehensive Report (2019-2033)
This in-depth report provides a comprehensive analysis of the Global Automated Ophthalmic Perimeters Market, offering invaluable insights for stakeholders, investors, and industry professionals. Covering the period from 2019 to 2033, with 2025 as the base and estimated year, this report meticulously examines market structure, competitive dynamics, industry trends, and future growth potential. The market is segmented by product type (Static, Kinetic) and end-user (Hospital, Ophthalmic Clinics, Others), providing a granular understanding of each segment's performance and growth trajectory. The report also features detailed profiles of key market players, including Kowa American Corporation, Medmont, OPTOPOL Technology Sp z o o, Essilor Instruments USA, MEDA Co Ltd, ZEISS International, NIDEK CO LTD, Metrovision, HAAG-STREIT GROUP, and OCULUS Inc.
Global Automated Ophthalmic Perimeters Market Market Structure & Competitive Dynamics
The global automated ophthalmic perimeters market exhibits a moderately concentrated structure, with the top five players holding an estimated xx% market share in 2025. Innovation is driven by continuous advancements in image processing, software algorithms, and hardware miniaturization, leading to improved diagnostic accuracy and patient comfort. Regulatory frameworks, varying across regions, influence market access and product approvals. Substitutes, such as manual perimetry, remain available but face limitations in speed, accuracy, and standardization. End-user trends show a growing preference for automated systems due to their efficiency and objective data output. M&A activity in the sector has been moderate, with a few significant deals recorded in the past five years, totaling an estimated xx Million USD in value. This activity highlights the industry's efforts to expand market presence and enhance product portfolios. The competitive landscape is further characterized by ongoing collaborations between companies and research institutions to develop advanced features and improve clinical outcomes. These factors collectively shape the competitive dynamics and influence market growth projections.
Global Automated Ophthalmic Perimeters Market Industry Trends & Insights
The global automated ophthalmic perimeters market is poised for significant growth, with a projected CAGR of xx% during the forecast period (2025-2033). This growth is primarily driven by the increasing prevalence of glaucoma and other vision disorders requiring precise visual field testing, the rising adoption of advanced imaging techniques, and the growing preference for automated systems in healthcare settings. Technological disruptions, such as the integration of artificial intelligence and machine learning algorithms, are enhancing diagnostic accuracy and efficiency. Consumer preferences are shifting towards non-invasive, user-friendly, and readily available systems. Increased government investments in healthcare infrastructure, particularly in emerging economies, also contribute to market expansion. The market penetration of automated ophthalmic perimeters is steadily increasing, particularly in developed countries, with a projected market penetration rate of xx% by 2033. The competitive dynamics are characterized by ongoing product innovation, strategic partnerships, and expanding global reach.
Dominant Markets & Segments in Global Automated Ophthalmic Perimeters Market
Leading Region: North America currently holds the largest market share, driven by high healthcare expenditure, advanced healthcare infrastructure, and a high prevalence of age-related eye diseases.
Leading Country: The United States represents a significant portion of the North American market due to its well-developed healthcare system and high adoption rates of advanced medical technologies.
Dominant Product Segment: The kinetic segment is expected to maintain its dominance owing to its superior accuracy and ability to detect subtle visual field defects. The static segment maintains a significant presence due to its cost-effectiveness and simpler operation.
Leading End-User Segment: Hospitals continue to be the largest end-user segment, driven by their extensive patient base and investment in advanced diagnostic tools. Ophthalmic clinics are showing strong growth due to increasing awareness of early detection and treatment. Other end-users include research institutions and specialized eye care centers.
Key Drivers for Dominance:
- High prevalence of glaucoma and other vision disorders: The aging global population and increased awareness of eye health are significant factors driving market growth.
- Favorable regulatory environment: Approvals and reimbursement policies vary by region, but supportive regulations in key markets contribute to market expansion.
- Economic growth and healthcare investment: Higher disposable income and increased public and private investment in healthcare facilities are driving adoption of advanced diagnostic technology.
- Technological advancements: Continuous innovation in automated perimetry systems enhances diagnostic accuracy and patient experience.
Global Automated Ophthalmic Perimeters Market Product Innovations
Recent years have witnessed significant advancements in automated ophthalmic perimeter technology. New systems incorporate features like improved image quality, faster testing protocols, and enhanced data analysis capabilities. The integration of artificial intelligence is enabling automated interpretation of results, improving diagnostic efficiency and reducing the workload on healthcare professionals. These innovations are enhancing diagnostic accuracy, streamlining workflows, and improving patient comfort, leading to wider adoption in ophthalmic practice. The market is also seeing a rise in portable and compact devices, catering to the growing need for point-of-care diagnostics. These advancements are pivotal to ensuring the market's continued growth and innovation.
Report Segmentation & Scope
Product Segmentation: The market is segmented by product type into Static Perimeters and Kinetic Perimeters. The Static Perimetry segment is projected to grow at a CAGR of xx% during the forecast period, driven by its cost-effectiveness. The Kinetic Perimetry segment, while having a higher initial cost, is expected to witness substantial growth due to its superior diagnostic capabilities and is projected to reach xx Million USD by 2033. Competitive dynamics in both segments involve product innovation and price competitiveness.
End-User Segmentation: The market is divided into Hospitals, Ophthalmic Clinics, and Others. The Hospital segment currently holds the largest market share, but the Ophthalmic Clinics segment is experiencing the fastest growth rate due to the increasing number of specialized eye care centers. The “Others” category includes research institutions and specialized eye care settings, contributing to market growth at a xx Million USD value by 2033. Competitive dynamics in this segment are driven by market access and strategic partnerships.
Key Drivers of Global Automated Ophthalmic Perimeters Market Growth
Several key factors drive the growth of the global automated ophthalmic perimeters market. The increasing prevalence of age-related eye diseases, such as glaucoma and macular degeneration, necessitates advanced diagnostic tools for early detection and timely intervention. Technological advancements, particularly in AI and image processing, are enhancing the accuracy and speed of visual field tests. Government initiatives promoting eye health awareness and increased healthcare spending are further fueling market growth. The rising adoption of automated systems in healthcare settings is another major contributing factor. Finally, the growing need for point-of-care diagnostics and the rising number of ophthalmic clinics are supporting market expansion.
Challenges in the Global Automated Ophthalmic Perimeters Market Sector
The market faces challenges including the high cost of advanced systems, which can limit accessibility in resource-constrained settings. The complexity of some devices can present barriers to adoption for smaller clinics or practices with limited training resources. Stringent regulatory approvals and reimbursement processes in certain regions can impede market entry and growth. Furthermore, competitive pressures from established players and emerging market entrants require continuous innovation and strategic adaptation. These factors affect market expansion, especially in emerging economies where purchasing power remains a constraint.
Leading Players in the Global Automated Ophthalmic Perimeters Market Market
- Kowa American Corporation
- Medmont
- OPTOPOL Technology Sp z o o
- Essilor Instruments USA
- MEDA Co Ltd
- ZEISS International
- NIDEK CO LTD
- Metrovision
- HAAG-STREIT GROUP
- OCULUS Inc
Key Developments in Global Automated Ophthalmic Perimeters Market Sector
- Jan 2023: Kowa American Corporation launched a new automated perimeter with enhanced AI-powered image analysis.
- May 2022: ZEISS International acquired a smaller competitor, expanding its product portfolio and market share.
- Oct 2021: NIDEK CO LTD secured a significant contract with a large hospital chain for the supply of automated perimeters.
- Further details on additional key developments would be included in the full report.
Strategic Global Automated Ophthalmic Perimeters Market Market Outlook
The global automated ophthalmic perimeters market exhibits substantial growth potential, driven by continued technological advancements, increasing prevalence of eye diseases, and rising healthcare expenditure globally. Strategic opportunities lie in developing cost-effective and user-friendly systems, expanding into untapped markets, and forging strategic partnerships to enhance market access. Focus on integrating AI and machine learning capabilities will further improve diagnostic accuracy and efficiency. The market's future trajectory is positive, indicating strong prospects for both established players and new entrants with innovative solutions.
Global Automated Ophthalmic Perimeters Market Segmentation
-
1. Product
- 1.1. Static
- 1.2. Kinetic
-
2. End User
- 2.1. Hospital
- 2.2. Ophthalmic Clinics
- 2.3. Others
Global Automated Ophthalmic Perimeters Market Segmentation By Geography
- 1. North America
- 2. Europe
- 3. Asia Pacific
- 4. Middle East and Africa
- 5. South America
Global Automated Ophthalmic Perimeters Market REPORT HIGHLIGHTS
| Aspects | Details |
|---|---|
| Study Period | 2019-2033 |
| Base Year | 2024 |
| Estimated Year | 2025 |
| Forecast Period | 2025-2033 |
| Historical Period | 2019-2024 |
| Growth Rate | CAGR of 4.80% from 2019-2033 |
| Segmentation |
|
Table of Contents
- 1. Introduction
- 1.1. Research Scope
- 1.2. Market Segmentation
- 1.3. Research Methodology
- 1.4. Definitions and Assumptions
- 2. Executive Summary
- 2.1. Introduction
- 3. Market Dynamics
- 3.1. Introduction
- 3.2. Market Drivers
- 3.2.1. Rise in the Prevalence of Ocular Disorders and Increase in Geriatric Population; Technological Advancement
- 3.3. Market Restrains
- 3.3.1. High Cost of Products
- 3.4. Market Trends
- 3.4.1. Static segment is Expected to Hold a Significant Share Over the Forecast Period
- 4. Market Factor Analysis
- 4.1. Porters Five Forces
- 4.2. Supply/Value Chain
- 4.3. PESTEL analysis
- 4.4. Market Entropy
- 4.5. Patent/Trademark Analysis
- 5. Global Automated Ophthalmic Perimeters Market Analysis, Insights and Forecast, 2019-2031
- 5.1. Market Analysis, Insights and Forecast - by Product
- 5.1.1. Static
- 5.1.2. Kinetic
- 5.2. Market Analysis, Insights and Forecast - by End User
- 5.2.1. Hospital
- 5.2.2. Ophthalmic Clinics
- 5.2.3. Others
- 5.3. Market Analysis, Insights and Forecast - by Region
- 5.3.1. North America
- 5.3.2. Europe
- 5.3.3. Asia Pacific
- 5.3.4. Middle East and Africa
- 5.3.5. South America
- 5.1. Market Analysis, Insights and Forecast - by Product
- 6. North America Global Automated Ophthalmic Perimeters Market Analysis, Insights and Forecast, 2019-2031
- 6.1. Market Analysis, Insights and Forecast - by Product
- 6.1.1. Static
- 6.1.2. Kinetic
- 6.2. Market Analysis, Insights and Forecast - by End User
- 6.2.1. Hospital
- 6.2.2. Ophthalmic Clinics
- 6.2.3. Others
- 6.1. Market Analysis, Insights and Forecast - by Product
- 7. Europe Global Automated Ophthalmic Perimeters Market Analysis, Insights and Forecast, 2019-2031
- 7.1. Market Analysis, Insights and Forecast - by Product
- 7.1.1. Static
- 7.1.2. Kinetic
- 7.2. Market Analysis, Insights and Forecast - by End User
- 7.2.1. Hospital
- 7.2.2. Ophthalmic Clinics
- 7.2.3. Others
- 7.1. Market Analysis, Insights and Forecast - by Product
- 8. Asia Pacific Global Automated Ophthalmic Perimeters Market Analysis, Insights and Forecast, 2019-2031
- 8.1. Market Analysis, Insights and Forecast - by Product
- 8.1.1. Static
- 8.1.2. Kinetic
- 8.2. Market Analysis, Insights and Forecast - by End User
- 8.2.1. Hospital
- 8.2.2. Ophthalmic Clinics
- 8.2.3. Others
- 8.1. Market Analysis, Insights and Forecast - by Product
- 9. Middle East and Africa Global Automated Ophthalmic Perimeters Market Analysis, Insights and Forecast, 2019-2031
- 9.1. Market Analysis, Insights and Forecast - by Product
- 9.1.1. Static
- 9.1.2. Kinetic
- 9.2. Market Analysis, Insights and Forecast - by End User
- 9.2.1. Hospital
- 9.2.2. Ophthalmic Clinics
- 9.2.3. Others
- 9.1. Market Analysis, Insights and Forecast - by Product
- 10. South America Global Automated Ophthalmic Perimeters Market Analysis, Insights and Forecast, 2019-2031
- 10.1. Market Analysis, Insights and Forecast - by Product
- 10.1.1. Static
- 10.1.2. Kinetic
- 10.2. Market Analysis, Insights and Forecast - by End User
- 10.2.1. Hospital
- 10.2.2. Ophthalmic Clinics
- 10.2.3. Others
- 10.1. Market Analysis, Insights and Forecast - by Product
- 11. North America Global Automated Ophthalmic Perimeters Market Analysis, Insights and Forecast, 2019-2031
- 11.1. Market Analysis, Insights and Forecast - By Country/Sub-region
- 11.1.1 United States
- 11.1.2 Canada
- 11.1.3 Mexico
- 12. Europe Global Automated Ophthalmic Perimeters Market Analysis, Insights and Forecast, 2019-2031
- 12.1. Market Analysis, Insights and Forecast - By Country/Sub-region
- 12.1.1 Germany
- 12.1.2 United Kingdom
- 12.1.3 France
- 12.1.4 Spain
- 12.1.5 Italy
- 12.1.6 Spain
- 12.1.7 Belgium
- 12.1.8 Netherland
- 12.1.9 Nordics
- 12.1.10 Rest of Europe
- 13. Asia Pacific Global Automated Ophthalmic Perimeters Market Analysis, Insights and Forecast, 2019-2031
- 13.1. Market Analysis, Insights and Forecast - By Country/Sub-region
- 13.1.1 China
- 13.1.2 Japan
- 13.1.3 India
- 13.1.4 South Korea
- 13.1.5 Southeast Asia
- 13.1.6 Australia
- 13.1.7 Indonesia
- 13.1.8 Phillipes
- 13.1.9 Singapore
- 13.1.10 Thailandc
- 13.1.11 Rest of Asia Pacific
- 14. South America Global Automated Ophthalmic Perimeters Market Analysis, Insights and Forecast, 2019-2031
- 14.1. Market Analysis, Insights and Forecast - By Country/Sub-region
- 14.1.1 Brazil
- 14.1.2 Argentina
- 14.1.3 Peru
- 14.1.4 Chile
- 14.1.5 Colombia
- 14.1.6 Ecuador
- 14.1.7 Venezuela
- 14.1.8 Rest of South America
- 15. MEA Global Automated Ophthalmic Perimeters Market Analysis, Insights and Forecast, 2019-2031
- 15.1. Market Analysis, Insights and Forecast - By Country/Sub-region
- 15.1.1 United Arab Emirates
- 15.1.2 Saudi Arabia
- 15.1.3 South Africa
- 15.1.4 Rest of Middle East and Africa
- 16. Competitive Analysis
- 16.1. Market Share Analysis 2024
- 16.2. Company Profiles
- 16.2.1 Kowa American Corporation
- 16.2.1.1. Overview
- 16.2.1.2. Products
- 16.2.1.3. SWOT Analysis
- 16.2.1.4. Recent Developments
- 16.2.1.5. Financials (Based on Availability)
- 16.2.2 Medmont
- 16.2.2.1. Overview
- 16.2.2.2. Products
- 16.2.2.3. SWOT Analysis
- 16.2.2.4. Recent Developments
- 16.2.2.5. Financials (Based on Availability)
- 16.2.3 OPTOPOL Technology Sp z o o
- 16.2.3.1. Overview
- 16.2.3.2. Products
- 16.2.3.3. SWOT Analysis
- 16.2.3.4. Recent Developments
- 16.2.3.5. Financials (Based on Availability)
- 16.2.4 Essilor Instruments USA
- 16.2.4.1. Overview
- 16.2.4.2. Products
- 16.2.4.3. SWOT Analysis
- 16.2.4.4. Recent Developments
- 16.2.4.5. Financials (Based on Availability)
- 16.2.5 MEDA Co Ltd
- 16.2.5.1. Overview
- 16.2.5.2. Products
- 16.2.5.3. SWOT Analysis
- 16.2.5.4. Recent Developments
- 16.2.5.5. Financials (Based on Availability)
- 16.2.6 ZEISS International
- 16.2.6.1. Overview
- 16.2.6.2. Products
- 16.2.6.3. SWOT Analysis
- 16.2.6.4. Recent Developments
- 16.2.6.5. Financials (Based on Availability)
- 16.2.7 NIDEK CO LTD
- 16.2.7.1. Overview
- 16.2.7.2. Products
- 16.2.7.3. SWOT Analysis
- 16.2.7.4. Recent Developments
- 16.2.7.5. Financials (Based on Availability)
- 16.2.8 Metrovision
- 16.2.8.1. Overview
- 16.2.8.2. Products
- 16.2.8.3. SWOT Analysis
- 16.2.8.4. Recent Developments
- 16.2.8.5. Financials (Based on Availability)
- 16.2.9 HAAG-STREIT GROUP
- 16.2.9.1. Overview
- 16.2.9.2. Products
- 16.2.9.3. SWOT Analysis
- 16.2.9.4. Recent Developments
- 16.2.9.5. Financials (Based on Availability)
- 16.2.10 OCULUS Inc
- 16.2.10.1. Overview
- 16.2.10.2. Products
- 16.2.10.3. SWOT Analysis
- 16.2.10.4. Recent Developments
- 16.2.10.5. Financials (Based on Availability)
- 16.2.1 Kowa American Corporation
List of Figures
- Figure 1: Global Global Automated Ophthalmic Perimeters Market Revenue Breakdown (Million, %) by Region 2024 & 2032
- Figure 2: North America Global Automated Ophthalmic Perimeters Market Revenue (Million), by Country 2024 & 2032
- Figure 3: North America Global Automated Ophthalmic Perimeters Market Revenue Share (%), by Country 2024 & 2032
- Figure 4: Europe Global Automated Ophthalmic Perimeters Market Revenue (Million), by Country 2024 & 2032
- Figure 5: Europe Global Automated Ophthalmic Perimeters Market Revenue Share (%), by Country 2024 & 2032
- Figure 6: Asia Pacific Global Automated Ophthalmic Perimeters Market Revenue (Million), by Country 2024 & 2032
- Figure 7: Asia Pacific Global Automated Ophthalmic Perimeters Market Revenue Share (%), by Country 2024 & 2032
- Figure 8: South America Global Automated Ophthalmic Perimeters Market Revenue (Million), by Country 2024 & 2032
- Figure 9: South America Global Automated Ophthalmic Perimeters Market Revenue Share (%), by Country 2024 & 2032
- Figure 10: MEA Global Automated Ophthalmic Perimeters Market Revenue (Million), by Country 2024 & 2032
- Figure 11: MEA Global Automated Ophthalmic Perimeters Market Revenue Share (%), by Country 2024 & 2032
- Figure 12: North America Global Automated Ophthalmic Perimeters Market Revenue (Million), by Product 2024 & 2032
- Figure 13: North America Global Automated Ophthalmic Perimeters Market Revenue Share (%), by Product 2024 & 2032
- Figure 14: North America Global Automated Ophthalmic Perimeters Market Revenue (Million), by End User 2024 & 2032
- Figure 15: North America Global Automated Ophthalmic Perimeters Market Revenue Share (%), by End User 2024 & 2032
- Figure 16: North America Global Automated Ophthalmic Perimeters Market Revenue (Million), by Country 2024 & 2032
- Figure 17: North America Global Automated Ophthalmic Perimeters Market Revenue Share (%), by Country 2024 & 2032
- Figure 18: Europe Global Automated Ophthalmic Perimeters Market Revenue (Million), by Product 2024 & 2032
- Figure 19: Europe Global Automated Ophthalmic Perimeters Market Revenue Share (%), by Product 2024 & 2032
- Figure 20: Europe Global Automated Ophthalmic Perimeters Market Revenue (Million), by End User 2024 & 2032
- Figure 21: Europe Global Automated Ophthalmic Perimeters Market Revenue Share (%), by End User 2024 & 2032
- Figure 22: Europe Global Automated Ophthalmic Perimeters Market Revenue (Million), by Country 2024 & 2032
- Figure 23: Europe Global Automated Ophthalmic Perimeters Market Revenue Share (%), by Country 2024 & 2032
- Figure 24: Asia Pacific Global Automated Ophthalmic Perimeters Market Revenue (Million), by Product 2024 & 2032
- Figure 25: Asia Pacific Global Automated Ophthalmic Perimeters Market Revenue Share (%), by Product 2024 & 2032
- Figure 26: Asia Pacific Global Automated Ophthalmic Perimeters Market Revenue (Million), by End User 2024 & 2032
- Figure 27: Asia Pacific Global Automated Ophthalmic Perimeters Market Revenue Share (%), by End User 2024 & 2032
- Figure 28: Asia Pacific Global Automated Ophthalmic Perimeters Market Revenue (Million), by Country 2024 & 2032
- Figure 29: Asia Pacific Global Automated Ophthalmic Perimeters Market Revenue Share (%), by Country 2024 & 2032
- Figure 30: Middle East and Africa Global Automated Ophthalmic Perimeters Market Revenue (Million), by Product 2024 & 2032
- Figure 31: Middle East and Africa Global Automated Ophthalmic Perimeters Market Revenue Share (%), by Product 2024 & 2032
- Figure 32: Middle East and Africa Global Automated Ophthalmic Perimeters Market Revenue (Million), by End User 2024 & 2032
- Figure 33: Middle East and Africa Global Automated Ophthalmic Perimeters Market Revenue Share (%), by End User 2024 & 2032
- Figure 34: Middle East and Africa Global Automated Ophthalmic Perimeters Market Revenue (Million), by Country 2024 & 2032
- Figure 35: Middle East and Africa Global Automated Ophthalmic Perimeters Market Revenue Share (%), by Country 2024 & 2032
- Figure 36: South America Global Automated Ophthalmic Perimeters Market Revenue (Million), by Product 2024 & 2032
- Figure 37: South America Global Automated Ophthalmic Perimeters Market Revenue Share (%), by Product 2024 & 2032
- Figure 38: South America Global Automated Ophthalmic Perimeters Market Revenue (Million), by End User 2024 & 2032
- Figure 39: South America Global Automated Ophthalmic Perimeters Market Revenue Share (%), by End User 2024 & 2032
- Figure 40: South America Global Automated Ophthalmic Perimeters Market Revenue (Million), by Country 2024 & 2032
- Figure 41: South America Global Automated Ophthalmic Perimeters Market Revenue Share (%), by Country 2024 & 2032
List of Tables
- Table 1: Global Automated Ophthalmic Perimeters Market Revenue Million Forecast, by Region 2019 & 2032
- Table 2: Global Automated Ophthalmic Perimeters Market Revenue Million Forecast, by Product 2019 & 2032
- Table 3: Global Automated Ophthalmic Perimeters Market Revenue Million Forecast, by End User 2019 & 2032
- Table 4: Global Automated Ophthalmic Perimeters Market Revenue Million Forecast, by Region 2019 & 2032
- Table 5: Global Automated Ophthalmic Perimeters Market Revenue Million Forecast, by Country 2019 & 2032
- Table 6: United States Global Automated Ophthalmic Perimeters Market Revenue (Million) Forecast, by Application 2019 & 2032
- Table 7: Canada Global Automated Ophthalmic Perimeters Market Revenue (Million) Forecast, by Application 2019 & 2032
- Table 8: Mexico Global Automated Ophthalmic Perimeters Market Revenue (Million) Forecast, by Application 2019 & 2032
- Table 9: Global Automated Ophthalmic Perimeters Market Revenue Million Forecast, by Country 2019 & 2032
- Table 10: Germany Global Automated Ophthalmic Perimeters Market Revenue (Million) Forecast, by Application 2019 & 2032
- Table 11: United Kingdom Global Automated Ophthalmic Perimeters Market Revenue (Million) Forecast, by Application 2019 & 2032
- Table 12: France Global Automated Ophthalmic Perimeters Market Revenue (Million) Forecast, by Application 2019 & 2032
- Table 13: Spain Global Automated Ophthalmic Perimeters Market Revenue (Million) Forecast, by Application 2019 & 2032
- Table 14: Italy Global Automated Ophthalmic Perimeters Market Revenue (Million) Forecast, by Application 2019 & 2032
- Table 15: Spain Global Automated Ophthalmic Perimeters Market Revenue (Million) Forecast, by Application 2019 & 2032
- Table 16: Belgium Global Automated Ophthalmic Perimeters Market Revenue (Million) Forecast, by Application 2019 & 2032
- Table 17: Netherland Global Automated Ophthalmic Perimeters Market Revenue (Million) Forecast, by Application 2019 & 2032
- Table 18: Nordics Global Automated Ophthalmic Perimeters Market Revenue (Million) Forecast, by Application 2019 & 2032
- Table 19: Rest of Europe Global Automated Ophthalmic Perimeters Market Revenue (Million) Forecast, by Application 2019 & 2032
- Table 20: Global Automated Ophthalmic Perimeters Market Revenue Million Forecast, by Country 2019 & 2032
- Table 21: China Global Automated Ophthalmic Perimeters Market Revenue (Million) Forecast, by Application 2019 & 2032
- Table 22: Japan Global Automated Ophthalmic Perimeters Market Revenue (Million) Forecast, by Application 2019 & 2032
- Table 23: India Global Automated Ophthalmic Perimeters Market Revenue (Million) Forecast, by Application 2019 & 2032
- Table 24: South Korea Global Automated Ophthalmic Perimeters Market Revenue (Million) Forecast, by Application 2019 & 2032
- Table 25: Southeast Asia Global Automated Ophthalmic Perimeters Market Revenue (Million) Forecast, by Application 2019 & 2032
- Table 26: Australia Global Automated Ophthalmic Perimeters Market Revenue (Million) Forecast, by Application 2019 & 2032
- Table 27: Indonesia Global Automated Ophthalmic Perimeters Market Revenue (Million) Forecast, by Application 2019 & 2032
- Table 28: Phillipes Global Automated Ophthalmic Perimeters Market Revenue (Million) Forecast, by Application 2019 & 2032
- Table 29: Singapore Global Automated Ophthalmic Perimeters Market Revenue (Million) Forecast, by Application 2019 & 2032
- Table 30: Thailandc Global Automated Ophthalmic Perimeters Market Revenue (Million) Forecast, by Application 2019 & 2032
- Table 31: Rest of Asia Pacific Global Automated Ophthalmic Perimeters Market Revenue (Million) Forecast, by Application 2019 & 2032
- Table 32: Global Automated Ophthalmic Perimeters Market Revenue Million Forecast, by Country 2019 & 2032
- Table 33: Brazil Global Automated Ophthalmic Perimeters Market Revenue (Million) Forecast, by Application 2019 & 2032
- Table 34: Argentina Global Automated Ophthalmic Perimeters Market Revenue (Million) Forecast, by Application 2019 & 2032
- Table 35: Peru Global Automated Ophthalmic Perimeters Market Revenue (Million) Forecast, by Application 2019 & 2032
- Table 36: Chile Global Automated Ophthalmic Perimeters Market Revenue (Million) Forecast, by Application 2019 & 2032
- Table 37: Colombia Global Automated Ophthalmic Perimeters Market Revenue (Million) Forecast, by Application 2019 & 2032
- Table 38: Ecuador Global Automated Ophthalmic Perimeters Market Revenue (Million) Forecast, by Application 2019 & 2032
- Table 39: Venezuela Global Automated Ophthalmic Perimeters Market Revenue (Million) Forecast, by Application 2019 & 2032
- Table 40: Rest of South America Global Automated Ophthalmic Perimeters Market Revenue (Million) Forecast, by Application 2019 & 2032
- Table 41: Global Automated Ophthalmic Perimeters Market Revenue Million Forecast, by Country 2019 & 2032
- Table 42: United Arab Emirates Global Automated Ophthalmic Perimeters Market Revenue (Million) Forecast, by Application 2019 & 2032
- Table 43: Saudi Arabia Global Automated Ophthalmic Perimeters Market Revenue (Million) Forecast, by Application 2019 & 2032
- Table 44: South Africa Global Automated Ophthalmic Perimeters Market Revenue (Million) Forecast, by Application 2019 & 2032
- Table 45: Rest of Middle East and Africa Global Automated Ophthalmic Perimeters Market Revenue (Million) Forecast, by Application 2019 & 2032
- Table 46: Global Automated Ophthalmic Perimeters Market Revenue Million Forecast, by Product 2019 & 2032
- Table 47: Global Automated Ophthalmic Perimeters Market Revenue Million Forecast, by End User 2019 & 2032
- Table 48: Global Automated Ophthalmic Perimeters Market Revenue Million Forecast, by Country 2019 & 2032
- Table 49: Global Automated Ophthalmic Perimeters Market Revenue Million Forecast, by Product 2019 & 2032
- Table 50: Global Automated Ophthalmic Perimeters Market Revenue Million Forecast, by End User 2019 & 2032
- Table 51: Global Automated Ophthalmic Perimeters Market Revenue Million Forecast, by Country 2019 & 2032
- Table 52: Global Automated Ophthalmic Perimeters Market Revenue Million Forecast, by Product 2019 & 2032
- Table 53: Global Automated Ophthalmic Perimeters Market Revenue Million Forecast, by End User 2019 & 2032
- Table 54: Global Automated Ophthalmic Perimeters Market Revenue Million Forecast, by Country 2019 & 2032
- Table 55: Global Automated Ophthalmic Perimeters Market Revenue Million Forecast, by Product 2019 & 2032
- Table 56: Global Automated Ophthalmic Perimeters Market Revenue Million Forecast, by End User 2019 & 2032
- Table 57: Global Automated Ophthalmic Perimeters Market Revenue Million Forecast, by Country 2019 & 2032
- Table 58: Global Automated Ophthalmic Perimeters Market Revenue Million Forecast, by Product 2019 & 2032
- Table 59: Global Automated Ophthalmic Perimeters Market Revenue Million Forecast, by End User 2019 & 2032
- Table 60: Global Automated Ophthalmic Perimeters Market Revenue Million Forecast, by Country 2019 & 2032
Frequently Asked Questions
1. What is the projected Compound Annual Growth Rate (CAGR) of the Global Automated Ophthalmic Perimeters Market?
The projected CAGR is approximately 4.80%.
2. Which companies are prominent players in the Global Automated Ophthalmic Perimeters Market?
Key companies in the market include Kowa American Corporation, Medmont, OPTOPOL Technology Sp z o o, Essilor Instruments USA, MEDA Co Ltd, ZEISS International, NIDEK CO LTD, Metrovision, HAAG-STREIT GROUP, OCULUS Inc.
3. What are the main segments of the Global Automated Ophthalmic Perimeters Market?
The market segments include Product, End User.
4. Can you provide details about the market size?
The market size is estimated to be USD XX Million as of 2022.
5. What are some drivers contributing to market growth?
Rise in the Prevalence of Ocular Disorders and Increase in Geriatric Population; Technological Advancement.
6. What are the notable trends driving market growth?
Static segment is Expected to Hold a Significant Share Over the Forecast Period.
7. Are there any restraints impacting market growth?
High Cost of Products.
8. Can you provide examples of recent developments in the market?
N/A
9. What pricing options are available for accessing the report?
Pricing options include single-user, multi-user, and enterprise licenses priced at USD 4750, USD 5250, and USD 8750 respectively.
10. Is the market size provided in terms of value or volume?
The market size is provided in terms of value, measured in Million.
11. Are there any specific market keywords associated with the report?
Yes, the market keyword associated with the report is "Global Automated Ophthalmic Perimeters Market," which aids in identifying and referencing the specific market segment covered.
12. How do I determine which pricing option suits my needs best?
The pricing options vary based on user requirements and access needs. Individual users may opt for single-user licenses, while businesses requiring broader access may choose multi-user or enterprise licenses for cost-effective access to the report.
13. Are there any additional resources or data provided in the Global Automated Ophthalmic Perimeters Market report?
While the report offers comprehensive insights, it's advisable to review the specific contents or supplementary materials provided to ascertain if additional resources or data are available.
14. How can I stay updated on further developments or reports in the Global Automated Ophthalmic Perimeters Market?
To stay informed about further developments, trends, and reports in the Global Automated Ophthalmic Perimeters Market, consider subscribing to industry newsletters, following relevant companies and organizations, or regularly checking reputable industry news sources and publications.
Methodology
Step 1 - Identification of Relevant Samples Size from Population Database


Step 2 - Approaches for Defining Global Market Size (Value, Volume* & Price*)

Note*: In applicable scenarios
Step 3 - Data Sources
Primary Research
- Web Analytics
- Survey Reports
- Research Institute
- Latest Research Reports
- Opinion Leaders
Secondary Research
- Annual Reports
- White Paper
- Latest Press Release
- Industry Association
- Paid Database
- Investor Presentations

Step 4 - Data Triangulation
Involves using different sources of information in order to increase the validity of a study
These sources are likely to be stakeholders in a program - participants, other researchers, program staff, other community members, and so on.
Then we put all data in single framework & apply various statistical tools to find out the dynamic on the market.
During the analysis stage, feedback from the stakeholder groups would be compared to determine areas of agreement as well as areas of divergence


