
Key Insights
The global automated liquid handling system market is experiencing robust growth, driven by the increasing demand for high-throughput screening in pharmaceutical and biotechnology research, coupled with the rising adoption of automation in clinical diagnostics. The market's 6.80% CAGR indicates a significant expansion, projected to reach a substantial value by 2033. This growth is fueled by several key factors. Firstly, the need for improved accuracy, precision, and speed in liquid handling processes is compelling researchers and laboratories to adopt automated systems. Secondly, the growing complexity of research projects and the need to handle larger sample volumes are contributing to higher adoption rates. The market segmentation reveals a strong preference for automated liquid handling systems over semi-automated ones, reflecting the efficiency gains sought by the industry. Within product segments, liquid handling workstations and pipettors hold the largest market share, although microplate reagent dispensers and washers are witnessing significant growth owing to their critical role in high-throughput applications. The pharmaceutical and biotechnology sector remains the dominant end-user, followed by contract research organizations (CROs) and academic institutions. Geographically, North America and Europe currently hold the largest market shares, driven by well-established research infrastructure and higher adoption rates of advanced technologies. However, the Asia-Pacific region is expected to exhibit the fastest growth in the coming years due to increasing investments in research and development, a growing pharmaceutical industry, and a burgeoning life sciences sector.
The competitive landscape is characterized by both large multinational corporations and specialized niche players. Key players such as Thermo Fisher Scientific, Becton Dickinson, and Tecan Group are leveraging their established brand reputation and extensive distribution networks to maintain their market leadership. However, smaller, innovative companies are focusing on developing specialized solutions and disruptive technologies to gain market share. The ongoing technological advancements, such as the integration of artificial intelligence and robotics, are further expected to propel market growth. Future trends will include miniaturization of systems, increased integration with other laboratory automation technologies, and the rise of cloud-connected devices for remote monitoring and data management. Regulatory changes impacting the pharmaceutical and biotechnology industries will also play a crucial role in shaping the market's trajectory. Strategic collaborations, mergers, and acquisitions are anticipated to be key strategies employed by market players to expand their reach and product portfolios.
Global Automated Liquid Handling System Market: A Comprehensive Report (2019-2033)
This comprehensive report provides a detailed analysis of the global automated liquid handling system market, offering invaluable insights for industry stakeholders, investors, and researchers. Covering the period from 2019 to 2033, with 2025 as the base year, this report projects market growth and identifies key trends shaping the future of this dynamic sector. The study meticulously segments the market by type, product, and end-user, providing granular data and forecasts.
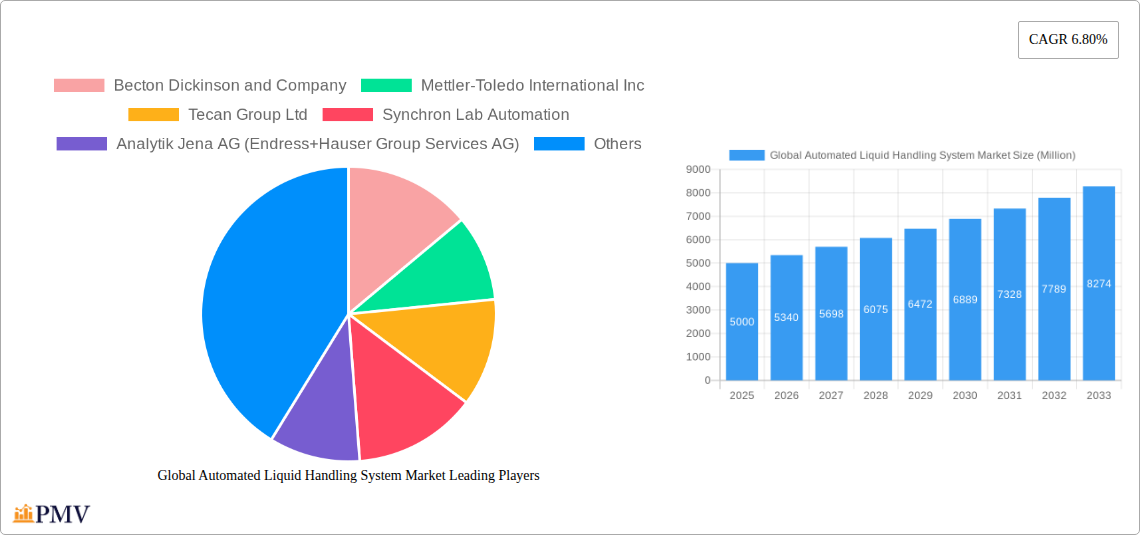
Global Automated Liquid Handling System Market Structure & Competitive Dynamics
The global automated liquid handling system market exhibits a moderately consolidated structure, with several key players holding significant market share. The market is characterized by intense competition driven by technological advancements, product innovation, and strategic mergers and acquisitions (M&A) activities. Major players like Becton Dickinson and Company, Mettler-Toledo International Inc, and Tecan Group Ltd. compete based on product features, pricing strategies, and distribution networks.
- Market Concentration: The top five players account for approximately xx% of the global market share in 2025.
- Innovation Ecosystems: Significant investments in R&D drive continuous innovation in automation, miniaturization, and integration with other laboratory technologies.
- Regulatory Frameworks: Stringent regulatory requirements regarding quality control and safety standards significantly influence market dynamics.
- Product Substitutes: Manual liquid handling systems remain a substitute, but their limited throughput and high error rates drive market adoption of automated systems.
- End-User Trends: The increasing demand for high-throughput screening and automation in pharmaceutical and biotechnology research is a key growth driver.
- M&A Activities: The market has witnessed several notable M&A activities in recent years, with deal values exceeding xx Million in the past five years, primarily aimed at expanding product portfolios and geographical reach.
Global Automated Liquid Handling System Market Industry Trends & Insights
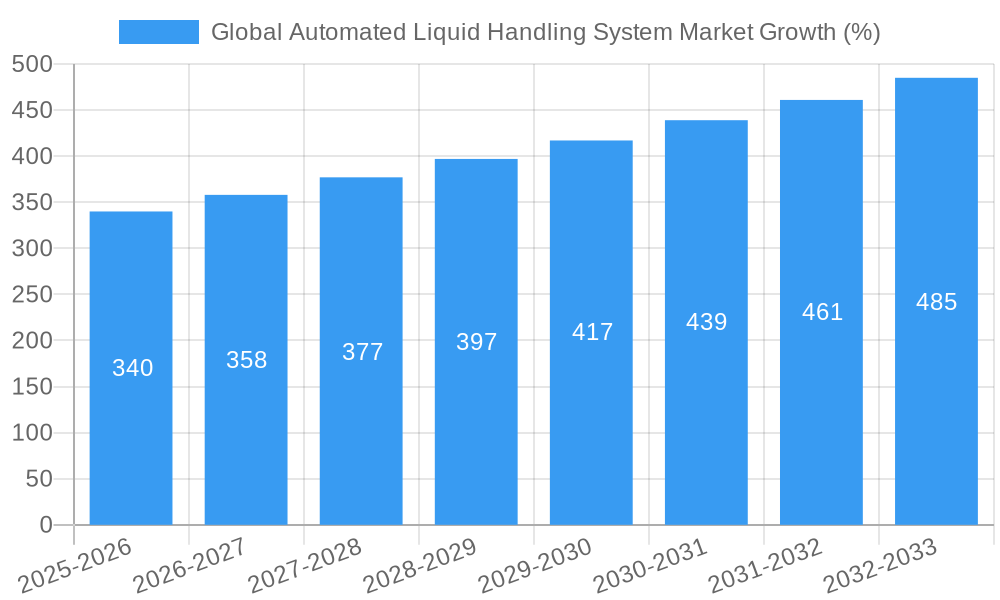
The global automated liquid handling system market is experiencing robust growth, driven by several factors. Technological advancements, including artificial intelligence (AI) and machine learning (ML) integration, are enhancing system accuracy and efficiency. Increasing demand from the pharmaceutical and biotechnology industries, coupled with the growing adoption of automation in research settings, fuels market expansion. The market is witnessing a shift towards miniaturized and more versatile systems, catering to the needs of diverse research applications.
The market exhibited a CAGR of xx% during the historical period (2019-2024) and is projected to maintain a CAGR of xx% during the forecast period (2025-2033). Market penetration of automated systems in various end-user segments is increasing steadily, driven by factors like rising labor costs and the need for improved data accuracy. The growing preference for automated systems over manual methods is also impacting market growth. Furthermore, the increasing prevalence of chronic diseases is driving demand for high-throughput screening and drug discovery research, consequently boosting the market for automated liquid handling systems.
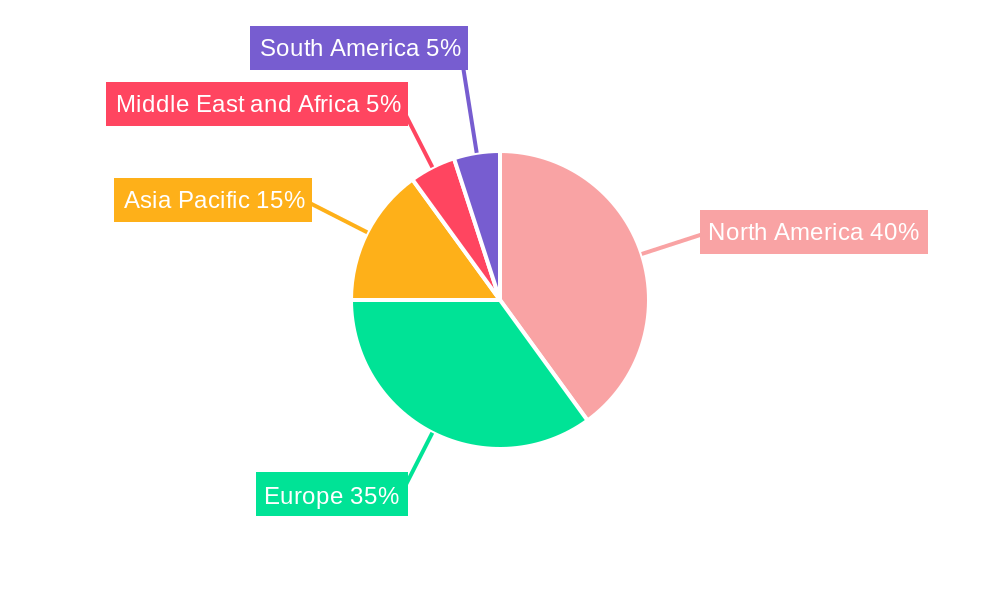
Dominant Markets & Segments in Global Automated Liquid Handling System Market
The North American region currently dominates the global automated liquid handling system market, driven by robust R&D spending, a large presence of pharmaceutical and biotechnology companies, and favorable regulatory environments. Within the market segments:
- By Type: Automated liquid handling systems hold the largest market share, exceeding xx Million in 2025, owing to their superior efficiency and accuracy.
- By Product: Liquid handling workstations represent the largest segment, accounting for xx% of the market in 2025, due to their versatility and high throughput capabilities.
- By End User: The pharmaceutical and biotechnology industry dominates the market, representing over xx% of the market share in 2025, driven by high demand for drug discovery and development.
Key Drivers for Dominant Regions/Segments:
- North America: Strong R&D investments, high adoption rates in pharmaceutical and biotech companies, and supportive regulatory frameworks.
- Pharmaceutical & Biotechnology: High demand for high-throughput screening, drug development, and quality control testing.
- Automated Liquid Handling Systems: Superior efficiency, accuracy, and reduced error rates compared to semi-automated systems.
Global Automated Liquid Handling System Market Product Innovations
Recent innovations focus on improving speed, accuracy, and ease of use. Miniaturization trends are prominent, reducing reagent consumption and increasing throughput. Integration of advanced software and AI capabilities enhances data analysis and workflow management. This leads to a better user experience, reduced operational costs, and improved reproducibility of experiments. These advancements cater to the growing demand for higher throughput and precision in various research applications.
Report Segmentation & Scope
This report segments the global automated liquid handling system market based on:
- By Type: Automated Liquid Handling System, Semi-automated Liquid Handling System. The automated segment is projected to witness the highest CAGR during the forecast period.
- By Product: Liquid Handling Workstation, Pipettors, Microplate Reagent Dispensers, Microplate Washers, Consumables, Other Products. Each segment exhibits unique growth dynamics, driven by factors such as technological advancements and specific application requirements.
- By End User: Contract Research Organizations, Pharmaceutical and Biotechnology, Academic and Research Institutes. The pharmaceutical and biotechnology sector is anticipated to experience significant growth, driven by increasing R&D investments and drug development activities.
Key Drivers of Global Automated Liquid Handling System Market Growth
The market growth is fueled by several factors:
- Technological advancements: Miniaturization, increased automation, integration with AI/ML, and improved software are key drivers.
- Economic factors: Rising R&D investments in pharmaceutical and biotechnology industries, alongside increased demand for high-throughput screening and automation, are significant contributors.
- Regulatory factors: Stringent regulatory requirements for data accuracy and quality control push the adoption of automated systems.
Challenges in the Global Automated Liquid Handling System Market Sector
Despite promising prospects, the market faces challenges:
- High initial investment costs: The acquisition and maintenance of automated systems can be expensive, particularly for smaller research labs.
- Complexity of operation: Some advanced systems necessitate specialized training and expertise for operation.
- Competitive landscape: Intense competition among established players and emerging companies puts pressure on pricing and profitability.
Leading Players in the Global Automated Liquid Handling System Market Market
- Becton Dickinson and Company
- Mettler-Toledo International Inc
- Tecan Group Ltd
- Synchron Lab Automation
- Analytik Jena AG (Endress+Hauser Group Services AG)
- Aurora Biomed Inc
- Eppendorf AG
- Formulatrix Inc
- Corning Incorporated
- Hamilton Company
- Hudson Robotics Inc
- Thermo Fisher Scientific
- Agilent Technologies
- Danaher Corporation (Beckman Coulter Inc)
- Perkin Elmer Inc
Key Developments in Global Automated Liquid Handling System Market Sector
- June 2022: Beckman Coulter Life Sciences (Danaher Corporation) launched the Biomek NGeniuS liquid handling system, enhancing accessibility to next-generation sequencing for research labs.
- February 2022: Festo introduced a modular gantry robot platform for automated liquid handling systems, accelerating the development of customized solutions.
Strategic Global Automated Liquid Handling System Market Outlook
The future of the global automated liquid handling system market is bright. Continued technological advancements, coupled with rising demand from key industries and growing adoption of automation in research, will drive significant market growth. Strategic partnerships, collaborations, and innovative product development will be critical for companies to maintain a competitive edge. The market offers substantial opportunities for expansion into emerging economies and untapped market segments.
Global Automated Liquid Handling System Market Segmentation
-
1. Type
- 1.1. Automated Liquid Handling System
- 1.2. Semi-automated Liquid Handling System
-
2. Product
- 2.1. Liquid Handling Workstation
- 2.2. Pipettors
- 2.3. Microplate Reagent Dispensers
- 2.4. Microplate Washers
- 2.5. Consumables
- 2.6. Other Products
-
3. End User
- 3.1. Contract Research Organizations
- 3.2. Pharmaceutical and Biotechnology
- 3.3. Academic and Research Institutes
Global Automated Liquid Handling System Market Segmentation By Geography
-
1. North America
- 1.1. United States
- 1.2. Canada
- 1.3. Mexico
-
2. Europe
- 2.1. Germany
- 2.2. United Kingdom
- 2.3. France
- 2.4. Italy
- 2.5. Spain
- 2.6. Rest of Europe
-
3. Asia Pacific
- 3.1. China
- 3.2. Japan
- 3.3. India
- 3.4. Australia
- 3.5. South Korea
- 3.6. Rest of Asia Pacific
-
4. Middle East and Africa
- 4.1. GCC
- 4.2. South Africa
- 4.3. Rest of Middle East and Africa
-
5. South America
- 5.1. Brazil
- 5.2. Argentina
- 5.3. Rest of South America
Global Automated Liquid Handling System Market REPORT HIGHLIGHTS
| Aspects | Details |
|---|---|
| Study Period | 2019-2033 |
| Base Year | 2024 |
| Estimated Year | 2025 |
| Forecast Period | 2025-2033 |
| Historical Period | 2019-2024 |
| Growth Rate | CAGR of 6.80% from 2019-2033 |
| Segmentation |
|
Table of Contents
- 1. Introduction
- 1.1. Research Scope
- 1.2. Market Segmentation
- 1.3. Research Methodology
- 1.4. Definitions and Assumptions
- 2. Executive Summary
- 2.1. Introduction
- 3. Market Dynamics
- 3.1. Introduction
- 3.2. Market Drivers
- 3.2.1. Flexibility and Adaptability of Lab Automation Systems; Technological Advancements in Automated Liquid Handling Systems
- 3.3. Market Restrains
- 3.3.1. Slower Adoption Rates in Small- and Medium-sized Organizations
- 3.4. Market Trends
- 3.4.1. Liquid Handling Workstation are Expected to Witness Healthy Growth Over the Forecast Period
- 4. Market Factor Analysis
- 4.1. Porters Five Forces
- 4.2. Supply/Value Chain
- 4.3. PESTEL analysis
- 4.4. Market Entropy
- 4.5. Patent/Trademark Analysis
- 5. Global Automated Liquid Handling System Market Analysis, Insights and Forecast, 2019-2031
- 5.1. Market Analysis, Insights and Forecast - by Type
- 5.1.1. Automated Liquid Handling System
- 5.1.2. Semi-automated Liquid Handling System
- 5.2. Market Analysis, Insights and Forecast - by Product
- 5.2.1. Liquid Handling Workstation
- 5.2.2. Pipettors
- 5.2.3. Microplate Reagent Dispensers
- 5.2.4. Microplate Washers
- 5.2.5. Consumables
- 5.2.6. Other Products
- 5.3. Market Analysis, Insights and Forecast - by End User
- 5.3.1. Contract Research Organizations
- 5.3.2. Pharmaceutical and Biotechnology
- 5.3.3. Academic and Research Institutes
- 5.4. Market Analysis, Insights and Forecast - by Region
- 5.4.1. North America
- 5.4.2. Europe
- 5.4.3. Asia Pacific
- 5.4.4. Middle East and Africa
- 5.4.5. South America
- 5.1. Market Analysis, Insights and Forecast - by Type
- 6. North America Global Automated Liquid Handling System Market Analysis, Insights and Forecast, 2019-2031
- 6.1. Market Analysis, Insights and Forecast - by Type
- 6.1.1. Automated Liquid Handling System
- 6.1.2. Semi-automated Liquid Handling System
- 6.2. Market Analysis, Insights and Forecast - by Product
- 6.2.1. Liquid Handling Workstation
- 6.2.2. Pipettors
- 6.2.3. Microplate Reagent Dispensers
- 6.2.4. Microplate Washers
- 6.2.5. Consumables
- 6.2.6. Other Products
- 6.3. Market Analysis, Insights and Forecast - by End User
- 6.3.1. Contract Research Organizations
- 6.3.2. Pharmaceutical and Biotechnology
- 6.3.3. Academic and Research Institutes
- 6.1. Market Analysis, Insights and Forecast - by Type
- 7. Europe Global Automated Liquid Handling System Market Analysis, Insights and Forecast, 2019-2031
- 7.1. Market Analysis, Insights and Forecast - by Type
- 7.1.1. Automated Liquid Handling System
- 7.1.2. Semi-automated Liquid Handling System
- 7.2. Market Analysis, Insights and Forecast - by Product
- 7.2.1. Liquid Handling Workstation
- 7.2.2. Pipettors
- 7.2.3. Microplate Reagent Dispensers
- 7.2.4. Microplate Washers
- 7.2.5. Consumables
- 7.2.6. Other Products
- 7.3. Market Analysis, Insights and Forecast - by End User
- 7.3.1. Contract Research Organizations
- 7.3.2. Pharmaceutical and Biotechnology
- 7.3.3. Academic and Research Institutes
- 7.1. Market Analysis, Insights and Forecast - by Type
- 8. Asia Pacific Global Automated Liquid Handling System Market Analysis, Insights and Forecast, 2019-2031
- 8.1. Market Analysis, Insights and Forecast - by Type
- 8.1.1. Automated Liquid Handling System
- 8.1.2. Semi-automated Liquid Handling System
- 8.2. Market Analysis, Insights and Forecast - by Product
- 8.2.1. Liquid Handling Workstation
- 8.2.2. Pipettors
- 8.2.3. Microplate Reagent Dispensers
- 8.2.4. Microplate Washers
- 8.2.5. Consumables
- 8.2.6. Other Products
- 8.3. Market Analysis, Insights and Forecast - by End User
- 8.3.1. Contract Research Organizations
- 8.3.2. Pharmaceutical and Biotechnology
- 8.3.3. Academic and Research Institutes
- 8.1. Market Analysis, Insights and Forecast - by Type
- 9. Middle East and Africa Global Automated Liquid Handling System Market Analysis, Insights and Forecast, 2019-2031
- 9.1. Market Analysis, Insights and Forecast - by Type
- 9.1.1. Automated Liquid Handling System
- 9.1.2. Semi-automated Liquid Handling System
- 9.2. Market Analysis, Insights and Forecast - by Product
- 9.2.1. Liquid Handling Workstation
- 9.2.2. Pipettors
- 9.2.3. Microplate Reagent Dispensers
- 9.2.4. Microplate Washers
- 9.2.5. Consumables
- 9.2.6. Other Products
- 9.3. Market Analysis, Insights and Forecast - by End User
- 9.3.1. Contract Research Organizations
- 9.3.2. Pharmaceutical and Biotechnology
- 9.3.3. Academic and Research Institutes
- 9.1. Market Analysis, Insights and Forecast - by Type
- 10. South America Global Automated Liquid Handling System Market Analysis, Insights and Forecast, 2019-2031
- 10.1. Market Analysis, Insights and Forecast - by Type
- 10.1.1. Automated Liquid Handling System
- 10.1.2. Semi-automated Liquid Handling System
- 10.2. Market Analysis, Insights and Forecast - by Product
- 10.2.1. Liquid Handling Workstation
- 10.2.2. Pipettors
- 10.2.3. Microplate Reagent Dispensers
- 10.2.4. Microplate Washers
- 10.2.5. Consumables
- 10.2.6. Other Products
- 10.3. Market Analysis, Insights and Forecast - by End User
- 10.3.1. Contract Research Organizations
- 10.3.2. Pharmaceutical and Biotechnology
- 10.3.3. Academic and Research Institutes
- 10.1. Market Analysis, Insights and Forecast - by Type
- 11. North America Global Automated Liquid Handling System Market Analysis, Insights and Forecast, 2019-2031
- 11.1. Market Analysis, Insights and Forecast - By Country/Sub-region
- 11.1.1 United States
- 11.1.2 Canada
- 11.1.3 Mexico
- 12. Europe Global Automated Liquid Handling System Market Analysis, Insights and Forecast, 2019-2031
- 12.1. Market Analysis, Insights and Forecast - By Country/Sub-region
- 12.1.1 Germany
- 12.1.2 United Kingdom
- 12.1.3 France
- 12.1.4 Italy
- 12.1.5 Spain
- 12.1.6 Rest of Europe
- 13. Asia Pacific Global Automated Liquid Handling System Market Analysis, Insights and Forecast, 2019-2031
- 13.1. Market Analysis, Insights and Forecast - By Country/Sub-region
- 13.1.1 China
- 13.1.2 Japan
- 13.1.3 India
- 13.1.4 Australia
- 13.1.5 South Korea
- 13.1.6 Rest of Asia Pacific
- 14. Middle East and Africa Global Automated Liquid Handling System Market Analysis, Insights and Forecast, 2019-2031
- 14.1. Market Analysis, Insights and Forecast - By Country/Sub-region
- 14.1.1 GCC
- 14.1.2 South Africa
- 14.1.3 Rest of Middle East and Africa
- 15. South America Global Automated Liquid Handling System Market Analysis, Insights and Forecast, 2019-2031
- 15.1. Market Analysis, Insights and Forecast - By Country/Sub-region
- 15.1.1 Brazil
- 15.1.2 Argentina
- 15.1.3 Rest of South America
- 16. Competitive Analysis
- 16.1. Market Share Analysis 2024
- 16.2. Company Profiles
- 16.2.1 Becton Dickinson and Company
- 16.2.1.1. Overview
- 16.2.1.2. Products
- 16.2.1.3. SWOT Analysis
- 16.2.1.4. Recent Developments
- 16.2.1.5. Financials (Based on Availability)
- 16.2.2 Mettler-Toledo International Inc
- 16.2.2.1. Overview
- 16.2.2.2. Products
- 16.2.2.3. SWOT Analysis
- 16.2.2.4. Recent Developments
- 16.2.2.5. Financials (Based on Availability)
- 16.2.3 Tecan Group Ltd
- 16.2.3.1. Overview
- 16.2.3.2. Products
- 16.2.3.3. SWOT Analysis
- 16.2.3.4. Recent Developments
- 16.2.3.5. Financials (Based on Availability)
- 16.2.4 Synchron Lab Automation
- 16.2.4.1. Overview
- 16.2.4.2. Products
- 16.2.4.3. SWOT Analysis
- 16.2.4.4. Recent Developments
- 16.2.4.5. Financials (Based on Availability)
- 16.2.5 Analytik Jena AG (Endress+Hauser Group Services AG)
- 16.2.5.1. Overview
- 16.2.5.2. Products
- 16.2.5.3. SWOT Analysis
- 16.2.5.4. Recent Developments
- 16.2.5.5. Financials (Based on Availability)
- 16.2.6 Aurora Biomed Inc
- 16.2.6.1. Overview
- 16.2.6.2. Products
- 16.2.6.3. SWOT Analysis
- 16.2.6.4. Recent Developments
- 16.2.6.5. Financials (Based on Availability)
- 16.2.7 Eppendorf AG
- 16.2.7.1. Overview
- 16.2.7.2. Products
- 16.2.7.3. SWOT Analysis
- 16.2.7.4. Recent Developments
- 16.2.7.5. Financials (Based on Availability)
- 16.2.8 Formulatrix Inc
- 16.2.8.1. Overview
- 16.2.8.2. Products
- 16.2.8.3. SWOT Analysis
- 16.2.8.4. Recent Developments
- 16.2.8.5. Financials (Based on Availability)
- 16.2.9 Corning Incorporated
- 16.2.9.1. Overview
- 16.2.9.2. Products
- 16.2.9.3. SWOT Analysis
- 16.2.9.4. Recent Developments
- 16.2.9.5. Financials (Based on Availability)
- 16.2.10 Hamilton Company
- 16.2.10.1. Overview
- 16.2.10.2. Products
- 16.2.10.3. SWOT Analysis
- 16.2.10.4. Recent Developments
- 16.2.10.5. Financials (Based on Availability)
- 16.2.11 Hudson Robotics Inc
- 16.2.11.1. Overview
- 16.2.11.2. Products
- 16.2.11.3. SWOT Analysis
- 16.2.11.4. Recent Developments
- 16.2.11.5. Financials (Based on Availability)
- 16.2.12 Thermo Fisher Scientific
- 16.2.12.1. Overview
- 16.2.12.2. Products
- 16.2.12.3. SWOT Analysis
- 16.2.12.4. Recent Developments
- 16.2.12.5. Financials (Based on Availability)
- 16.2.13 Agilent Technologies
- 16.2.13.1. Overview
- 16.2.13.2. Products
- 16.2.13.3. SWOT Analysis
- 16.2.13.4. Recent Developments
- 16.2.13.5. Financials (Based on Availability)
- 16.2.14 Danaher Corporation (Beckman Coulter Inc )
- 16.2.14.1. Overview
- 16.2.14.2. Products
- 16.2.14.3. SWOT Analysis
- 16.2.14.4. Recent Developments
- 16.2.14.5. Financials (Based on Availability)
- 16.2.15 Perkin Elmer Inc
- 16.2.15.1. Overview
- 16.2.15.2. Products
- 16.2.15.3. SWOT Analysis
- 16.2.15.4. Recent Developments
- 16.2.15.5. Financials (Based on Availability)
- 16.2.1 Becton Dickinson and Company
List of Figures
- Figure 1: Global Global Automated Liquid Handling System Market Revenue Breakdown (Million, %) by Region 2024 & 2032
- Figure 2: Global Global Automated Liquid Handling System Market Volume Breakdown (K Unit, %) by Region 2024 & 2032
- Figure 3: North America Global Automated Liquid Handling System Market Revenue (Million), by Country 2024 & 2032
- Figure 4: North America Global Automated Liquid Handling System Market Volume (K Unit), by Country 2024 & 2032
- Figure 5: North America Global Automated Liquid Handling System Market Revenue Share (%), by Country 2024 & 2032
- Figure 6: North America Global Automated Liquid Handling System Market Volume Share (%), by Country 2024 & 2032
- Figure 7: Europe Global Automated Liquid Handling System Market Revenue (Million), by Country 2024 & 2032
- Figure 8: Europe Global Automated Liquid Handling System Market Volume (K Unit), by Country 2024 & 2032
- Figure 9: Europe Global Automated Liquid Handling System Market Revenue Share (%), by Country 2024 & 2032
- Figure 10: Europe Global Automated Liquid Handling System Market Volume Share (%), by Country 2024 & 2032
- Figure 11: Asia Pacific Global Automated Liquid Handling System Market Revenue (Million), by Country 2024 & 2032
- Figure 12: Asia Pacific Global Automated Liquid Handling System Market Volume (K Unit), by Country 2024 & 2032
- Figure 13: Asia Pacific Global Automated Liquid Handling System Market Revenue Share (%), by Country 2024 & 2032
- Figure 14: Asia Pacific Global Automated Liquid Handling System Market Volume Share (%), by Country 2024 & 2032
- Figure 15: Middle East and Africa Global Automated Liquid Handling System Market Revenue (Million), by Country 2024 & 2032
- Figure 16: Middle East and Africa Global Automated Liquid Handling System Market Volume (K Unit), by Country 2024 & 2032
- Figure 17: Middle East and Africa Global Automated Liquid Handling System Market Revenue Share (%), by Country 2024 & 2032
- Figure 18: Middle East and Africa Global Automated Liquid Handling System Market Volume Share (%), by Country 2024 & 2032
- Figure 19: South America Global Automated Liquid Handling System Market Revenue (Million), by Country 2024 & 2032
- Figure 20: South America Global Automated Liquid Handling System Market Volume (K Unit), by Country 2024 & 2032
- Figure 21: South America Global Automated Liquid Handling System Market Revenue Share (%), by Country 2024 & 2032
- Figure 22: South America Global Automated Liquid Handling System Market Volume Share (%), by Country 2024 & 2032
- Figure 23: North America Global Automated Liquid Handling System Market Revenue (Million), by Type 2024 & 2032
- Figure 24: North America Global Automated Liquid Handling System Market Volume (K Unit), by Type 2024 & 2032
- Figure 25: North America Global Automated Liquid Handling System Market Revenue Share (%), by Type 2024 & 2032
- Figure 26: North America Global Automated Liquid Handling System Market Volume Share (%), by Type 2024 & 2032
- Figure 27: North America Global Automated Liquid Handling System Market Revenue (Million), by Product 2024 & 2032
- Figure 28: North America Global Automated Liquid Handling System Market Volume (K Unit), by Product 2024 & 2032
- Figure 29: North America Global Automated Liquid Handling System Market Revenue Share (%), by Product 2024 & 2032
- Figure 30: North America Global Automated Liquid Handling System Market Volume Share (%), by Product 2024 & 2032
- Figure 31: North America Global Automated Liquid Handling System Market Revenue (Million), by End User 2024 & 2032
- Figure 32: North America Global Automated Liquid Handling System Market Volume (K Unit), by End User 2024 & 2032
- Figure 33: North America Global Automated Liquid Handling System Market Revenue Share (%), by End User 2024 & 2032
- Figure 34: North America Global Automated Liquid Handling System Market Volume Share (%), by End User 2024 & 2032
- Figure 35: North America Global Automated Liquid Handling System Market Revenue (Million), by Country 2024 & 2032
- Figure 36: North America Global Automated Liquid Handling System Market Volume (K Unit), by Country 2024 & 2032
- Figure 37: North America Global Automated Liquid Handling System Market Revenue Share (%), by Country 2024 & 2032
- Figure 38: North America Global Automated Liquid Handling System Market Volume Share (%), by Country 2024 & 2032
- Figure 39: Europe Global Automated Liquid Handling System Market Revenue (Million), by Type 2024 & 2032
- Figure 40: Europe Global Automated Liquid Handling System Market Volume (K Unit), by Type 2024 & 2032
- Figure 41: Europe Global Automated Liquid Handling System Market Revenue Share (%), by Type 2024 & 2032
- Figure 42: Europe Global Automated Liquid Handling System Market Volume Share (%), by Type 2024 & 2032
- Figure 43: Europe Global Automated Liquid Handling System Market Revenue (Million), by Product 2024 & 2032
- Figure 44: Europe Global Automated Liquid Handling System Market Volume (K Unit), by Product 2024 & 2032
- Figure 45: Europe Global Automated Liquid Handling System Market Revenue Share (%), by Product 2024 & 2032
- Figure 46: Europe Global Automated Liquid Handling System Market Volume Share (%), by Product 2024 & 2032
- Figure 47: Europe Global Automated Liquid Handling System Market Revenue (Million), by End User 2024 & 2032
- Figure 48: Europe Global Automated Liquid Handling System Market Volume (K Unit), by End User 2024 & 2032
- Figure 49: Europe Global Automated Liquid Handling System Market Revenue Share (%), by End User 2024 & 2032
- Figure 50: Europe Global Automated Liquid Handling System Market Volume Share (%), by End User 2024 & 2032
- Figure 51: Europe Global Automated Liquid Handling System Market Revenue (Million), by Country 2024 & 2032
- Figure 52: Europe Global Automated Liquid Handling System Market Volume (K Unit), by Country 2024 & 2032
- Figure 53: Europe Global Automated Liquid Handling System Market Revenue Share (%), by Country 2024 & 2032
- Figure 54: Europe Global Automated Liquid Handling System Market Volume Share (%), by Country 2024 & 2032
- Figure 55: Asia Pacific Global Automated Liquid Handling System Market Revenue (Million), by Type 2024 & 2032
- Figure 56: Asia Pacific Global Automated Liquid Handling System Market Volume (K Unit), by Type 2024 & 2032
- Figure 57: Asia Pacific Global Automated Liquid Handling System Market Revenue Share (%), by Type 2024 & 2032
- Figure 58: Asia Pacific Global Automated Liquid Handling System Market Volume Share (%), by Type 2024 & 2032
- Figure 59: Asia Pacific Global Automated Liquid Handling System Market Revenue (Million), by Product 2024 & 2032
- Figure 60: Asia Pacific Global Automated Liquid Handling System Market Volume (K Unit), by Product 2024 & 2032
- Figure 61: Asia Pacific Global Automated Liquid Handling System Market Revenue Share (%), by Product 2024 & 2032
- Figure 62: Asia Pacific Global Automated Liquid Handling System Market Volume Share (%), by Product 2024 & 2032
- Figure 63: Asia Pacific Global Automated Liquid Handling System Market Revenue (Million), by End User 2024 & 2032
- Figure 64: Asia Pacific Global Automated Liquid Handling System Market Volume (K Unit), by End User 2024 & 2032
- Figure 65: Asia Pacific Global Automated Liquid Handling System Market Revenue Share (%), by End User 2024 & 2032
- Figure 66: Asia Pacific Global Automated Liquid Handling System Market Volume Share (%), by End User 2024 & 2032
- Figure 67: Asia Pacific Global Automated Liquid Handling System Market Revenue (Million), by Country 2024 & 2032
- Figure 68: Asia Pacific Global Automated Liquid Handling System Market Volume (K Unit), by Country 2024 & 2032
- Figure 69: Asia Pacific Global Automated Liquid Handling System Market Revenue Share (%), by Country 2024 & 2032
- Figure 70: Asia Pacific Global Automated Liquid Handling System Market Volume Share (%), by Country 2024 & 2032
- Figure 71: Middle East and Africa Global Automated Liquid Handling System Market Revenue (Million), by Type 2024 & 2032
- Figure 72: Middle East and Africa Global Automated Liquid Handling System Market Volume (K Unit), by Type 2024 & 2032
- Figure 73: Middle East and Africa Global Automated Liquid Handling System Market Revenue Share (%), by Type 2024 & 2032
- Figure 74: Middle East and Africa Global Automated Liquid Handling System Market Volume Share (%), by Type 2024 & 2032
- Figure 75: Middle East and Africa Global Automated Liquid Handling System Market Revenue (Million), by Product 2024 & 2032
- Figure 76: Middle East and Africa Global Automated Liquid Handling System Market Volume (K Unit), by Product 2024 & 2032
- Figure 77: Middle East and Africa Global Automated Liquid Handling System Market Revenue Share (%), by Product 2024 & 2032
- Figure 78: Middle East and Africa Global Automated Liquid Handling System Market Volume Share (%), by Product 2024 & 2032
- Figure 79: Middle East and Africa Global Automated Liquid Handling System Market Revenue (Million), by End User 2024 & 2032
- Figure 80: Middle East and Africa Global Automated Liquid Handling System Market Volume (K Unit), by End User 2024 & 2032
- Figure 81: Middle East and Africa Global Automated Liquid Handling System Market Revenue Share (%), by End User 2024 & 2032
- Figure 82: Middle East and Africa Global Automated Liquid Handling System Market Volume Share (%), by End User 2024 & 2032
- Figure 83: Middle East and Africa Global Automated Liquid Handling System Market Revenue (Million), by Country 2024 & 2032
- Figure 84: Middle East and Africa Global Automated Liquid Handling System Market Volume (K Unit), by Country 2024 & 2032
- Figure 85: Middle East and Africa Global Automated Liquid Handling System Market Revenue Share (%), by Country 2024 & 2032
- Figure 86: Middle East and Africa Global Automated Liquid Handling System Market Volume Share (%), by Country 2024 & 2032
- Figure 87: South America Global Automated Liquid Handling System Market Revenue (Million), by Type 2024 & 2032
- Figure 88: South America Global Automated Liquid Handling System Market Volume (K Unit), by Type 2024 & 2032
- Figure 89: South America Global Automated Liquid Handling System Market Revenue Share (%), by Type 2024 & 2032
- Figure 90: South America Global Automated Liquid Handling System Market Volume Share (%), by Type 2024 & 2032
- Figure 91: South America Global Automated Liquid Handling System Market Revenue (Million), by Product 2024 & 2032
- Figure 92: South America Global Automated Liquid Handling System Market Volume (K Unit), by Product 2024 & 2032
- Figure 93: South America Global Automated Liquid Handling System Market Revenue Share (%), by Product 2024 & 2032
- Figure 94: South America Global Automated Liquid Handling System Market Volume Share (%), by Product 2024 & 2032
- Figure 95: South America Global Automated Liquid Handling System Market Revenue (Million), by End User 2024 & 2032
- Figure 96: South America Global Automated Liquid Handling System Market Volume (K Unit), by End User 2024 & 2032
- Figure 97: South America Global Automated Liquid Handling System Market Revenue Share (%), by End User 2024 & 2032
- Figure 98: South America Global Automated Liquid Handling System Market Volume Share (%), by End User 2024 & 2032
- Figure 99: South America Global Automated Liquid Handling System Market Revenue (Million), by Country 2024 & 2032
- Figure 100: South America Global Automated Liquid Handling System Market Volume (K Unit), by Country 2024 & 2032
- Figure 101: South America Global Automated Liquid Handling System Market Revenue Share (%), by Country 2024 & 2032
- Figure 102: South America Global Automated Liquid Handling System Market Volume Share (%), by Country 2024 & 2032
List of Tables
- Table 1: Global Automated Liquid Handling System Market Revenue Million Forecast, by Region 2019 & 2032
- Table 2: Global Automated Liquid Handling System Market Volume K Unit Forecast, by Region 2019 & 2032
- Table 3: Global Automated Liquid Handling System Market Revenue Million Forecast, by Type 2019 & 2032
- Table 4: Global Automated Liquid Handling System Market Volume K Unit Forecast, by Type 2019 & 2032
- Table 5: Global Automated Liquid Handling System Market Revenue Million Forecast, by Product 2019 & 2032
- Table 6: Global Automated Liquid Handling System Market Volume K Unit Forecast, by Product 2019 & 2032
- Table 7: Global Automated Liquid Handling System Market Revenue Million Forecast, by End User 2019 & 2032
- Table 8: Global Automated Liquid Handling System Market Volume K Unit Forecast, by End User 2019 & 2032
- Table 9: Global Automated Liquid Handling System Market Revenue Million Forecast, by Region 2019 & 2032
- Table 10: Global Automated Liquid Handling System Market Volume K Unit Forecast, by Region 2019 & 2032
- Table 11: Global Automated Liquid Handling System Market Revenue Million Forecast, by Country 2019 & 2032
- Table 12: Global Automated Liquid Handling System Market Volume K Unit Forecast, by Country 2019 & 2032
- Table 13: United States Global Automated Liquid Handling System Market Revenue (Million) Forecast, by Application 2019 & 2032
- Table 14: United States Global Automated Liquid Handling System Market Volume (K Unit) Forecast, by Application 2019 & 2032
- Table 15: Canada Global Automated Liquid Handling System Market Revenue (Million) Forecast, by Application 2019 & 2032
- Table 16: Canada Global Automated Liquid Handling System Market Volume (K Unit) Forecast, by Application 2019 & 2032
- Table 17: Mexico Global Automated Liquid Handling System Market Revenue (Million) Forecast, by Application 2019 & 2032
- Table 18: Mexico Global Automated Liquid Handling System Market Volume (K Unit) Forecast, by Application 2019 & 2032
- Table 19: Global Automated Liquid Handling System Market Revenue Million Forecast, by Country 2019 & 2032
- Table 20: Global Automated Liquid Handling System Market Volume K Unit Forecast, by Country 2019 & 2032
- Table 21: Germany Global Automated Liquid Handling System Market Revenue (Million) Forecast, by Application 2019 & 2032
- Table 22: Germany Global Automated Liquid Handling System Market Volume (K Unit) Forecast, by Application 2019 & 2032
- Table 23: United Kingdom Global Automated Liquid Handling System Market Revenue (Million) Forecast, by Application 2019 & 2032
- Table 24: United Kingdom Global Automated Liquid Handling System Market Volume (K Unit) Forecast, by Application 2019 & 2032
- Table 25: France Global Automated Liquid Handling System Market Revenue (Million) Forecast, by Application 2019 & 2032
- Table 26: France Global Automated Liquid Handling System Market Volume (K Unit) Forecast, by Application 2019 & 2032
- Table 27: Italy Global Automated Liquid Handling System Market Revenue (Million) Forecast, by Application 2019 & 2032
- Table 28: Italy Global Automated Liquid Handling System Market Volume (K Unit) Forecast, by Application 2019 & 2032
- Table 29: Spain Global Automated Liquid Handling System Market Revenue (Million) Forecast, by Application 2019 & 2032
- Table 30: Spain Global Automated Liquid Handling System Market Volume (K Unit) Forecast, by Application 2019 & 2032
- Table 31: Rest of Europe Global Automated Liquid Handling System Market Revenue (Million) Forecast, by Application 2019 & 2032
- Table 32: Rest of Europe Global Automated Liquid Handling System Market Volume (K Unit) Forecast, by Application 2019 & 2032
- Table 33: Global Automated Liquid Handling System Market Revenue Million Forecast, by Country 2019 & 2032
- Table 34: Global Automated Liquid Handling System Market Volume K Unit Forecast, by Country 2019 & 2032
- Table 35: China Global Automated Liquid Handling System Market Revenue (Million) Forecast, by Application 2019 & 2032
- Table 36: China Global Automated Liquid Handling System Market Volume (K Unit) Forecast, by Application 2019 & 2032
- Table 37: Japan Global Automated Liquid Handling System Market Revenue (Million) Forecast, by Application 2019 & 2032
- Table 38: Japan Global Automated Liquid Handling System Market Volume (K Unit) Forecast, by Application 2019 & 2032
- Table 39: India Global Automated Liquid Handling System Market Revenue (Million) Forecast, by Application 2019 & 2032
- Table 40: India Global Automated Liquid Handling System Market Volume (K Unit) Forecast, by Application 2019 & 2032
- Table 41: Australia Global Automated Liquid Handling System Market Revenue (Million) Forecast, by Application 2019 & 2032
- Table 42: Australia Global Automated Liquid Handling System Market Volume (K Unit) Forecast, by Application 2019 & 2032
- Table 43: South Korea Global Automated Liquid Handling System Market Revenue (Million) Forecast, by Application 2019 & 2032
- Table 44: South Korea Global Automated Liquid Handling System Market Volume (K Unit) Forecast, by Application 2019 & 2032
- Table 45: Rest of Asia Pacific Global Automated Liquid Handling System Market Revenue (Million) Forecast, by Application 2019 & 2032
- Table 46: Rest of Asia Pacific Global Automated Liquid Handling System Market Volume (K Unit) Forecast, by Application 2019 & 2032
- Table 47: Global Automated Liquid Handling System Market Revenue Million Forecast, by Country 2019 & 2032
- Table 48: Global Automated Liquid Handling System Market Volume K Unit Forecast, by Country 2019 & 2032
- Table 49: GCC Global Automated Liquid Handling System Market Revenue (Million) Forecast, by Application 2019 & 2032
- Table 50: GCC Global Automated Liquid Handling System Market Volume (K Unit) Forecast, by Application 2019 & 2032
- Table 51: South Africa Global Automated Liquid Handling System Market Revenue (Million) Forecast, by Application 2019 & 2032
- Table 52: South Africa Global Automated Liquid Handling System Market Volume (K Unit) Forecast, by Application 2019 & 2032
- Table 53: Rest of Middle East and Africa Global Automated Liquid Handling System Market Revenue (Million) Forecast, by Application 2019 & 2032
- Table 54: Rest of Middle East and Africa Global Automated Liquid Handling System Market Volume (K Unit) Forecast, by Application 2019 & 2032
- Table 55: Global Automated Liquid Handling System Market Revenue Million Forecast, by Country 2019 & 2032
- Table 56: Global Automated Liquid Handling System Market Volume K Unit Forecast, by Country 2019 & 2032
- Table 57: Brazil Global Automated Liquid Handling System Market Revenue (Million) Forecast, by Application 2019 & 2032
- Table 58: Brazil Global Automated Liquid Handling System Market Volume (K Unit) Forecast, by Application 2019 & 2032
- Table 59: Argentina Global Automated Liquid Handling System Market Revenue (Million) Forecast, by Application 2019 & 2032
- Table 60: Argentina Global Automated Liquid Handling System Market Volume (K Unit) Forecast, by Application 2019 & 2032
- Table 61: Rest of South America Global Automated Liquid Handling System Market Revenue (Million) Forecast, by Application 2019 & 2032
- Table 62: Rest of South America Global Automated Liquid Handling System Market Volume (K Unit) Forecast, by Application 2019 & 2032
- Table 63: Global Automated Liquid Handling System Market Revenue Million Forecast, by Type 2019 & 2032
- Table 64: Global Automated Liquid Handling System Market Volume K Unit Forecast, by Type 2019 & 2032
- Table 65: Global Automated Liquid Handling System Market Revenue Million Forecast, by Product 2019 & 2032
- Table 66: Global Automated Liquid Handling System Market Volume K Unit Forecast, by Product 2019 & 2032
- Table 67: Global Automated Liquid Handling System Market Revenue Million Forecast, by End User 2019 & 2032
- Table 68: Global Automated Liquid Handling System Market Volume K Unit Forecast, by End User 2019 & 2032
- Table 69: Global Automated Liquid Handling System Market Revenue Million Forecast, by Country 2019 & 2032
- Table 70: Global Automated Liquid Handling System Market Volume K Unit Forecast, by Country 2019 & 2032
- Table 71: United States Global Automated Liquid Handling System Market Revenue (Million) Forecast, by Application 2019 & 2032
- Table 72: United States Global Automated Liquid Handling System Market Volume (K Unit) Forecast, by Application 2019 & 2032
- Table 73: Canada Global Automated Liquid Handling System Market Revenue (Million) Forecast, by Application 2019 & 2032
- Table 74: Canada Global Automated Liquid Handling System Market Volume (K Unit) Forecast, by Application 2019 & 2032
- Table 75: Mexico Global Automated Liquid Handling System Market Revenue (Million) Forecast, by Application 2019 & 2032
- Table 76: Mexico Global Automated Liquid Handling System Market Volume (K Unit) Forecast, by Application 2019 & 2032
- Table 77: Global Automated Liquid Handling System Market Revenue Million Forecast, by Type 2019 & 2032
- Table 78: Global Automated Liquid Handling System Market Volume K Unit Forecast, by Type 2019 & 2032
- Table 79: Global Automated Liquid Handling System Market Revenue Million Forecast, by Product 2019 & 2032
- Table 80: Global Automated Liquid Handling System Market Volume K Unit Forecast, by Product 2019 & 2032
- Table 81: Global Automated Liquid Handling System Market Revenue Million Forecast, by End User 2019 & 2032
- Table 82: Global Automated Liquid Handling System Market Volume K Unit Forecast, by End User 2019 & 2032
- Table 83: Global Automated Liquid Handling System Market Revenue Million Forecast, by Country 2019 & 2032
- Table 84: Global Automated Liquid Handling System Market Volume K Unit Forecast, by Country 2019 & 2032
- Table 85: Germany Global Automated Liquid Handling System Market Revenue (Million) Forecast, by Application 2019 & 2032
- Table 86: Germany Global Automated Liquid Handling System Market Volume (K Unit) Forecast, by Application 2019 & 2032
- Table 87: United Kingdom Global Automated Liquid Handling System Market Revenue (Million) Forecast, by Application 2019 & 2032
- Table 88: United Kingdom Global Automated Liquid Handling System Market Volume (K Unit) Forecast, by Application 2019 & 2032
- Table 89: France Global Automated Liquid Handling System Market Revenue (Million) Forecast, by Application 2019 & 2032
- Table 90: France Global Automated Liquid Handling System Market Volume (K Unit) Forecast, by Application 2019 & 2032
- Table 91: Italy Global Automated Liquid Handling System Market Revenue (Million) Forecast, by Application 2019 & 2032
- Table 92: Italy Global Automated Liquid Handling System Market Volume (K Unit) Forecast, by Application 2019 & 2032
- Table 93: Spain Global Automated Liquid Handling System Market Revenue (Million) Forecast, by Application 2019 & 2032
- Table 94: Spain Global Automated Liquid Handling System Market Volume (K Unit) Forecast, by Application 2019 & 2032
- Table 95: Rest of Europe Global Automated Liquid Handling System Market Revenue (Million) Forecast, by Application 2019 & 2032
- Table 96: Rest of Europe Global Automated Liquid Handling System Market Volume (K Unit) Forecast, by Application 2019 & 2032
- Table 97: Global Automated Liquid Handling System Market Revenue Million Forecast, by Type 2019 & 2032
- Table 98: Global Automated Liquid Handling System Market Volume K Unit Forecast, by Type 2019 & 2032
- Table 99: Global Automated Liquid Handling System Market Revenue Million Forecast, by Product 2019 & 2032
- Table 100: Global Automated Liquid Handling System Market Volume K Unit Forecast, by Product 2019 & 2032
- Table 101: Global Automated Liquid Handling System Market Revenue Million Forecast, by End User 2019 & 2032
- Table 102: Global Automated Liquid Handling System Market Volume K Unit Forecast, by End User 2019 & 2032
- Table 103: Global Automated Liquid Handling System Market Revenue Million Forecast, by Country 2019 & 2032
- Table 104: Global Automated Liquid Handling System Market Volume K Unit Forecast, by Country 2019 & 2032
- Table 105: China Global Automated Liquid Handling System Market Revenue (Million) Forecast, by Application 2019 & 2032
- Table 106: China Global Automated Liquid Handling System Market Volume (K Unit) Forecast, by Application 2019 & 2032
- Table 107: Japan Global Automated Liquid Handling System Market Revenue (Million) Forecast, by Application 2019 & 2032
- Table 108: Japan Global Automated Liquid Handling System Market Volume (K Unit) Forecast, by Application 2019 & 2032
- Table 109: India Global Automated Liquid Handling System Market Revenue (Million) Forecast, by Application 2019 & 2032
- Table 110: India Global Automated Liquid Handling System Market Volume (K Unit) Forecast, by Application 2019 & 2032
- Table 111: Australia Global Automated Liquid Handling System Market Revenue (Million) Forecast, by Application 2019 & 2032
- Table 112: Australia Global Automated Liquid Handling System Market Volume (K Unit) Forecast, by Application 2019 & 2032
- Table 113: South Korea Global Automated Liquid Handling System Market Revenue (Million) Forecast, by Application 2019 & 2032
- Table 114: South Korea Global Automated Liquid Handling System Market Volume (K Unit) Forecast, by Application 2019 & 2032
- Table 115: Rest of Asia Pacific Global Automated Liquid Handling System Market Revenue (Million) Forecast, by Application 2019 & 2032
- Table 116: Rest of Asia Pacific Global Automated Liquid Handling System Market Volume (K Unit) Forecast, by Application 2019 & 2032
- Table 117: Global Automated Liquid Handling System Market Revenue Million Forecast, by Type 2019 & 2032
- Table 118: Global Automated Liquid Handling System Market Volume K Unit Forecast, by Type 2019 & 2032
- Table 119: Global Automated Liquid Handling System Market Revenue Million Forecast, by Product 2019 & 2032
- Table 120: Global Automated Liquid Handling System Market Volume K Unit Forecast, by Product 2019 & 2032
- Table 121: Global Automated Liquid Handling System Market Revenue Million Forecast, by End User 2019 & 2032
- Table 122: Global Automated Liquid Handling System Market Volume K Unit Forecast, by End User 2019 & 2032
- Table 123: Global Automated Liquid Handling System Market Revenue Million Forecast, by Country 2019 & 2032
- Table 124: Global Automated Liquid Handling System Market Volume K Unit Forecast, by Country 2019 & 2032
- Table 125: GCC Global Automated Liquid Handling System Market Revenue (Million) Forecast, by Application 2019 & 2032
- Table 126: GCC Global Automated Liquid Handling System Market Volume (K Unit) Forecast, by Application 2019 & 2032
- Table 127: South Africa Global Automated Liquid Handling System Market Revenue (Million) Forecast, by Application 2019 & 2032
- Table 128: South Africa Global Automated Liquid Handling System Market Volume (K Unit) Forecast, by Application 2019 & 2032
- Table 129: Rest of Middle East and Africa Global Automated Liquid Handling System Market Revenue (Million) Forecast, by Application 2019 & 2032
- Table 130: Rest of Middle East and Africa Global Automated Liquid Handling System Market Volume (K Unit) Forecast, by Application 2019 & 2032
- Table 131: Global Automated Liquid Handling System Market Revenue Million Forecast, by Type 2019 & 2032
- Table 132: Global Automated Liquid Handling System Market Volume K Unit Forecast, by Type 2019 & 2032
- Table 133: Global Automated Liquid Handling System Market Revenue Million Forecast, by Product 2019 & 2032
- Table 134: Global Automated Liquid Handling System Market Volume K Unit Forecast, by Product 2019 & 2032
- Table 135: Global Automated Liquid Handling System Market Revenue Million Forecast, by End User 2019 & 2032
- Table 136: Global Automated Liquid Handling System Market Volume K Unit Forecast, by End User 2019 & 2032
- Table 137: Global Automated Liquid Handling System Market Revenue Million Forecast, by Country 2019 & 2032
- Table 138: Global Automated Liquid Handling System Market Volume K Unit Forecast, by Country 2019 & 2032
- Table 139: Brazil Global Automated Liquid Handling System Market Revenue (Million) Forecast, by Application 2019 & 2032
- Table 140: Brazil Global Automated Liquid Handling System Market Volume (K Unit) Forecast, by Application 2019 & 2032
- Table 141: Argentina Global Automated Liquid Handling System Market Revenue (Million) Forecast, by Application 2019 & 2032
- Table 142: Argentina Global Automated Liquid Handling System Market Volume (K Unit) Forecast, by Application 2019 & 2032
- Table 143: Rest of South America Global Automated Liquid Handling System Market Revenue (Million) Forecast, by Application 2019 & 2032
- Table 144: Rest of South America Global Automated Liquid Handling System Market Volume (K Unit) Forecast, by Application 2019 & 2032
Frequently Asked Questions
1. What is the projected Compound Annual Growth Rate (CAGR) of the Global Automated Liquid Handling System Market?
The projected CAGR is approximately 6.80%.
2. Which companies are prominent players in the Global Automated Liquid Handling System Market?
Key companies in the market include Becton Dickinson and Company, Mettler-Toledo International Inc, Tecan Group Ltd, Synchron Lab Automation, Analytik Jena AG (Endress+Hauser Group Services AG), Aurora Biomed Inc, Eppendorf AG, Formulatrix Inc, Corning Incorporated, Hamilton Company, Hudson Robotics Inc, Thermo Fisher Scientific, Agilent Technologies, Danaher Corporation (Beckman Coulter Inc ), Perkin Elmer Inc.
3. What are the main segments of the Global Automated Liquid Handling System Market?
The market segments include Type, Product, End User.
4. Can you provide details about the market size?
The market size is estimated to be USD XX Million as of 2022.
5. What are some drivers contributing to market growth?
Flexibility and Adaptability of Lab Automation Systems; Technological Advancements in Automated Liquid Handling Systems.
6. What are the notable trends driving market growth?
Liquid Handling Workstation are Expected to Witness Healthy Growth Over the Forecast Period.
7. Are there any restraints impacting market growth?
Slower Adoption Rates in Small- and Medium-sized Organizations.
8. Can you provide examples of recent developments in the market?
In June 2022, Beckman Coulter Life Sciences, and a company of Danaher Corporationunleashes the power of next-generation sequencing and makes it more accessible for research labs of all sizes with the launched of the Biomek NGeniuS liquid handling system
9. What pricing options are available for accessing the report?
Pricing options include single-user, multi-user, and enterprise licenses priced at USD 4750, USD 5250, and USD 8750 respectively.
10. Is the market size provided in terms of value or volume?
The market size is provided in terms of value, measured in Million and volume, measured in K Unit.
11. Are there any specific market keywords associated with the report?
Yes, the market keyword associated with the report is "Global Automated Liquid Handling System Market," which aids in identifying and referencing the specific market segment covered.
12. How do I determine which pricing option suits my needs best?
The pricing options vary based on user requirements and access needs. Individual users may opt for single-user licenses, while businesses requiring broader access may choose multi-user or enterprise licenses for cost-effective access to the report.
13. Are there any additional resources or data provided in the Global Automated Liquid Handling System Market report?
While the report offers comprehensive insights, it's advisable to review the specific contents or supplementary materials provided to ascertain if additional resources or data are available.
14. How can I stay updated on further developments or reports in the Global Automated Liquid Handling System Market?
To stay informed about further developments, trends, and reports in the Global Automated Liquid Handling System Market, consider subscribing to industry newsletters, following relevant companies and organizations, or regularly checking reputable industry news sources and publications.
Methodology
Step 1 - Identification of Relevant Samples Size from Population Database


Step 2 - Approaches for Defining Global Market Size (Value, Volume* & Price*)

Note*: In applicable scenarios
Step 3 - Data Sources
Primary Research
- Web Analytics
- Survey Reports
- Research Institute
- Latest Research Reports
- Opinion Leaders
Secondary Research
- Annual Reports
- White Paper
- Latest Press Release
- Industry Association
- Paid Database
- Investor Presentations

Step 4 - Data Triangulation
Involves using different sources of information in order to increase the validity of a study
These sources are likely to be stakeholders in a program - participants, other researchers, program staff, other community members, and so on.
Then we put all data in single framework & apply various statistical tools to find out the dynamic on the market.
During the analysis stage, feedback from the stakeholder groups would be compared to determine areas of agreement as well as areas of divergence


