
Key Insights
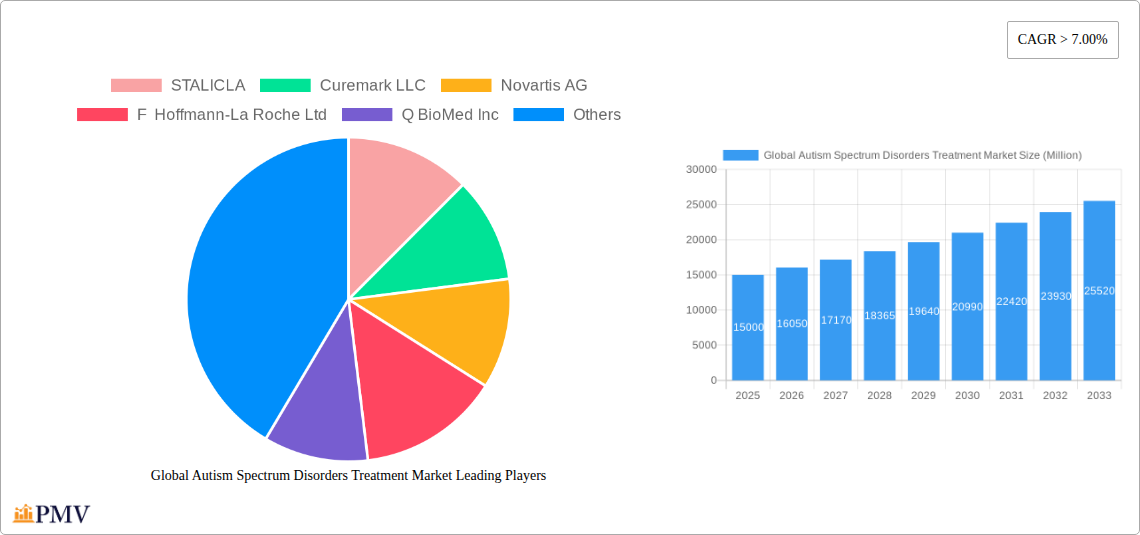
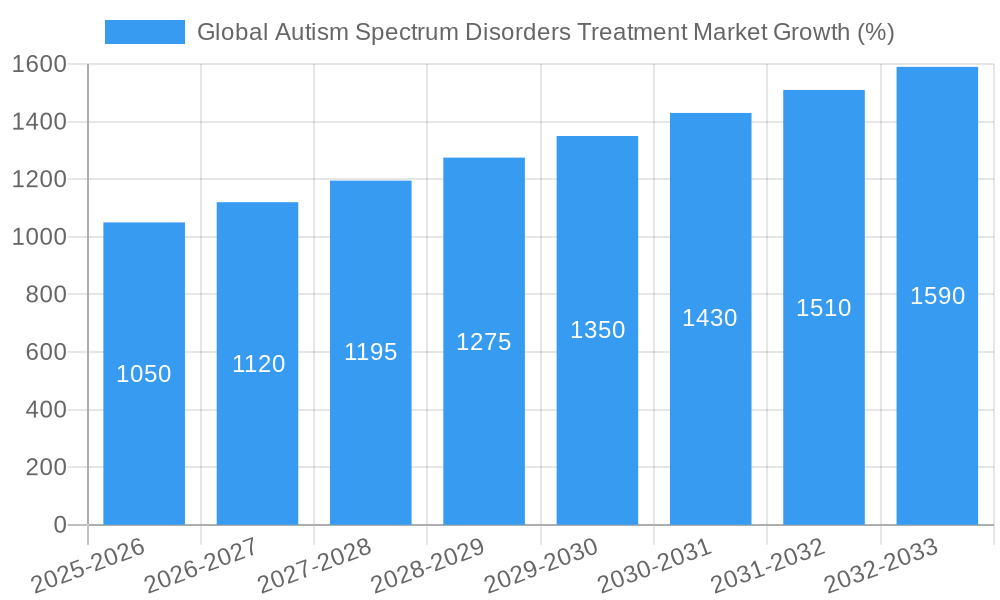
The global autism spectrum disorders (ASD) treatment market is experiencing robust growth, driven by increasing prevalence of ASD, rising awareness and diagnosis rates, and growing demand for effective therapies. The market, valued at approximately $XX million in 2025, is projected to exhibit a Compound Annual Growth Rate (CAGR) exceeding 7% from 2025 to 2033. This expansion is fueled by several key factors. Firstly, advancements in research and development are leading to the introduction of novel and more targeted therapies, improving treatment outcomes and patient quality of life. Secondly, increased government initiatives and healthcare investments in ASD research and supportive services are bolstering market growth. Thirdly, the rising adoption of telehealth and digital health technologies is enhancing accessibility to treatment options, especially in underserved regions. However, high treatment costs, limited insurance coverage, and the variability in ASD symptoms and treatment responses remain significant challenges impacting market penetration.
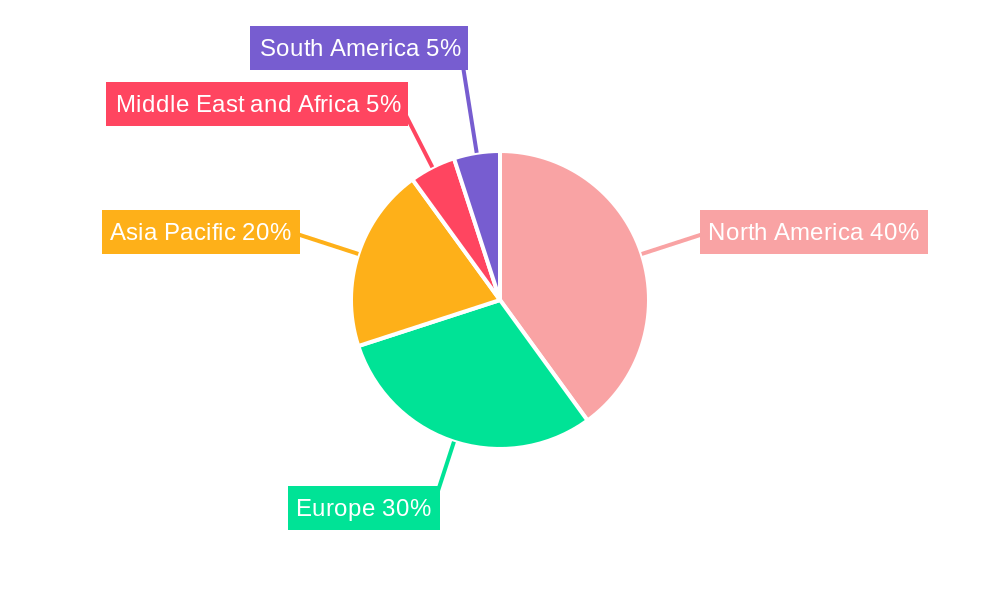
Segment-wise, the antipsychotic drugs and SSRIs/antidepressants segments currently dominate the drug class segment, but the stimulant segment is expected to experience significant growth driven by increasing efficacy data and favorable safety profiles for specific sub-populations. The Autistic Disorder type constitutes the largest segment by type, reflecting its higher prevalence. Hospital pharmacies hold the largest market share by distribution channel, although online pharmacies are witnessing a steady increase in adoption, particularly for medication refills and convenient access. Geographically, North America and Europe currently command substantial market shares, owing to higher diagnostic rates, advanced healthcare infrastructure, and a greater number of established pharmaceutical companies. However, the Asia-Pacific region is poised for significant growth, driven by rising awareness, increased healthcare spending, and a growing population base. This expansion is likely to be concentrated in countries like China, India, and Japan.
Global Autism Spectrum Disorders Treatment Market Report: 2019-2033
This comprehensive report provides a detailed analysis of the global autism spectrum disorders (ASD) treatment market, offering valuable insights for stakeholders across the pharmaceutical, biotech, and healthcare sectors. The report covers the period 2019-2033, with a focus on the forecast period 2025-2033, using 2025 as the base year and estimated year. The market is segmented by drug class, type of autism spectrum disorder, and distribution channel, providing a granular understanding of market dynamics and growth opportunities. The report also profiles key players, analyzes competitive landscapes, and identifies emerging trends shaping the future of ASD treatment. Projected market value is expected to reach xx Million by 2033.
Global Autism Spectrum Disorders Treatment Market Market Structure & Competitive Dynamics
The global ASD treatment market exhibits a moderately consolidated structure, with a few large multinational pharmaceutical companies holding significant market share. However, the emergence of smaller biotech firms focused on innovative therapies is increasing competition. The market is characterized by a dynamic innovation ecosystem, with substantial R&D investment driving the development of novel treatments. Regulatory frameworks vary across different geographies, impacting market access and approval timelines. Product substitutes are limited, primarily focusing on behavioral therapies and supportive care. End-user trends reveal a growing demand for effective, personalized treatments with fewer side effects. Mergers and acquisitions (M&A) activities are frequent, with larger companies acquiring smaller firms to expand their product portfolios and gain access to promising technologies.
- Market Concentration: The top 5 players account for approximately xx% of the market share in 2025.
- Innovation Ecosystem: Significant R&D investment focusing on precision medicine and targeted therapies.
- Regulatory Landscape: Stringent regulatory pathways in major markets influence market entry.
- M&A Activity: Significant M&A activity observed, with deal values exceeding xx Million in the last 5 years. (Specific examples of M&A activity would be included in the full report).
- Product Substitutes: Limited substitutes exist, primarily behavioral therapies and supportive care.
- End-User Trends: Growing demand for personalized and efficacious treatments with reduced side effects.
Global Autism Spectrum Disorders Treatment Market Industry Trends & Insights
The global ASD treatment market is experiencing robust growth, driven by increasing prevalence of ASD, rising awareness and diagnosis rates, and growing investment in research and development. The market is characterized by a high unmet need for effective treatments, particularly for severe ASD symptoms. Technological advancements, such as omics-based drug discovery and personalized medicine approaches, are transforming treatment strategies. Consumer preferences are shifting towards less invasive and more effective therapies with minimal side effects. Competitive dynamics are intensifying with the entry of new players and increased product innovation. The Compound Annual Growth Rate (CAGR) for the forecast period (2025-2033) is estimated at xx%. Market penetration for novel therapies remains relatively low but is expected to increase significantly as new drugs gain regulatory approval.
Dominant Markets & Segments in Global Autism Spectrum Disorders Treatment Market
By Drug Class: Antipsychotic drugs currently hold the largest market share, followed by SSRIs/antidepressants and stimulants. However, the "Other Drug Classes" segment is expected to witness significant growth driven by the emergence of novel therapies.
By Type: Autistic disorder constitutes the largest segment, followed by Asperger's syndrome. The "Other Types" segment represents a smaller but growing market segment as diagnostic tools improve and sub-types of autism spectrum disorder are identified.
By Distribution Channel: Hospital pharmacies remain the dominant distribution channel, while drug stores and retail pharmacies are witnessing increased market share. Online pharmacies are a growing segment, particularly in developed markets.
Leading Region: North America currently holds the largest market share, driven by high diagnosis rates, advanced healthcare infrastructure, and substantial R&D investment. However, the Asia-Pacific region is poised for rapid growth due to increasing awareness, rising healthcare expenditure, and expanding access to healthcare services.
Key Drivers: (Examples for specific regions and segments would be detailed in the full report. This will include factors such as economic policies, healthcare infrastructure, government initiatives, and technological advancements.)
Global Autism Spectrum Disorders Treatment Market Product Innovations
Recent years have witnessed significant advancements in ASD treatment, with a focus on developing targeted therapies addressing specific symptom clusters. This includes the exploration of novel drug mechanisms, such as precision medicine approaches utilizing omics data to identify specific patient subgroups responsive to particular treatments. The market is seeing the emergence of therapies beyond traditional medications, including digital therapeutics and novel drug delivery systems that optimize efficacy and minimize side effects. Technological trends, such as Artificial Intelligence (AI) and machine learning, are accelerating the discovery and development of novel treatments.
Report Segmentation & Scope
This report segments the global autism spectrum disorders treatment market based on:
- By Drug Class: Antipsychotic Drugs, SSRIs/Antidepressants, Stimulants, Other Drug Classes. Each segment's growth projections, market sizes, and competitive dynamics are analyzed in detail.
- By Type: Autistic Disorder, Asperger's Syndrome, Other Types. Growth projections and market size are provided for each autism spectrum disorder type.
- By Distribution Channel: Hospital Pharmacies, Drug Stores and Retail Pharmacies, Online Pharmacies. The report analyzes the market share and growth potential of each distribution channel.
Key Drivers of Global Autism Spectrum Disorders Treatment Market Growth
The market's growth is fueled by the rising prevalence of ASD globally, increasing awareness and early diagnosis, and growing investment in R&D for innovative therapies. Government initiatives and funding programs dedicated to ASD research and treatment also contribute significantly. Furthermore, technological advancements, particularly in personalized medicine, are accelerating the development of targeted and effective treatments. Finally, the increasing access to healthcare services in developing nations is further expanding the market.
Challenges in the Global Autism Spectrum Disorders Treatment Market Sector
Challenges include the high cost of medications and therapies, limited treatment options for specific ASD symptoms, and varying regulatory landscapes across different countries. Supply chain disruptions can impact medication availability, and competition amongst pharmaceutical companies can create barriers to market entry for new drugs. The complexity of ASD and the heterogeneity of symptoms make it difficult to develop universally effective treatments. The lack of standardized diagnostic criteria across different regions can also hinder market growth.
Leading Players in the Global Autism Spectrum Disorders Treatment Market Market
- STALICLA
- Curemark LLC
- Novartis AG
- F Hoffmann-La Roche Ltd
- Q BioMed Inc
- Zynerba Pharmaceuticals Inc
- Axial Therapeutics
- Yamo Pharmaceuticals
- PaxMedica
- Otsuka Pharmaceutical Co Ltd
Key Developments in Global Autism Spectrum Disorders Treatment Market Sector
- August 2022: Bened Life releases Neuralli, a gut-brain medical probiotic designed to support neurological conditions including ASD. This represents a novel approach to ASD treatment, focusing on the gut-brain axis.
- March 2022: STALICLA successfully completes phase 1b trials for its lead drug candidate STP1, paving the way for its application in ASD treatment. This highlights the growing role of precision medicine in ASD drug development.
Strategic Global Autism Spectrum Disorders Treatment Market Market Outlook
The future of the ASD treatment market is bright, driven by continuous innovation in drug development and technological advancements in personalized medicine. Significant opportunities exist for companies developing targeted therapies, digital therapeutics, and companion diagnostics. Strategic partnerships between pharmaceutical companies and technology providers will play a crucial role in accelerating the development and delivery of effective treatments. The market is expected to see further consolidation through M&A activity, with larger companies acquiring smaller firms to expand their portfolios and increase market share. Continued focus on improving diagnostic tools and expanding access to treatment will be vital for market growth.
Global Autism Spectrum Disorders Treatment Market Segmentation
-
1. Drug Class
- 1.1. Antipsychotic Drugs
- 1.2. SSRIs/Antidepressants
- 1.3. Stimulants
- 1.4. Other Drug Classes
-
2. Type
- 2.1. Autistic Disorder
- 2.2. Asperger's Sydrome
- 2.3. Other Types
-
3. Distribution Channel
- 3.1. Hospital Pharmacies
- 3.2. Drug Stores and Retail Pharmacies
- 3.3. Online Pharmacies
Global Autism Spectrum Disorders Treatment Market Segmentation By Geography
-
1. North America
- 1.1. United States
- 1.2. Canada
- 1.3. Mexico
-
2. Europe
- 2.1. Germany
- 2.2. United Kingdom
- 2.3. France
- 2.4. Italy
- 2.5. Spain
- 2.6. Rest of Europe
-
3. Asia Pacific
- 3.1. China
- 3.2. Japan
- 3.3. India
- 3.4. Australia
- 3.5. South Korea
- 3.6. Rest of Asia Pacific
-
4. Middle East and Africa
- 4.1. GCC
- 4.2. South Africa
- 4.3. Rest of Middle East and Africa
-
5. South America
- 5.1. Brazil
- 5.2. Argentina
- 5.3. Rest of South America
Global Autism Spectrum Disorders Treatment Market REPORT HIGHLIGHTS
| Aspects | Details |
|---|---|
| Study Period | 2019-2033 |
| Base Year | 2024 |
| Estimated Year | 2025 |
| Forecast Period | 2025-2033 |
| Historical Period | 2019-2024 |
| Growth Rate | CAGR of > 7.00% from 2019-2033 |
| Segmentation |
|
Table of Contents
- 1. Introduction
- 1.1. Research Scope
- 1.2. Market Segmentation
- 1.3. Research Methodology
- 1.4. Definitions and Assumptions
- 2. Executive Summary
- 2.1. Introduction
- 3. Market Dynamics
- 3.1. Introduction
- 3.2. Market Drivers
- 3.2.1. Increasing Burden of Autism Spectrum Disorder (ASD) Worldwide; Rising Awareness Pertaining ASD and Growing Number of Investments
- 3.3. Market Restrains
- 3.3.1. High Cost of Autism Spectrum Disorder Treatment and Diagnosis; Stringent Regulations Pertaining to Product Approval
- 3.4. Market Trends
- 3.4.1. Autistic Disorder Segment is Expected to Hold a Major Market Share in the Autism Spectrum Disorders Treatment Market
- 4. Market Factor Analysis
- 4.1. Porters Five Forces
- 4.2. Supply/Value Chain
- 4.3. PESTEL analysis
- 4.4. Market Entropy
- 4.5. Patent/Trademark Analysis
- 5. Global Autism Spectrum Disorders Treatment Market Analysis, Insights and Forecast, 2019-2031
- 5.1. Market Analysis, Insights and Forecast - by Drug Class
- 5.1.1. Antipsychotic Drugs
- 5.1.2. SSRIs/Antidepressants
- 5.1.3. Stimulants
- 5.1.4. Other Drug Classes
- 5.2. Market Analysis, Insights and Forecast - by Type
- 5.2.1. Autistic Disorder
- 5.2.2. Asperger's Sydrome
- 5.2.3. Other Types
- 5.3. Market Analysis, Insights and Forecast - by Distribution Channel
- 5.3.1. Hospital Pharmacies
- 5.3.2. Drug Stores and Retail Pharmacies
- 5.3.3. Online Pharmacies
- 5.4. Market Analysis, Insights and Forecast - by Region
- 5.4.1. North America
- 5.4.2. Europe
- 5.4.3. Asia Pacific
- 5.4.4. Middle East and Africa
- 5.4.5. South America
- 5.1. Market Analysis, Insights and Forecast - by Drug Class
- 6. North America Global Autism Spectrum Disorders Treatment Market Analysis, Insights and Forecast, 2019-2031
- 6.1. Market Analysis, Insights and Forecast - by Drug Class
- 6.1.1. Antipsychotic Drugs
- 6.1.2. SSRIs/Antidepressants
- 6.1.3. Stimulants
- 6.1.4. Other Drug Classes
- 6.2. Market Analysis, Insights and Forecast - by Type
- 6.2.1. Autistic Disorder
- 6.2.2. Asperger's Sydrome
- 6.2.3. Other Types
- 6.3. Market Analysis, Insights and Forecast - by Distribution Channel
- 6.3.1. Hospital Pharmacies
- 6.3.2. Drug Stores and Retail Pharmacies
- 6.3.3. Online Pharmacies
- 6.1. Market Analysis, Insights and Forecast - by Drug Class
- 7. Europe Global Autism Spectrum Disorders Treatment Market Analysis, Insights and Forecast, 2019-2031
- 7.1. Market Analysis, Insights and Forecast - by Drug Class
- 7.1.1. Antipsychotic Drugs
- 7.1.2. SSRIs/Antidepressants
- 7.1.3. Stimulants
- 7.1.4. Other Drug Classes
- 7.2. Market Analysis, Insights and Forecast - by Type
- 7.2.1. Autistic Disorder
- 7.2.2. Asperger's Sydrome
- 7.2.3. Other Types
- 7.3. Market Analysis, Insights and Forecast - by Distribution Channel
- 7.3.1. Hospital Pharmacies
- 7.3.2. Drug Stores and Retail Pharmacies
- 7.3.3. Online Pharmacies
- 7.1. Market Analysis, Insights and Forecast - by Drug Class
- 8. Asia Pacific Global Autism Spectrum Disorders Treatment Market Analysis, Insights and Forecast, 2019-2031
- 8.1. Market Analysis, Insights and Forecast - by Drug Class
- 8.1.1. Antipsychotic Drugs
- 8.1.2. SSRIs/Antidepressants
- 8.1.3. Stimulants
- 8.1.4. Other Drug Classes
- 8.2. Market Analysis, Insights and Forecast - by Type
- 8.2.1. Autistic Disorder
- 8.2.2. Asperger's Sydrome
- 8.2.3. Other Types
- 8.3. Market Analysis, Insights and Forecast - by Distribution Channel
- 8.3.1. Hospital Pharmacies
- 8.3.2. Drug Stores and Retail Pharmacies
- 8.3.3. Online Pharmacies
- 8.1. Market Analysis, Insights and Forecast - by Drug Class
- 9. Middle East and Africa Global Autism Spectrum Disorders Treatment Market Analysis, Insights and Forecast, 2019-2031
- 9.1. Market Analysis, Insights and Forecast - by Drug Class
- 9.1.1. Antipsychotic Drugs
- 9.1.2. SSRIs/Antidepressants
- 9.1.3. Stimulants
- 9.1.4. Other Drug Classes
- 9.2. Market Analysis, Insights and Forecast - by Type
- 9.2.1. Autistic Disorder
- 9.2.2. Asperger's Sydrome
- 9.2.3. Other Types
- 9.3. Market Analysis, Insights and Forecast - by Distribution Channel
- 9.3.1. Hospital Pharmacies
- 9.3.2. Drug Stores and Retail Pharmacies
- 9.3.3. Online Pharmacies
- 9.1. Market Analysis, Insights and Forecast - by Drug Class
- 10. South America Global Autism Spectrum Disorders Treatment Market Analysis, Insights and Forecast, 2019-2031
- 10.1. Market Analysis, Insights and Forecast - by Drug Class
- 10.1.1. Antipsychotic Drugs
- 10.1.2. SSRIs/Antidepressants
- 10.1.3. Stimulants
- 10.1.4. Other Drug Classes
- 10.2. Market Analysis, Insights and Forecast - by Type
- 10.2.1. Autistic Disorder
- 10.2.2. Asperger's Sydrome
- 10.2.3. Other Types
- 10.3. Market Analysis, Insights and Forecast - by Distribution Channel
- 10.3.1. Hospital Pharmacies
- 10.3.2. Drug Stores and Retail Pharmacies
- 10.3.3. Online Pharmacies
- 10.1. Market Analysis, Insights and Forecast - by Drug Class
- 11. North America Global Autism Spectrum Disorders Treatment Market Analysis, Insights and Forecast, 2019-2031
- 11.1. Market Analysis, Insights and Forecast - By Country/Sub-region
- 11.1.1 United States
- 11.1.2 Canada
- 11.1.3 Mexico
- 12. Europe Global Autism Spectrum Disorders Treatment Market Analysis, Insights and Forecast, 2019-2031
- 12.1. Market Analysis, Insights and Forecast - By Country/Sub-region
- 12.1.1 Germany
- 12.1.2 United Kingdom
- 12.1.3 France
- 12.1.4 Italy
- 12.1.5 Spain
- 12.1.6 Rest of Europe
- 13. Asia Pacific Global Autism Spectrum Disorders Treatment Market Analysis, Insights and Forecast, 2019-2031
- 13.1. Market Analysis, Insights and Forecast - By Country/Sub-region
- 13.1.1 China
- 13.1.2 Japan
- 13.1.3 India
- 13.1.4 Australia
- 13.1.5 South Korea
- 13.1.6 Rest of Asia Pacific
- 14. Middle East and Africa Global Autism Spectrum Disorders Treatment Market Analysis, Insights and Forecast, 2019-2031
- 14.1. Market Analysis, Insights and Forecast - By Country/Sub-region
- 14.1.1 GCC
- 14.1.2 South Africa
- 14.1.3 Rest of Middle East and Africa
- 15. South America Global Autism Spectrum Disorders Treatment Market Analysis, Insights and Forecast, 2019-2031
- 15.1. Market Analysis, Insights and Forecast - By Country/Sub-region
- 15.1.1 Brazil
- 15.1.2 Argentina
- 15.1.3 Rest of South America
- 16. Competitive Analysis
- 16.1. Market Share Analysis 2024
- 16.2. Company Profiles
- 16.2.1 STALICLA
- 16.2.1.1. Overview
- 16.2.1.2. Products
- 16.2.1.3. SWOT Analysis
- 16.2.1.4. Recent Developments
- 16.2.1.5. Financials (Based on Availability)
- 16.2.2 Curemark LLC
- 16.2.2.1. Overview
- 16.2.2.2. Products
- 16.2.2.3. SWOT Analysis
- 16.2.2.4. Recent Developments
- 16.2.2.5. Financials (Based on Availability)
- 16.2.3 Novartis AG
- 16.2.3.1. Overview
- 16.2.3.2. Products
- 16.2.3.3. SWOT Analysis
- 16.2.3.4. Recent Developments
- 16.2.3.5. Financials (Based on Availability)
- 16.2.4 F Hoffmann-La Roche Ltd
- 16.2.4.1. Overview
- 16.2.4.2. Products
- 16.2.4.3. SWOT Analysis
- 16.2.4.4. Recent Developments
- 16.2.4.5. Financials (Based on Availability)
- 16.2.5 Q BioMed Inc
- 16.2.5.1. Overview
- 16.2.5.2. Products
- 16.2.5.3. SWOT Analysis
- 16.2.5.4. Recent Developments
- 16.2.5.5. Financials (Based on Availability)
- 16.2.6 Zynerba Pharmaceuticals Inc
- 16.2.6.1. Overview
- 16.2.6.2. Products
- 16.2.6.3. SWOT Analysis
- 16.2.6.4. Recent Developments
- 16.2.6.5. Financials (Based on Availability)
- 16.2.7 Axial Therapeutics
- 16.2.7.1. Overview
- 16.2.7.2. Products
- 16.2.7.3. SWOT Analysis
- 16.2.7.4. Recent Developments
- 16.2.7.5. Financials (Based on Availability)
- 16.2.8 Yamo Pharmaceuticals
- 16.2.8.1. Overview
- 16.2.8.2. Products
- 16.2.8.3. SWOT Analysis
- 16.2.8.4. Recent Developments
- 16.2.8.5. Financials (Based on Availability)
- 16.2.9 PaxMedica
- 16.2.9.1. Overview
- 16.2.9.2. Products
- 16.2.9.3. SWOT Analysis
- 16.2.9.4. Recent Developments
- 16.2.9.5. Financials (Based on Availability)
- 16.2.10 Otsuka Pharmaceutical Co Ltd
- 16.2.10.1. Overview
- 16.2.10.2. Products
- 16.2.10.3. SWOT Analysis
- 16.2.10.4. Recent Developments
- 16.2.10.5. Financials (Based on Availability)
- 16.2.1 STALICLA
List of Figures
- Figure 1: Global Global Autism Spectrum Disorders Treatment Market Revenue Breakdown (Million, %) by Region 2024 & 2032
- Figure 2: Global Global Autism Spectrum Disorders Treatment Market Volume Breakdown (K Unit, %) by Region 2024 & 2032
- Figure 3: North America Global Autism Spectrum Disorders Treatment Market Revenue (Million), by Country 2024 & 2032
- Figure 4: North America Global Autism Spectrum Disorders Treatment Market Volume (K Unit), by Country 2024 & 2032
- Figure 5: North America Global Autism Spectrum Disorders Treatment Market Revenue Share (%), by Country 2024 & 2032
- Figure 6: North America Global Autism Spectrum Disorders Treatment Market Volume Share (%), by Country 2024 & 2032
- Figure 7: Europe Global Autism Spectrum Disorders Treatment Market Revenue (Million), by Country 2024 & 2032
- Figure 8: Europe Global Autism Spectrum Disorders Treatment Market Volume (K Unit), by Country 2024 & 2032
- Figure 9: Europe Global Autism Spectrum Disorders Treatment Market Revenue Share (%), by Country 2024 & 2032
- Figure 10: Europe Global Autism Spectrum Disorders Treatment Market Volume Share (%), by Country 2024 & 2032
- Figure 11: Asia Pacific Global Autism Spectrum Disorders Treatment Market Revenue (Million), by Country 2024 & 2032
- Figure 12: Asia Pacific Global Autism Spectrum Disorders Treatment Market Volume (K Unit), by Country 2024 & 2032
- Figure 13: Asia Pacific Global Autism Spectrum Disorders Treatment Market Revenue Share (%), by Country 2024 & 2032
- Figure 14: Asia Pacific Global Autism Spectrum Disorders Treatment Market Volume Share (%), by Country 2024 & 2032
- Figure 15: Middle East and Africa Global Autism Spectrum Disorders Treatment Market Revenue (Million), by Country 2024 & 2032
- Figure 16: Middle East and Africa Global Autism Spectrum Disorders Treatment Market Volume (K Unit), by Country 2024 & 2032
- Figure 17: Middle East and Africa Global Autism Spectrum Disorders Treatment Market Revenue Share (%), by Country 2024 & 2032
- Figure 18: Middle East and Africa Global Autism Spectrum Disorders Treatment Market Volume Share (%), by Country 2024 & 2032
- Figure 19: South America Global Autism Spectrum Disorders Treatment Market Revenue (Million), by Country 2024 & 2032
- Figure 20: South America Global Autism Spectrum Disorders Treatment Market Volume (K Unit), by Country 2024 & 2032
- Figure 21: South America Global Autism Spectrum Disorders Treatment Market Revenue Share (%), by Country 2024 & 2032
- Figure 22: South America Global Autism Spectrum Disorders Treatment Market Volume Share (%), by Country 2024 & 2032
- Figure 23: North America Global Autism Spectrum Disorders Treatment Market Revenue (Million), by Drug Class 2024 & 2032
- Figure 24: North America Global Autism Spectrum Disorders Treatment Market Volume (K Unit), by Drug Class 2024 & 2032
- Figure 25: North America Global Autism Spectrum Disorders Treatment Market Revenue Share (%), by Drug Class 2024 & 2032
- Figure 26: North America Global Autism Spectrum Disorders Treatment Market Volume Share (%), by Drug Class 2024 & 2032
- Figure 27: North America Global Autism Spectrum Disorders Treatment Market Revenue (Million), by Type 2024 & 2032
- Figure 28: North America Global Autism Spectrum Disorders Treatment Market Volume (K Unit), by Type 2024 & 2032
- Figure 29: North America Global Autism Spectrum Disorders Treatment Market Revenue Share (%), by Type 2024 & 2032
- Figure 30: North America Global Autism Spectrum Disorders Treatment Market Volume Share (%), by Type 2024 & 2032
- Figure 31: North America Global Autism Spectrum Disorders Treatment Market Revenue (Million), by Distribution Channel 2024 & 2032
- Figure 32: North America Global Autism Spectrum Disorders Treatment Market Volume (K Unit), by Distribution Channel 2024 & 2032
- Figure 33: North America Global Autism Spectrum Disorders Treatment Market Revenue Share (%), by Distribution Channel 2024 & 2032
- Figure 34: North America Global Autism Spectrum Disorders Treatment Market Volume Share (%), by Distribution Channel 2024 & 2032
- Figure 35: North America Global Autism Spectrum Disorders Treatment Market Revenue (Million), by Country 2024 & 2032
- Figure 36: North America Global Autism Spectrum Disorders Treatment Market Volume (K Unit), by Country 2024 & 2032
- Figure 37: North America Global Autism Spectrum Disorders Treatment Market Revenue Share (%), by Country 2024 & 2032
- Figure 38: North America Global Autism Spectrum Disorders Treatment Market Volume Share (%), by Country 2024 & 2032
- Figure 39: Europe Global Autism Spectrum Disorders Treatment Market Revenue (Million), by Drug Class 2024 & 2032
- Figure 40: Europe Global Autism Spectrum Disorders Treatment Market Volume (K Unit), by Drug Class 2024 & 2032
- Figure 41: Europe Global Autism Spectrum Disorders Treatment Market Revenue Share (%), by Drug Class 2024 & 2032
- Figure 42: Europe Global Autism Spectrum Disorders Treatment Market Volume Share (%), by Drug Class 2024 & 2032
- Figure 43: Europe Global Autism Spectrum Disorders Treatment Market Revenue (Million), by Type 2024 & 2032
- Figure 44: Europe Global Autism Spectrum Disorders Treatment Market Volume (K Unit), by Type 2024 & 2032
- Figure 45: Europe Global Autism Spectrum Disorders Treatment Market Revenue Share (%), by Type 2024 & 2032
- Figure 46: Europe Global Autism Spectrum Disorders Treatment Market Volume Share (%), by Type 2024 & 2032
- Figure 47: Europe Global Autism Spectrum Disorders Treatment Market Revenue (Million), by Distribution Channel 2024 & 2032
- Figure 48: Europe Global Autism Spectrum Disorders Treatment Market Volume (K Unit), by Distribution Channel 2024 & 2032
- Figure 49: Europe Global Autism Spectrum Disorders Treatment Market Revenue Share (%), by Distribution Channel 2024 & 2032
- Figure 50: Europe Global Autism Spectrum Disorders Treatment Market Volume Share (%), by Distribution Channel 2024 & 2032
- Figure 51: Europe Global Autism Spectrum Disorders Treatment Market Revenue (Million), by Country 2024 & 2032
- Figure 52: Europe Global Autism Spectrum Disorders Treatment Market Volume (K Unit), by Country 2024 & 2032
- Figure 53: Europe Global Autism Spectrum Disorders Treatment Market Revenue Share (%), by Country 2024 & 2032
- Figure 54: Europe Global Autism Spectrum Disorders Treatment Market Volume Share (%), by Country 2024 & 2032
- Figure 55: Asia Pacific Global Autism Spectrum Disorders Treatment Market Revenue (Million), by Drug Class 2024 & 2032
- Figure 56: Asia Pacific Global Autism Spectrum Disorders Treatment Market Volume (K Unit), by Drug Class 2024 & 2032
- Figure 57: Asia Pacific Global Autism Spectrum Disorders Treatment Market Revenue Share (%), by Drug Class 2024 & 2032
- Figure 58: Asia Pacific Global Autism Spectrum Disorders Treatment Market Volume Share (%), by Drug Class 2024 & 2032
- Figure 59: Asia Pacific Global Autism Spectrum Disorders Treatment Market Revenue (Million), by Type 2024 & 2032
- Figure 60: Asia Pacific Global Autism Spectrum Disorders Treatment Market Volume (K Unit), by Type 2024 & 2032
- Figure 61: Asia Pacific Global Autism Spectrum Disorders Treatment Market Revenue Share (%), by Type 2024 & 2032
- Figure 62: Asia Pacific Global Autism Spectrum Disorders Treatment Market Volume Share (%), by Type 2024 & 2032
- Figure 63: Asia Pacific Global Autism Spectrum Disorders Treatment Market Revenue (Million), by Distribution Channel 2024 & 2032
- Figure 64: Asia Pacific Global Autism Spectrum Disorders Treatment Market Volume (K Unit), by Distribution Channel 2024 & 2032
- Figure 65: Asia Pacific Global Autism Spectrum Disorders Treatment Market Revenue Share (%), by Distribution Channel 2024 & 2032
- Figure 66: Asia Pacific Global Autism Spectrum Disorders Treatment Market Volume Share (%), by Distribution Channel 2024 & 2032
- Figure 67: Asia Pacific Global Autism Spectrum Disorders Treatment Market Revenue (Million), by Country 2024 & 2032
- Figure 68: Asia Pacific Global Autism Spectrum Disorders Treatment Market Volume (K Unit), by Country 2024 & 2032
- Figure 69: Asia Pacific Global Autism Spectrum Disorders Treatment Market Revenue Share (%), by Country 2024 & 2032
- Figure 70: Asia Pacific Global Autism Spectrum Disorders Treatment Market Volume Share (%), by Country 2024 & 2032
- Figure 71: Middle East and Africa Global Autism Spectrum Disorders Treatment Market Revenue (Million), by Drug Class 2024 & 2032
- Figure 72: Middle East and Africa Global Autism Spectrum Disorders Treatment Market Volume (K Unit), by Drug Class 2024 & 2032
- Figure 73: Middle East and Africa Global Autism Spectrum Disorders Treatment Market Revenue Share (%), by Drug Class 2024 & 2032
- Figure 74: Middle East and Africa Global Autism Spectrum Disorders Treatment Market Volume Share (%), by Drug Class 2024 & 2032
- Figure 75: Middle East and Africa Global Autism Spectrum Disorders Treatment Market Revenue (Million), by Type 2024 & 2032
- Figure 76: Middle East and Africa Global Autism Spectrum Disorders Treatment Market Volume (K Unit), by Type 2024 & 2032
- Figure 77: Middle East and Africa Global Autism Spectrum Disorders Treatment Market Revenue Share (%), by Type 2024 & 2032
- Figure 78: Middle East and Africa Global Autism Spectrum Disorders Treatment Market Volume Share (%), by Type 2024 & 2032
- Figure 79: Middle East and Africa Global Autism Spectrum Disorders Treatment Market Revenue (Million), by Distribution Channel 2024 & 2032
- Figure 80: Middle East and Africa Global Autism Spectrum Disorders Treatment Market Volume (K Unit), by Distribution Channel 2024 & 2032
- Figure 81: Middle East and Africa Global Autism Spectrum Disorders Treatment Market Revenue Share (%), by Distribution Channel 2024 & 2032
- Figure 82: Middle East and Africa Global Autism Spectrum Disorders Treatment Market Volume Share (%), by Distribution Channel 2024 & 2032
- Figure 83: Middle East and Africa Global Autism Spectrum Disorders Treatment Market Revenue (Million), by Country 2024 & 2032
- Figure 84: Middle East and Africa Global Autism Spectrum Disorders Treatment Market Volume (K Unit), by Country 2024 & 2032
- Figure 85: Middle East and Africa Global Autism Spectrum Disorders Treatment Market Revenue Share (%), by Country 2024 & 2032
- Figure 86: Middle East and Africa Global Autism Spectrum Disorders Treatment Market Volume Share (%), by Country 2024 & 2032
- Figure 87: South America Global Autism Spectrum Disorders Treatment Market Revenue (Million), by Drug Class 2024 & 2032
- Figure 88: South America Global Autism Spectrum Disorders Treatment Market Volume (K Unit), by Drug Class 2024 & 2032
- Figure 89: South America Global Autism Spectrum Disorders Treatment Market Revenue Share (%), by Drug Class 2024 & 2032
- Figure 90: South America Global Autism Spectrum Disorders Treatment Market Volume Share (%), by Drug Class 2024 & 2032
- Figure 91: South America Global Autism Spectrum Disorders Treatment Market Revenue (Million), by Type 2024 & 2032
- Figure 92: South America Global Autism Spectrum Disorders Treatment Market Volume (K Unit), by Type 2024 & 2032
- Figure 93: South America Global Autism Spectrum Disorders Treatment Market Revenue Share (%), by Type 2024 & 2032
- Figure 94: South America Global Autism Spectrum Disorders Treatment Market Volume Share (%), by Type 2024 & 2032
- Figure 95: South America Global Autism Spectrum Disorders Treatment Market Revenue (Million), by Distribution Channel 2024 & 2032
- Figure 96: South America Global Autism Spectrum Disorders Treatment Market Volume (K Unit), by Distribution Channel 2024 & 2032
- Figure 97: South America Global Autism Spectrum Disorders Treatment Market Revenue Share (%), by Distribution Channel 2024 & 2032
- Figure 98: South America Global Autism Spectrum Disorders Treatment Market Volume Share (%), by Distribution Channel 2024 & 2032
- Figure 99: South America Global Autism Spectrum Disorders Treatment Market Revenue (Million), by Country 2024 & 2032
- Figure 100: South America Global Autism Spectrum Disorders Treatment Market Volume (K Unit), by Country 2024 & 2032
- Figure 101: South America Global Autism Spectrum Disorders Treatment Market Revenue Share (%), by Country 2024 & 2032
- Figure 102: South America Global Autism Spectrum Disorders Treatment Market Volume Share (%), by Country 2024 & 2032
List of Tables
- Table 1: Global Autism Spectrum Disorders Treatment Market Revenue Million Forecast, by Region 2019 & 2032
- Table 2: Global Autism Spectrum Disorders Treatment Market Volume K Unit Forecast, by Region 2019 & 2032
- Table 3: Global Autism Spectrum Disorders Treatment Market Revenue Million Forecast, by Drug Class 2019 & 2032
- Table 4: Global Autism Spectrum Disorders Treatment Market Volume K Unit Forecast, by Drug Class 2019 & 2032
- Table 5: Global Autism Spectrum Disorders Treatment Market Revenue Million Forecast, by Type 2019 & 2032
- Table 6: Global Autism Spectrum Disorders Treatment Market Volume K Unit Forecast, by Type 2019 & 2032
- Table 7: Global Autism Spectrum Disorders Treatment Market Revenue Million Forecast, by Distribution Channel 2019 & 2032
- Table 8: Global Autism Spectrum Disorders Treatment Market Volume K Unit Forecast, by Distribution Channel 2019 & 2032
- Table 9: Global Autism Spectrum Disorders Treatment Market Revenue Million Forecast, by Region 2019 & 2032
- Table 10: Global Autism Spectrum Disorders Treatment Market Volume K Unit Forecast, by Region 2019 & 2032
- Table 11: Global Autism Spectrum Disorders Treatment Market Revenue Million Forecast, by Country 2019 & 2032
- Table 12: Global Autism Spectrum Disorders Treatment Market Volume K Unit Forecast, by Country 2019 & 2032
- Table 13: United States Global Autism Spectrum Disorders Treatment Market Revenue (Million) Forecast, by Application 2019 & 2032
- Table 14: United States Global Autism Spectrum Disorders Treatment Market Volume (K Unit) Forecast, by Application 2019 & 2032
- Table 15: Canada Global Autism Spectrum Disorders Treatment Market Revenue (Million) Forecast, by Application 2019 & 2032
- Table 16: Canada Global Autism Spectrum Disorders Treatment Market Volume (K Unit) Forecast, by Application 2019 & 2032
- Table 17: Mexico Global Autism Spectrum Disorders Treatment Market Revenue (Million) Forecast, by Application 2019 & 2032
- Table 18: Mexico Global Autism Spectrum Disorders Treatment Market Volume (K Unit) Forecast, by Application 2019 & 2032
- Table 19: Global Autism Spectrum Disorders Treatment Market Revenue Million Forecast, by Country 2019 & 2032
- Table 20: Global Autism Spectrum Disorders Treatment Market Volume K Unit Forecast, by Country 2019 & 2032
- Table 21: Germany Global Autism Spectrum Disorders Treatment Market Revenue (Million) Forecast, by Application 2019 & 2032
- Table 22: Germany Global Autism Spectrum Disorders Treatment Market Volume (K Unit) Forecast, by Application 2019 & 2032
- Table 23: United Kingdom Global Autism Spectrum Disorders Treatment Market Revenue (Million) Forecast, by Application 2019 & 2032
- Table 24: United Kingdom Global Autism Spectrum Disorders Treatment Market Volume (K Unit) Forecast, by Application 2019 & 2032
- Table 25: France Global Autism Spectrum Disorders Treatment Market Revenue (Million) Forecast, by Application 2019 & 2032
- Table 26: France Global Autism Spectrum Disorders Treatment Market Volume (K Unit) Forecast, by Application 2019 & 2032
- Table 27: Italy Global Autism Spectrum Disorders Treatment Market Revenue (Million) Forecast, by Application 2019 & 2032
- Table 28: Italy Global Autism Spectrum Disorders Treatment Market Volume (K Unit) Forecast, by Application 2019 & 2032
- Table 29: Spain Global Autism Spectrum Disorders Treatment Market Revenue (Million) Forecast, by Application 2019 & 2032
- Table 30: Spain Global Autism Spectrum Disorders Treatment Market Volume (K Unit) Forecast, by Application 2019 & 2032
- Table 31: Rest of Europe Global Autism Spectrum Disorders Treatment Market Revenue (Million) Forecast, by Application 2019 & 2032
- Table 32: Rest of Europe Global Autism Spectrum Disorders Treatment Market Volume (K Unit) Forecast, by Application 2019 & 2032
- Table 33: Global Autism Spectrum Disorders Treatment Market Revenue Million Forecast, by Country 2019 & 2032
- Table 34: Global Autism Spectrum Disorders Treatment Market Volume K Unit Forecast, by Country 2019 & 2032
- Table 35: China Global Autism Spectrum Disorders Treatment Market Revenue (Million) Forecast, by Application 2019 & 2032
- Table 36: China Global Autism Spectrum Disorders Treatment Market Volume (K Unit) Forecast, by Application 2019 & 2032
- Table 37: Japan Global Autism Spectrum Disorders Treatment Market Revenue (Million) Forecast, by Application 2019 & 2032
- Table 38: Japan Global Autism Spectrum Disorders Treatment Market Volume (K Unit) Forecast, by Application 2019 & 2032
- Table 39: India Global Autism Spectrum Disorders Treatment Market Revenue (Million) Forecast, by Application 2019 & 2032
- Table 40: India Global Autism Spectrum Disorders Treatment Market Volume (K Unit) Forecast, by Application 2019 & 2032
- Table 41: Australia Global Autism Spectrum Disorders Treatment Market Revenue (Million) Forecast, by Application 2019 & 2032
- Table 42: Australia Global Autism Spectrum Disorders Treatment Market Volume (K Unit) Forecast, by Application 2019 & 2032
- Table 43: South Korea Global Autism Spectrum Disorders Treatment Market Revenue (Million) Forecast, by Application 2019 & 2032
- Table 44: South Korea Global Autism Spectrum Disorders Treatment Market Volume (K Unit) Forecast, by Application 2019 & 2032
- Table 45: Rest of Asia Pacific Global Autism Spectrum Disorders Treatment Market Revenue (Million) Forecast, by Application 2019 & 2032
- Table 46: Rest of Asia Pacific Global Autism Spectrum Disorders Treatment Market Volume (K Unit) Forecast, by Application 2019 & 2032
- Table 47: Global Autism Spectrum Disorders Treatment Market Revenue Million Forecast, by Country 2019 & 2032
- Table 48: Global Autism Spectrum Disorders Treatment Market Volume K Unit Forecast, by Country 2019 & 2032
- Table 49: GCC Global Autism Spectrum Disorders Treatment Market Revenue (Million) Forecast, by Application 2019 & 2032
- Table 50: GCC Global Autism Spectrum Disorders Treatment Market Volume (K Unit) Forecast, by Application 2019 & 2032
- Table 51: South Africa Global Autism Spectrum Disorders Treatment Market Revenue (Million) Forecast, by Application 2019 & 2032
- Table 52: South Africa Global Autism Spectrum Disorders Treatment Market Volume (K Unit) Forecast, by Application 2019 & 2032
- Table 53: Rest of Middle East and Africa Global Autism Spectrum Disorders Treatment Market Revenue (Million) Forecast, by Application 2019 & 2032
- Table 54: Rest of Middle East and Africa Global Autism Spectrum Disorders Treatment Market Volume (K Unit) Forecast, by Application 2019 & 2032
- Table 55: Global Autism Spectrum Disorders Treatment Market Revenue Million Forecast, by Country 2019 & 2032
- Table 56: Global Autism Spectrum Disorders Treatment Market Volume K Unit Forecast, by Country 2019 & 2032
- Table 57: Brazil Global Autism Spectrum Disorders Treatment Market Revenue (Million) Forecast, by Application 2019 & 2032
- Table 58: Brazil Global Autism Spectrum Disorders Treatment Market Volume (K Unit) Forecast, by Application 2019 & 2032
- Table 59: Argentina Global Autism Spectrum Disorders Treatment Market Revenue (Million) Forecast, by Application 2019 & 2032
- Table 60: Argentina Global Autism Spectrum Disorders Treatment Market Volume (K Unit) Forecast, by Application 2019 & 2032
- Table 61: Rest of South America Global Autism Spectrum Disorders Treatment Market Revenue (Million) Forecast, by Application 2019 & 2032
- Table 62: Rest of South America Global Autism Spectrum Disorders Treatment Market Volume (K Unit) Forecast, by Application 2019 & 2032
- Table 63: Global Autism Spectrum Disorders Treatment Market Revenue Million Forecast, by Drug Class 2019 & 2032
- Table 64: Global Autism Spectrum Disorders Treatment Market Volume K Unit Forecast, by Drug Class 2019 & 2032
- Table 65: Global Autism Spectrum Disorders Treatment Market Revenue Million Forecast, by Type 2019 & 2032
- Table 66: Global Autism Spectrum Disorders Treatment Market Volume K Unit Forecast, by Type 2019 & 2032
- Table 67: Global Autism Spectrum Disorders Treatment Market Revenue Million Forecast, by Distribution Channel 2019 & 2032
- Table 68: Global Autism Spectrum Disorders Treatment Market Volume K Unit Forecast, by Distribution Channel 2019 & 2032
- Table 69: Global Autism Spectrum Disorders Treatment Market Revenue Million Forecast, by Country 2019 & 2032
- Table 70: Global Autism Spectrum Disorders Treatment Market Volume K Unit Forecast, by Country 2019 & 2032
- Table 71: United States Global Autism Spectrum Disorders Treatment Market Revenue (Million) Forecast, by Application 2019 & 2032
- Table 72: United States Global Autism Spectrum Disorders Treatment Market Volume (K Unit) Forecast, by Application 2019 & 2032
- Table 73: Canada Global Autism Spectrum Disorders Treatment Market Revenue (Million) Forecast, by Application 2019 & 2032
- Table 74: Canada Global Autism Spectrum Disorders Treatment Market Volume (K Unit) Forecast, by Application 2019 & 2032
- Table 75: Mexico Global Autism Spectrum Disorders Treatment Market Revenue (Million) Forecast, by Application 2019 & 2032
- Table 76: Mexico Global Autism Spectrum Disorders Treatment Market Volume (K Unit) Forecast, by Application 2019 & 2032
- Table 77: Global Autism Spectrum Disorders Treatment Market Revenue Million Forecast, by Drug Class 2019 & 2032
- Table 78: Global Autism Spectrum Disorders Treatment Market Volume K Unit Forecast, by Drug Class 2019 & 2032
- Table 79: Global Autism Spectrum Disorders Treatment Market Revenue Million Forecast, by Type 2019 & 2032
- Table 80: Global Autism Spectrum Disorders Treatment Market Volume K Unit Forecast, by Type 2019 & 2032
- Table 81: Global Autism Spectrum Disorders Treatment Market Revenue Million Forecast, by Distribution Channel 2019 & 2032
- Table 82: Global Autism Spectrum Disorders Treatment Market Volume K Unit Forecast, by Distribution Channel 2019 & 2032
- Table 83: Global Autism Spectrum Disorders Treatment Market Revenue Million Forecast, by Country 2019 & 2032
- Table 84: Global Autism Spectrum Disorders Treatment Market Volume K Unit Forecast, by Country 2019 & 2032
- Table 85: Germany Global Autism Spectrum Disorders Treatment Market Revenue (Million) Forecast, by Application 2019 & 2032
- Table 86: Germany Global Autism Spectrum Disorders Treatment Market Volume (K Unit) Forecast, by Application 2019 & 2032
- Table 87: United Kingdom Global Autism Spectrum Disorders Treatment Market Revenue (Million) Forecast, by Application 2019 & 2032
- Table 88: United Kingdom Global Autism Spectrum Disorders Treatment Market Volume (K Unit) Forecast, by Application 2019 & 2032
- Table 89: France Global Autism Spectrum Disorders Treatment Market Revenue (Million) Forecast, by Application 2019 & 2032
- Table 90: France Global Autism Spectrum Disorders Treatment Market Volume (K Unit) Forecast, by Application 2019 & 2032
- Table 91: Italy Global Autism Spectrum Disorders Treatment Market Revenue (Million) Forecast, by Application 2019 & 2032
- Table 92: Italy Global Autism Spectrum Disorders Treatment Market Volume (K Unit) Forecast, by Application 2019 & 2032
- Table 93: Spain Global Autism Spectrum Disorders Treatment Market Revenue (Million) Forecast, by Application 2019 & 2032
- Table 94: Spain Global Autism Spectrum Disorders Treatment Market Volume (K Unit) Forecast, by Application 2019 & 2032
- Table 95: Rest of Europe Global Autism Spectrum Disorders Treatment Market Revenue (Million) Forecast, by Application 2019 & 2032
- Table 96: Rest of Europe Global Autism Spectrum Disorders Treatment Market Volume (K Unit) Forecast, by Application 2019 & 2032
- Table 97: Global Autism Spectrum Disorders Treatment Market Revenue Million Forecast, by Drug Class 2019 & 2032
- Table 98: Global Autism Spectrum Disorders Treatment Market Volume K Unit Forecast, by Drug Class 2019 & 2032
- Table 99: Global Autism Spectrum Disorders Treatment Market Revenue Million Forecast, by Type 2019 & 2032
- Table 100: Global Autism Spectrum Disorders Treatment Market Volume K Unit Forecast, by Type 2019 & 2032
- Table 101: Global Autism Spectrum Disorders Treatment Market Revenue Million Forecast, by Distribution Channel 2019 & 2032
- Table 102: Global Autism Spectrum Disorders Treatment Market Volume K Unit Forecast, by Distribution Channel 2019 & 2032
- Table 103: Global Autism Spectrum Disorders Treatment Market Revenue Million Forecast, by Country 2019 & 2032
- Table 104: Global Autism Spectrum Disorders Treatment Market Volume K Unit Forecast, by Country 2019 & 2032
- Table 105: China Global Autism Spectrum Disorders Treatment Market Revenue (Million) Forecast, by Application 2019 & 2032
- Table 106: China Global Autism Spectrum Disorders Treatment Market Volume (K Unit) Forecast, by Application 2019 & 2032
- Table 107: Japan Global Autism Spectrum Disorders Treatment Market Revenue (Million) Forecast, by Application 2019 & 2032
- Table 108: Japan Global Autism Spectrum Disorders Treatment Market Volume (K Unit) Forecast, by Application 2019 & 2032
- Table 109: India Global Autism Spectrum Disorders Treatment Market Revenue (Million) Forecast, by Application 2019 & 2032
- Table 110: India Global Autism Spectrum Disorders Treatment Market Volume (K Unit) Forecast, by Application 2019 & 2032
- Table 111: Australia Global Autism Spectrum Disorders Treatment Market Revenue (Million) Forecast, by Application 2019 & 2032
- Table 112: Australia Global Autism Spectrum Disorders Treatment Market Volume (K Unit) Forecast, by Application 2019 & 2032
- Table 113: South Korea Global Autism Spectrum Disorders Treatment Market Revenue (Million) Forecast, by Application 2019 & 2032
- Table 114: South Korea Global Autism Spectrum Disorders Treatment Market Volume (K Unit) Forecast, by Application 2019 & 2032
- Table 115: Rest of Asia Pacific Global Autism Spectrum Disorders Treatment Market Revenue (Million) Forecast, by Application 2019 & 2032
- Table 116: Rest of Asia Pacific Global Autism Spectrum Disorders Treatment Market Volume (K Unit) Forecast, by Application 2019 & 2032
- Table 117: Global Autism Spectrum Disorders Treatment Market Revenue Million Forecast, by Drug Class 2019 & 2032
- Table 118: Global Autism Spectrum Disorders Treatment Market Volume K Unit Forecast, by Drug Class 2019 & 2032
- Table 119: Global Autism Spectrum Disorders Treatment Market Revenue Million Forecast, by Type 2019 & 2032
- Table 120: Global Autism Spectrum Disorders Treatment Market Volume K Unit Forecast, by Type 2019 & 2032
- Table 121: Global Autism Spectrum Disorders Treatment Market Revenue Million Forecast, by Distribution Channel 2019 & 2032
- Table 122: Global Autism Spectrum Disorders Treatment Market Volume K Unit Forecast, by Distribution Channel 2019 & 2032
- Table 123: Global Autism Spectrum Disorders Treatment Market Revenue Million Forecast, by Country 2019 & 2032
- Table 124: Global Autism Spectrum Disorders Treatment Market Volume K Unit Forecast, by Country 2019 & 2032
- Table 125: GCC Global Autism Spectrum Disorders Treatment Market Revenue (Million) Forecast, by Application 2019 & 2032
- Table 126: GCC Global Autism Spectrum Disorders Treatment Market Volume (K Unit) Forecast, by Application 2019 & 2032
- Table 127: South Africa Global Autism Spectrum Disorders Treatment Market Revenue (Million) Forecast, by Application 2019 & 2032
- Table 128: South Africa Global Autism Spectrum Disorders Treatment Market Volume (K Unit) Forecast, by Application 2019 & 2032
- Table 129: Rest of Middle East and Africa Global Autism Spectrum Disorders Treatment Market Revenue (Million) Forecast, by Application 2019 & 2032
- Table 130: Rest of Middle East and Africa Global Autism Spectrum Disorders Treatment Market Volume (K Unit) Forecast, by Application 2019 & 2032
- Table 131: Global Autism Spectrum Disorders Treatment Market Revenue Million Forecast, by Drug Class 2019 & 2032
- Table 132: Global Autism Spectrum Disorders Treatment Market Volume K Unit Forecast, by Drug Class 2019 & 2032
- Table 133: Global Autism Spectrum Disorders Treatment Market Revenue Million Forecast, by Type 2019 & 2032
- Table 134: Global Autism Spectrum Disorders Treatment Market Volume K Unit Forecast, by Type 2019 & 2032
- Table 135: Global Autism Spectrum Disorders Treatment Market Revenue Million Forecast, by Distribution Channel 2019 & 2032
- Table 136: Global Autism Spectrum Disorders Treatment Market Volume K Unit Forecast, by Distribution Channel 2019 & 2032
- Table 137: Global Autism Spectrum Disorders Treatment Market Revenue Million Forecast, by Country 2019 & 2032
- Table 138: Global Autism Spectrum Disorders Treatment Market Volume K Unit Forecast, by Country 2019 & 2032
- Table 139: Brazil Global Autism Spectrum Disorders Treatment Market Revenue (Million) Forecast, by Application 2019 & 2032
- Table 140: Brazil Global Autism Spectrum Disorders Treatment Market Volume (K Unit) Forecast, by Application 2019 & 2032
- Table 141: Argentina Global Autism Spectrum Disorders Treatment Market Revenue (Million) Forecast, by Application 2019 & 2032
- Table 142: Argentina Global Autism Spectrum Disorders Treatment Market Volume (K Unit) Forecast, by Application 2019 & 2032
- Table 143: Rest of South America Global Autism Spectrum Disorders Treatment Market Revenue (Million) Forecast, by Application 2019 & 2032
- Table 144: Rest of South America Global Autism Spectrum Disorders Treatment Market Volume (K Unit) Forecast, by Application 2019 & 2032
Frequently Asked Questions
1. What is the projected Compound Annual Growth Rate (CAGR) of the Global Autism Spectrum Disorders Treatment Market?
The projected CAGR is approximately > 7.00%.
2. Which companies are prominent players in the Global Autism Spectrum Disorders Treatment Market?
Key companies in the market include STALICLA, Curemark LLC, Novartis AG, F Hoffmann-La Roche Ltd, Q BioMed Inc, Zynerba Pharmaceuticals Inc, Axial Therapeutics, Yamo Pharmaceuticals, PaxMedica, Otsuka Pharmaceutical Co Ltd.
3. What are the main segments of the Global Autism Spectrum Disorders Treatment Market?
The market segments include Drug Class, Type, Distribution Channel.
4. Can you provide details about the market size?
The market size is estimated to be USD XX Million as of 2022.
5. What are some drivers contributing to market growth?
Increasing Burden of Autism Spectrum Disorder (ASD) Worldwide; Rising Awareness Pertaining ASD and Growing Number of Investments.
6. What are the notable trends driving market growth?
Autistic Disorder Segment is Expected to Hold a Major Market Share in the Autism Spectrum Disorders Treatment Market.
7. Are there any restraints impacting market growth?
High Cost of Autism Spectrum Disorder Treatment and Diagnosis; Stringent Regulations Pertaining to Product Approval.
8. Can you provide examples of recent developments in the market?
In August 2022, Bened Life released the first gut-brain medical probiotic, Neuralli. Made in the United States and utilizing the patented probiotic strain L. plantarum PS128, Neuralli is designed to promote mental health and support neurological conditions including but not limited to Parkinson's disease (PD) and autism spectrum disorder (ASD).
9. What pricing options are available for accessing the report?
Pricing options include single-user, multi-user, and enterprise licenses priced at USD 4750, USD 5250, and USD 8750 respectively.
10. Is the market size provided in terms of value or volume?
The market size is provided in terms of value, measured in Million and volume, measured in K Unit.
11. Are there any specific market keywords associated with the report?
Yes, the market keyword associated with the report is "Global Autism Spectrum Disorders Treatment Market," which aids in identifying and referencing the specific market segment covered.
12. How do I determine which pricing option suits my needs best?
The pricing options vary based on user requirements and access needs. Individual users may opt for single-user licenses, while businesses requiring broader access may choose multi-user or enterprise licenses for cost-effective access to the report.
13. Are there any additional resources or data provided in the Global Autism Spectrum Disorders Treatment Market report?
While the report offers comprehensive insights, it's advisable to review the specific contents or supplementary materials provided to ascertain if additional resources or data are available.
14. How can I stay updated on further developments or reports in the Global Autism Spectrum Disorders Treatment Market?
To stay informed about further developments, trends, and reports in the Global Autism Spectrum Disorders Treatment Market, consider subscribing to industry newsletters, following relevant companies and organizations, or regularly checking reputable industry news sources and publications.
Methodology
Step 1 - Identification of Relevant Samples Size from Population Database


Step 2 - Approaches for Defining Global Market Size (Value, Volume* & Price*)

Note*: In applicable scenarios
Step 3 - Data Sources
Primary Research
- Web Analytics
- Survey Reports
- Research Institute
- Latest Research Reports
- Opinion Leaders
Secondary Research
- Annual Reports
- White Paper
- Latest Press Release
- Industry Association
- Paid Database
- Investor Presentations

Step 4 - Data Triangulation
Involves using different sources of information in order to increase the validity of a study
These sources are likely to be stakeholders in a program - participants, other researchers, program staff, other community members, and so on.
Then we put all data in single framework & apply various statistical tools to find out the dynamic on the market.
During the analysis stage, feedback from the stakeholder groups would be compared to determine areas of agreement as well as areas of divergence


