
Key Insights
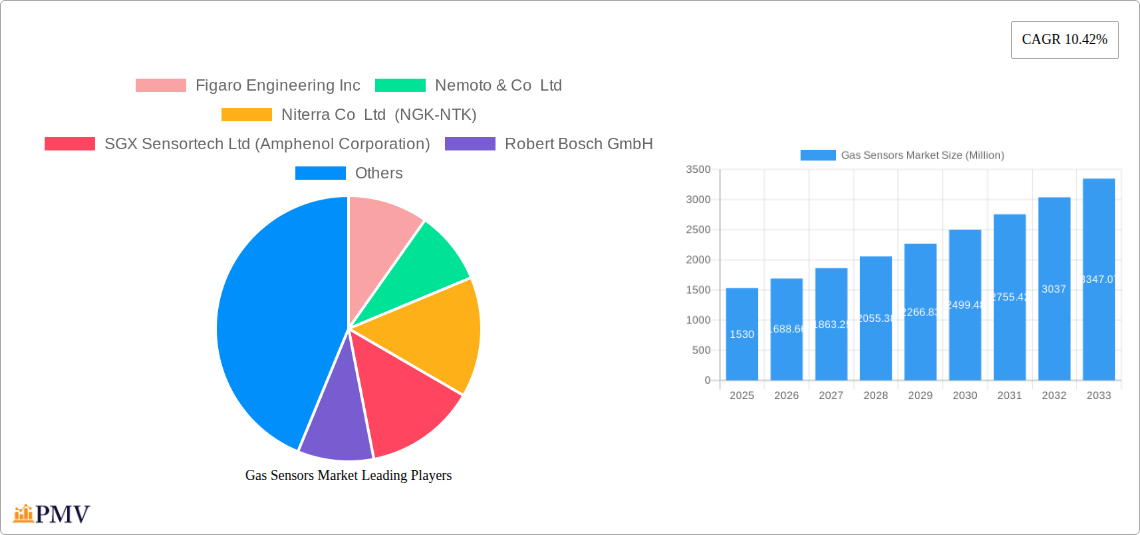
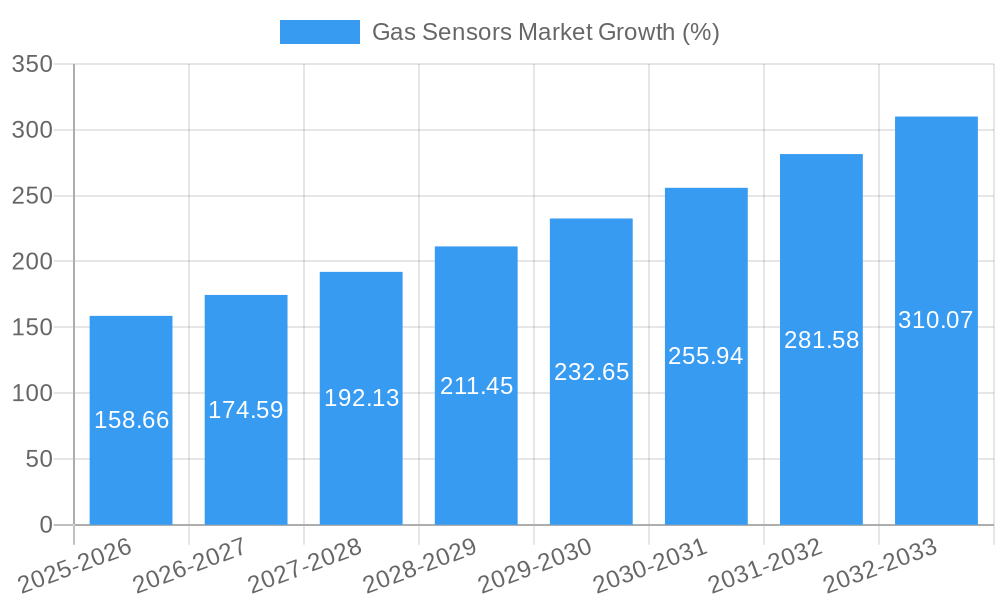
The global gas sensor market is experiencing robust growth, projected to reach $1.53 billion in 2025 and maintain a Compound Annual Growth Rate (CAGR) of 10.42% from 2025 to 2033. This expansion is driven by several key factors. Increasing demand across diverse applications, such as automotive emission control (fueled by stricter emission regulations globally), industrial process monitoring (necessitated by safety and efficiency improvements), and the burgeoning medical diagnostics sector (for accurate and rapid disease detection) are major contributors. Technological advancements, particularly in miniaturization, improved sensitivity, and lower power consumption of gas sensors, are further propelling market growth. The shift towards smart homes and buildings also significantly impacts the market, creating a demand for sophisticated environmental monitoring systems that utilize gas sensors for safety and energy efficiency. The electrochemical and semiconductor technologies currently dominate the market, but the increasing adoption of photoionization detectors (PID) for their superior sensitivity to volatile organic compounds (VOCs) is shaping future growth.
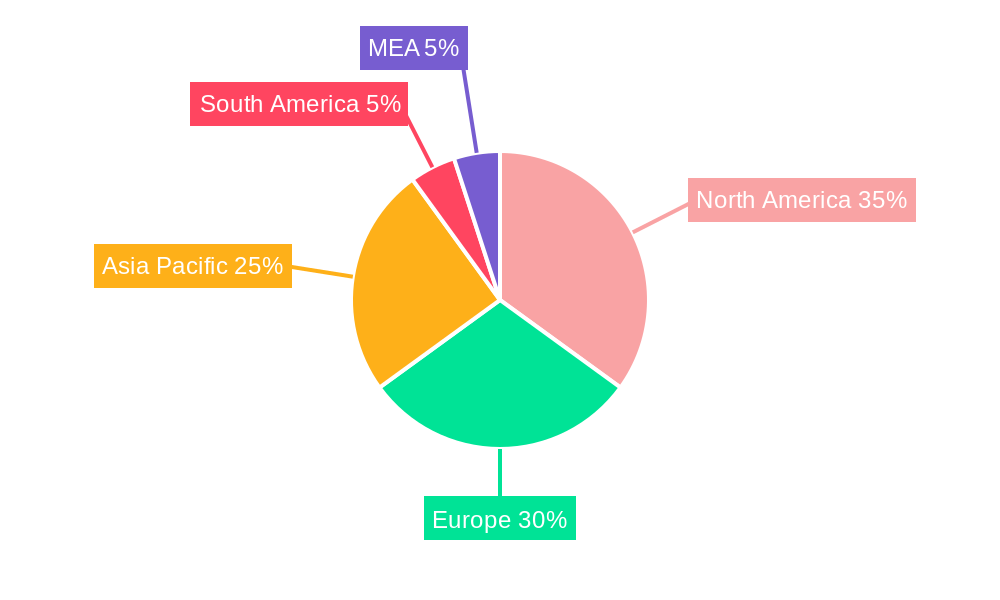
Market segmentation reveals significant opportunities across various types of gas sensors. Oxygen, carbon monoxide (CO), and carbon dioxide (CO2) sensors currently hold substantial market shares, but the growing concerns around air quality are driving demand for nitrogen oxide and hydrocarbon sensors. Geographically, North America and Europe are currently the largest markets, driven by established industrial bases and stringent environmental regulations. However, the Asia-Pacific region, particularly China and India, exhibits high growth potential, fueled by rapid industrialization and urbanization. While the market faces some challenges, such as the high cost of certain sensor technologies and the need for improved sensor lifespan, the overall market outlook remains extremely positive, largely due to the continuous advancements in sensor technology and the increasing need for precise gas detection across a wide range of applications.
Gas Sensors Market: A Comprehensive Report (2019-2033)
This in-depth report provides a comprehensive analysis of the global Gas Sensors Market, encompassing historical data (2019-2024), current estimates (2025), and future projections (2025-2033). The study delves into market segmentation by type, technology, and application, offering valuable insights for stakeholders across the value chain. The report's projected market value exceeds xx Million by 2033, driven by robust growth across various sectors.
Gas Sensors Market Market Structure & Competitive Dynamics
The Gas Sensors Market exhibits a moderately consolidated structure, with several key players vying for market share. Market concentration is influenced by factors such as technological advancements, regulatory compliance, and the prevalence of mergers and acquisitions (M&A) activities. The market is characterized by a dynamic innovation ecosystem, with companies continuously developing advanced sensor technologies to meet evolving application demands. Stringent regulatory frameworks, particularly concerning safety and environmental regulations, shape market dynamics. Product substitutes, such as alternative detection methods, exert competitive pressure. End-user trends, especially in the automotive, industrial, and medical sectors, are crucial drivers of market growth.
- Market Concentration: The top 5 players hold approximately xx% of the global market share in 2025.
- Innovation Ecosystem: Significant R&D investments are focused on improving sensor sensitivity, selectivity, and longevity.
- Regulatory Frameworks: Compliance with safety and environmental standards is paramount, impacting product design and market access.
- M&A Activities: Consolidation through acquisitions is expected to continue, driving market concentration and shaping technological landscapes. The total value of M&A deals in the sector between 2019-2024 was approximately xx Million.
Gas Sensors Market Industry Trends & Insights
The global Gas Sensors Market is experiencing substantial growth, propelled by increasing demand across diverse applications. The Compound Annual Growth Rate (CAGR) is projected to be xx% during the forecast period (2025-2033). Technological disruptions, such as the miniaturization of sensors and the integration of smart functionalities, are transforming the market landscape. Consumer preferences are shifting towards higher accuracy, improved reliability, and cost-effectiveness. The competitive dynamics are characterized by intense innovation and strategic partnerships, fostering market evolution. Market penetration in key sectors, such as automotive and industrial, continues to rise, driven by stringent emission regulations and the need for enhanced safety and efficiency.
Dominant Markets & Segments in Gas Sensors Market
The Asia-Pacific region is projected to dominate the Gas Sensors Market throughout the forecast period due to rapid industrialization, rising urbanization, and government initiatives promoting environmental monitoring. Within specific segments:
- By Type: The Carbon Monoxide (CO) sensor segment is projected to hold a significant market share due to stringent emission control regulations in the automotive and industrial sectors.
- By Technology: Electrochemical sensors remain dominant due to their cost-effectiveness and reliability, while the adoption of Solid State/Metal Oxide Semiconductor sensors is steadily increasing due to their miniaturization potential.
- By Application: The automotive industry drives substantial demand for gas sensors due to stricter emission standards and safety requirements. The industrial sector is another significant driver, with demand across various applications like process monitoring and leak detection.
Key Drivers:
- Stringent emission regulations: Driving adoption in automotive and industrial sectors.
- Growing focus on safety and environmental monitoring: Increasing demand in various applications.
- Advances in sensor technology: Enhanced performance and miniaturization.
- Expanding industrial automation: Driving demand for process monitoring and control.
Gas Sensors Market Product Innovations
Recent innovations focus on improving sensor sensitivity, miniaturization, and integration capabilities. Advancements in materials science and microfabrication technologies are leading to more cost-effective and reliable sensors. Companies are integrating sensors into smart devices and systems, creating new application opportunities across various sectors. The focus on developing sensors with enhanced selectivity and improved response times is also driving innovation in the market. These trends collectively contribute to increased market penetration and higher adoption rates.
Report Segmentation & Scope
This report provides a detailed segmentation of the Gas Sensors Market based on Type (Oxygen, Carbon Monoxide (CO), Carbon Dioxide (CO2), Nitrogen Oxide, Hydrocarbon, Other Types), Technology (Electrochemical, Photoionization Detectors (PID), Solid State/Metal Oxide Semiconductor, Catalytic, Infrared, Semiconductor), and Application (Medical, Building Automation, Industrial, Food and Beverages, Automotive, Transportation and Logistics, Other Applications). Each segment's growth projections, market size, and competitive dynamics are analyzed thoroughly. Detailed market sizing for each segment is provided, with specific growth rates for each segment during the forecast period. Competitive analysis examines market share, strengths, and weaknesses of key players within each segment.
Key Drivers of Gas Sensors Market Growth
Several factors drive the growth of the Gas Sensors Market: the increasing need for environmental monitoring, stringent emission regulations, rapid industrialization, and technological advancements leading to smaller, more efficient and cost-effective sensors. The automotive industry's adoption of advanced driver-assistance systems (ADAS) and stricter emissions standards significantly boost demand. Growing awareness of indoor air quality is also a key driver, expanding the market in building automation and residential applications.
Challenges in the Gas Sensors Market Sector
Challenges include the high cost of advanced sensor technologies, concerns about sensor durability and lifespan, and the need for robust calibration and maintenance procedures. Supply chain disruptions can impact sensor availability and cost. Competition from established players and new entrants also poses a challenge. Meeting stringent regulatory requirements across different geographical regions adds complexity to the market. The variability of gas compositions in different applications requires sensors with high selectivity and robustness.
Leading Players in the Gas Sensors Market Market
- Figaro Engineering Inc
- Nemoto & Co Ltd
- Niterra Co Ltd (NGK-NTK)
- SGX Sensortech Ltd (Amphenol Corporation)
- Robert Bosch GmbH
- Delphi Technologies
- Drägerwerk AG & Co KGaA
- Senseair (Asahi Kasei)
- AlphaSense Inc
- Zhengzhou Winsen Electronics Technology Co Ltd
- Membrapor AG
Key Developments in Gas Sensors Market Sector
- May 2024: Nemoto & Co Ltd announced the release of an electrochemical gas sensor integrated into a 4-20mA transmitter base, simplifying signal interpretation and offering diverse mounting options.
- May 2024: NET introduced a new thermal conductivity sensor for hydrogen detection using MEMS and CMOS technology, reducing production costs and power consumption compared to catalytic sensors. This offers a broader detection range, even in oxygen-free environments.
Strategic Gas Sensors Market Market Outlook
The future of the Gas Sensors Market appears bright, driven by ongoing technological advancements and increasing demand across diverse sectors. Strategic opportunities exist in developing highly sensitive, selective, and cost-effective sensors for emerging applications, such as environmental monitoring, healthcare, and the Internet of Things (IoT). Companies focusing on innovation, strategic partnerships, and expansion into high-growth markets are poised for significant success. The market's growth will be fueled by stringent environmental regulations and increasing focus on safety and efficiency across various industries.
Gas Sensors Market Segmentation
-
1. Type
- 1.1. Oxygen
- 1.2. Carbon Monoxide (CO)
- 1.3. Carbon Dioxide (CO2)
- 1.4. Nitrogen Oxide
- 1.5. Hydrocarbon
- 1.6. Other Types
-
2. Technology
- 2.1. Electrochemical
- 2.2. Photoionization Detectors (PID)
- 2.3. Solid State/Metal Oxide Semiconductor
- 2.4. Catalytic
- 2.5. Infrared
-
3. Application
- 3.1. Medical
- 3.2. Building Automation
- 3.3. Industrial
- 3.4. Food and Beverages
- 3.5. Automotive
- 3.6. Transportation and Logistics
- 3.7. Other Applications
Gas Sensors Market Segmentation By Geography
- 1. North America
- 2. Europe
- 3. Asia
- 4. Australia and New Zealand
- 5. Latin America
- 6. Middle East and Africa
Gas Sensors Market REPORT HIGHLIGHTS
| Aspects | Details |
|---|---|
| Study Period | 2019-2033 |
| Base Year | 2024 |
| Estimated Year | 2025 |
| Forecast Period | 2025-2033 |
| Historical Period | 2019-2024 |
| Growth Rate | CAGR of 10.42% from 2019-2033 |
| Segmentation |
|
Table of Contents
- 1. Introduction
- 1.1. Research Scope
- 1.2. Market Segmentation
- 1.3. Research Methodology
- 1.4. Definitions and Assumptions
- 2. Executive Summary
- 2.1. Introduction
- 3. Market Dynamics
- 3.1. Introduction
- 3.2. Market Drivers
- 3.2.1. Increased Demand for Gas Sensors in Automobiles for Compliance with Governmental Regulations; Growing Awareness on Occupational Hazards across Major Industries
- 3.3. Market Restrains
- 3.3.1. Loss Due to Restrictions of Smaller Players to Participate Owing to Potential Low Turnouts
- 3.4. Market Trends
- 3.4.1. Carbon Monoxide (CO) Segment to Hold Significant Market Share
- 4. Market Factor Analysis
- 4.1. Porters Five Forces
- 4.2. Supply/Value Chain
- 4.3. PESTEL analysis
- 4.4. Market Entropy
- 4.5. Patent/Trademark Analysis
- 5. Global Gas Sensors Market Analysis, Insights and Forecast, 2019-2031
- 5.1. Market Analysis, Insights and Forecast - by Type
- 5.1.1. Oxygen
- 5.1.2. Carbon Monoxide (CO)
- 5.1.3. Carbon Dioxide (CO2)
- 5.1.4. Nitrogen Oxide
- 5.1.5. Hydrocarbon
- 5.1.6. Other Types
- 5.2. Market Analysis, Insights and Forecast - by Technology
- 5.2.1. Electrochemical
- 5.2.2. Photoionization Detectors (PID)
- 5.2.3. Solid State/Metal Oxide Semiconductor
- 5.2.4. Catalytic
- 5.2.5. Infrared
- 5.3. Market Analysis, Insights and Forecast - by Application
- 5.3.1. Medical
- 5.3.2. Building Automation
- 5.3.3. Industrial
- 5.3.4. Food and Beverages
- 5.3.5. Automotive
- 5.3.6. Transportation and Logistics
- 5.3.7. Other Applications
- 5.4. Market Analysis, Insights and Forecast - by Region
- 5.4.1. North America
- 5.4.2. Europe
- 5.4.3. Asia
- 5.4.4. Australia and New Zealand
- 5.4.5. Latin America
- 5.4.6. Middle East and Africa
- 5.1. Market Analysis, Insights and Forecast - by Type
- 6. North America Gas Sensors Market Analysis, Insights and Forecast, 2019-2031
- 6.1. Market Analysis, Insights and Forecast - by Type
- 6.1.1. Oxygen
- 6.1.2. Carbon Monoxide (CO)
- 6.1.3. Carbon Dioxide (CO2)
- 6.1.4. Nitrogen Oxide
- 6.1.5. Hydrocarbon
- 6.1.6. Other Types
- 6.2. Market Analysis, Insights and Forecast - by Technology
- 6.2.1. Electrochemical
- 6.2.2. Photoionization Detectors (PID)
- 6.2.3. Solid State/Metal Oxide Semiconductor
- 6.2.4. Catalytic
- 6.2.5. Infrared
- 6.3. Market Analysis, Insights and Forecast - by Application
- 6.3.1. Medical
- 6.3.2. Building Automation
- 6.3.3. Industrial
- 6.3.4. Food and Beverages
- 6.3.5. Automotive
- 6.3.6. Transportation and Logistics
- 6.3.7. Other Applications
- 6.1. Market Analysis, Insights and Forecast - by Type
- 7. Europe Gas Sensors Market Analysis, Insights and Forecast, 2019-2031
- 7.1. Market Analysis, Insights and Forecast - by Type
- 7.1.1. Oxygen
- 7.1.2. Carbon Monoxide (CO)
- 7.1.3. Carbon Dioxide (CO2)
- 7.1.4. Nitrogen Oxide
- 7.1.5. Hydrocarbon
- 7.1.6. Other Types
- 7.2. Market Analysis, Insights and Forecast - by Technology
- 7.2.1. Electrochemical
- 7.2.2. Photoionization Detectors (PID)
- 7.2.3. Solid State/Metal Oxide Semiconductor
- 7.2.4. Catalytic
- 7.2.5. Infrared
- 7.3. Market Analysis, Insights and Forecast - by Application
- 7.3.1. Medical
- 7.3.2. Building Automation
- 7.3.3. Industrial
- 7.3.4. Food and Beverages
- 7.3.5. Automotive
- 7.3.6. Transportation and Logistics
- 7.3.7. Other Applications
- 7.1. Market Analysis, Insights and Forecast - by Type
- 8. Asia Gas Sensors Market Analysis, Insights and Forecast, 2019-2031
- 8.1. Market Analysis, Insights and Forecast - by Type
- 8.1.1. Oxygen
- 8.1.2. Carbon Monoxide (CO)
- 8.1.3. Carbon Dioxide (CO2)
- 8.1.4. Nitrogen Oxide
- 8.1.5. Hydrocarbon
- 8.1.6. Other Types
- 8.2. Market Analysis, Insights and Forecast - by Technology
- 8.2.1. Electrochemical
- 8.2.2. Photoionization Detectors (PID)
- 8.2.3. Solid State/Metal Oxide Semiconductor
- 8.2.4. Catalytic
- 8.2.5. Infrared
- 8.3. Market Analysis, Insights and Forecast - by Application
- 8.3.1. Medical
- 8.3.2. Building Automation
- 8.3.3. Industrial
- 8.3.4. Food and Beverages
- 8.3.5. Automotive
- 8.3.6. Transportation and Logistics
- 8.3.7. Other Applications
- 8.1. Market Analysis, Insights and Forecast - by Type
- 9. Australia and New Zealand Gas Sensors Market Analysis, Insights and Forecast, 2019-2031
- 9.1. Market Analysis, Insights and Forecast - by Type
- 9.1.1. Oxygen
- 9.1.2. Carbon Monoxide (CO)
- 9.1.3. Carbon Dioxide (CO2)
- 9.1.4. Nitrogen Oxide
- 9.1.5. Hydrocarbon
- 9.1.6. Other Types
- 9.2. Market Analysis, Insights and Forecast - by Technology
- 9.2.1. Electrochemical
- 9.2.2. Photoionization Detectors (PID)
- 9.2.3. Solid State/Metal Oxide Semiconductor
- 9.2.4. Catalytic
- 9.2.5. Infrared
- 9.3. Market Analysis, Insights and Forecast - by Application
- 9.3.1. Medical
- 9.3.2. Building Automation
- 9.3.3. Industrial
- 9.3.4. Food and Beverages
- 9.3.5. Automotive
- 9.3.6. Transportation and Logistics
- 9.3.7. Other Applications
- 9.1. Market Analysis, Insights and Forecast - by Type
- 10. Latin America Gas Sensors Market Analysis, Insights and Forecast, 2019-2031
- 10.1. Market Analysis, Insights and Forecast - by Type
- 10.1.1. Oxygen
- 10.1.2. Carbon Monoxide (CO)
- 10.1.3. Carbon Dioxide (CO2)
- 10.1.4. Nitrogen Oxide
- 10.1.5. Hydrocarbon
- 10.1.6. Other Types
- 10.2. Market Analysis, Insights and Forecast - by Technology
- 10.2.1. Electrochemical
- 10.2.2. Photoionization Detectors (PID)
- 10.2.3. Solid State/Metal Oxide Semiconductor
- 10.2.4. Catalytic
- 10.2.5. Infrared
- 10.3. Market Analysis, Insights and Forecast - by Application
- 10.3.1. Medical
- 10.3.2. Building Automation
- 10.3.3. Industrial
- 10.3.4. Food and Beverages
- 10.3.5. Automotive
- 10.3.6. Transportation and Logistics
- 10.3.7. Other Applications
- 10.1. Market Analysis, Insights and Forecast - by Type
- 11. Middle East and Africa Gas Sensors Market Analysis, Insights and Forecast, 2019-2031
- 11.1. Market Analysis, Insights and Forecast - by Type
- 11.1.1. Oxygen
- 11.1.2. Carbon Monoxide (CO)
- 11.1.3. Carbon Dioxide (CO2)
- 11.1.4. Nitrogen Oxide
- 11.1.5. Hydrocarbon
- 11.1.6. Other Types
- 11.2. Market Analysis, Insights and Forecast - by Technology
- 11.2.1. Electrochemical
- 11.2.2. Photoionization Detectors (PID)
- 11.2.3. Solid State/Metal Oxide Semiconductor
- 11.2.4. Catalytic
- 11.2.5. Infrared
- 11.3. Market Analysis, Insights and Forecast - by Application
- 11.3.1. Medical
- 11.3.2. Building Automation
- 11.3.3. Industrial
- 11.3.4. Food and Beverages
- 11.3.5. Automotive
- 11.3.6. Transportation and Logistics
- 11.3.7. Other Applications
- 11.1. Market Analysis, Insights and Forecast - by Type
- 12. North America Gas Sensors Market Analysis, Insights and Forecast, 2019-2031
- 12.1. Market Analysis, Insights and Forecast - By Country/Sub-region
- 12.1.1 United States
- 12.1.2 Canada
- 12.1.3 Mexico
- 13. Europe Gas Sensors Market Analysis, Insights and Forecast, 2019-2031
- 13.1. Market Analysis, Insights and Forecast - By Country/Sub-region
- 13.1.1 Germany
- 13.1.2 United Kingdom
- 13.1.3 France
- 13.1.4 Spain
- 13.1.5 Italy
- 13.1.6 Spain
- 13.1.7 Belgium
- 13.1.8 Netherland
- 13.1.9 Nordics
- 13.1.10 Rest of Europe
- 14. Asia Pacific Gas Sensors Market Analysis, Insights and Forecast, 2019-2031
- 14.1. Market Analysis, Insights and Forecast - By Country/Sub-region
- 14.1.1 China
- 14.1.2 Japan
- 14.1.3 India
- 14.1.4 South Korea
- 14.1.5 Southeast Asia
- 14.1.6 Australia
- 14.1.7 Indonesia
- 14.1.8 Phillipes
- 14.1.9 Singapore
- 14.1.10 Thailandc
- 14.1.11 Rest of Asia Pacific
- 15. South America Gas Sensors Market Analysis, Insights and Forecast, 2019-2031
- 15.1. Market Analysis, Insights and Forecast - By Country/Sub-region
- 15.1.1 Brazil
- 15.1.2 Argentina
- 15.1.3 Peru
- 15.1.4 Chile
- 15.1.5 Colombia
- 15.1.6 Ecuador
- 15.1.7 Venezuela
- 15.1.8 Rest of South America
- 16. North America Gas Sensors Market Analysis, Insights and Forecast, 2019-2031
- 16.1. Market Analysis, Insights and Forecast - By Country/Sub-region
- 16.1.1 United States
- 16.1.2 Canada
- 16.1.3 Mexico
- 17. MEA Gas Sensors Market Analysis, Insights and Forecast, 2019-2031
- 17.1. Market Analysis, Insights and Forecast - By Country/Sub-region
- 17.1.1 United Arab Emirates
- 17.1.2 Saudi Arabia
- 17.1.3 South Africa
- 17.1.4 Rest of Middle East and Africa
- 18. Competitive Analysis
- 18.1. Global Market Share Analysis 2024
- 18.2. Company Profiles
- 18.2.1 Figaro Engineering Inc
- 18.2.1.1. Overview
- 18.2.1.2. Products
- 18.2.1.3. SWOT Analysis
- 18.2.1.4. Recent Developments
- 18.2.1.5. Financials (Based on Availability)
- 18.2.2 Nemoto & Co Ltd
- 18.2.2.1. Overview
- 18.2.2.2. Products
- 18.2.2.3. SWOT Analysis
- 18.2.2.4. Recent Developments
- 18.2.2.5. Financials (Based on Availability)
- 18.2.3 Niterra Co Ltd (NGK-NTK)
- 18.2.3.1. Overview
- 18.2.3.2. Products
- 18.2.3.3. SWOT Analysis
- 18.2.3.4. Recent Developments
- 18.2.3.5. Financials (Based on Availability)
- 18.2.4 SGX Sensortech Ltd (Amphenol Corporation)
- 18.2.4.1. Overview
- 18.2.4.2. Products
- 18.2.4.3. SWOT Analysis
- 18.2.4.4. Recent Developments
- 18.2.4.5. Financials (Based on Availability)
- 18.2.5 Robert Bosch GmbH
- 18.2.5.1. Overview
- 18.2.5.2. Products
- 18.2.5.3. SWOT Analysis
- 18.2.5.4. Recent Developments
- 18.2.5.5. Financials (Based on Availability)
- 18.2.6 Delphi Technologies
- 18.2.6.1. Overview
- 18.2.6.2. Products
- 18.2.6.3. SWOT Analysis
- 18.2.6.4. Recent Developments
- 18.2.6.5. Financials (Based on Availability)
- 18.2.7 Drgerwerk AG & Co KGa
- 18.2.7.1. Overview
- 18.2.7.2. Products
- 18.2.7.3. SWOT Analysis
- 18.2.7.4. Recent Developments
- 18.2.7.5. Financials (Based on Availability)
- 18.2.8 Senseair (Asahi Kesai)
- 18.2.8.1. Overview
- 18.2.8.2. Products
- 18.2.8.3. SWOT Analysis
- 18.2.8.4. Recent Developments
- 18.2.8.5. Financials (Based on Availability)
- 18.2.9 AlphaSense Inc
- 18.2.9.1. Overview
- 18.2.9.2. Products
- 18.2.9.3. SWOT Analysis
- 18.2.9.4. Recent Developments
- 18.2.9.5. Financials (Based on Availability)
- 18.2.10 Zhengzhou Winsen Electronics Technology Co Ltd
- 18.2.10.1. Overview
- 18.2.10.2. Products
- 18.2.10.3. SWOT Analysis
- 18.2.10.4. Recent Developments
- 18.2.10.5. Financials (Based on Availability)
- 18.2.11 Membrapor AG
- 18.2.11.1. Overview
- 18.2.11.2. Products
- 18.2.11.3. SWOT Analysis
- 18.2.11.4. Recent Developments
- 18.2.11.5. Financials (Based on Availability)
- 18.2.1 Figaro Engineering Inc
List of Figures
- Figure 1: Global Gas Sensors Market Revenue Breakdown (Million, %) by Region 2024 & 2032
- Figure 2: Global Gas Sensors Market Volume Breakdown (K Unit, %) by Region 2024 & 2032
- Figure 3: North America Gas Sensors Market Revenue (Million), by Country 2024 & 2032
- Figure 4: North America Gas Sensors Market Volume (K Unit), by Country 2024 & 2032
- Figure 5: North America Gas Sensors Market Revenue Share (%), by Country 2024 & 2032
- Figure 6: North America Gas Sensors Market Volume Share (%), by Country 2024 & 2032
- Figure 7: Europe Gas Sensors Market Revenue (Million), by Country 2024 & 2032
- Figure 8: Europe Gas Sensors Market Volume (K Unit), by Country 2024 & 2032
- Figure 9: Europe Gas Sensors Market Revenue Share (%), by Country 2024 & 2032
- Figure 10: Europe Gas Sensors Market Volume Share (%), by Country 2024 & 2032
- Figure 11: Asia Pacific Gas Sensors Market Revenue (Million), by Country 2024 & 2032
- Figure 12: Asia Pacific Gas Sensors Market Volume (K Unit), by Country 2024 & 2032
- Figure 13: Asia Pacific Gas Sensors Market Revenue Share (%), by Country 2024 & 2032
- Figure 14: Asia Pacific Gas Sensors Market Volume Share (%), by Country 2024 & 2032
- Figure 15: South America Gas Sensors Market Revenue (Million), by Country 2024 & 2032
- Figure 16: South America Gas Sensors Market Volume (K Unit), by Country 2024 & 2032
- Figure 17: South America Gas Sensors Market Revenue Share (%), by Country 2024 & 2032
- Figure 18: South America Gas Sensors Market Volume Share (%), by Country 2024 & 2032
- Figure 19: North America Gas Sensors Market Revenue (Million), by Country 2024 & 2032
- Figure 20: North America Gas Sensors Market Volume (K Unit), by Country 2024 & 2032
- Figure 21: North America Gas Sensors Market Revenue Share (%), by Country 2024 & 2032
- Figure 22: North America Gas Sensors Market Volume Share (%), by Country 2024 & 2032
- Figure 23: MEA Gas Sensors Market Revenue (Million), by Country 2024 & 2032
- Figure 24: MEA Gas Sensors Market Volume (K Unit), by Country 2024 & 2032
- Figure 25: MEA Gas Sensors Market Revenue Share (%), by Country 2024 & 2032
- Figure 26: MEA Gas Sensors Market Volume Share (%), by Country 2024 & 2032
- Figure 27: North America Gas Sensors Market Revenue (Million), by Type 2024 & 2032
- Figure 28: North America Gas Sensors Market Volume (K Unit), by Type 2024 & 2032
- Figure 29: North America Gas Sensors Market Revenue Share (%), by Type 2024 & 2032
- Figure 30: North America Gas Sensors Market Volume Share (%), by Type 2024 & 2032
- Figure 31: North America Gas Sensors Market Revenue (Million), by Technology 2024 & 2032
- Figure 32: North America Gas Sensors Market Volume (K Unit), by Technology 2024 & 2032
- Figure 33: North America Gas Sensors Market Revenue Share (%), by Technology 2024 & 2032
- Figure 34: North America Gas Sensors Market Volume Share (%), by Technology 2024 & 2032
- Figure 35: North America Gas Sensors Market Revenue (Million), by Application 2024 & 2032
- Figure 36: North America Gas Sensors Market Volume (K Unit), by Application 2024 & 2032
- Figure 37: North America Gas Sensors Market Revenue Share (%), by Application 2024 & 2032
- Figure 38: North America Gas Sensors Market Volume Share (%), by Application 2024 & 2032
- Figure 39: North America Gas Sensors Market Revenue (Million), by Country 2024 & 2032
- Figure 40: North America Gas Sensors Market Volume (K Unit), by Country 2024 & 2032
- Figure 41: North America Gas Sensors Market Revenue Share (%), by Country 2024 & 2032
- Figure 42: North America Gas Sensors Market Volume Share (%), by Country 2024 & 2032
- Figure 43: Europe Gas Sensors Market Revenue (Million), by Type 2024 & 2032
- Figure 44: Europe Gas Sensors Market Volume (K Unit), by Type 2024 & 2032
- Figure 45: Europe Gas Sensors Market Revenue Share (%), by Type 2024 & 2032
- Figure 46: Europe Gas Sensors Market Volume Share (%), by Type 2024 & 2032
- Figure 47: Europe Gas Sensors Market Revenue (Million), by Technology 2024 & 2032
- Figure 48: Europe Gas Sensors Market Volume (K Unit), by Technology 2024 & 2032
- Figure 49: Europe Gas Sensors Market Revenue Share (%), by Technology 2024 & 2032
- Figure 50: Europe Gas Sensors Market Volume Share (%), by Technology 2024 & 2032
- Figure 51: Europe Gas Sensors Market Revenue (Million), by Application 2024 & 2032
- Figure 52: Europe Gas Sensors Market Volume (K Unit), by Application 2024 & 2032
- Figure 53: Europe Gas Sensors Market Revenue Share (%), by Application 2024 & 2032
- Figure 54: Europe Gas Sensors Market Volume Share (%), by Application 2024 & 2032
- Figure 55: Europe Gas Sensors Market Revenue (Million), by Country 2024 & 2032
- Figure 56: Europe Gas Sensors Market Volume (K Unit), by Country 2024 & 2032
- Figure 57: Europe Gas Sensors Market Revenue Share (%), by Country 2024 & 2032
- Figure 58: Europe Gas Sensors Market Volume Share (%), by Country 2024 & 2032
- Figure 59: Asia Gas Sensors Market Revenue (Million), by Type 2024 & 2032
- Figure 60: Asia Gas Sensors Market Volume (K Unit), by Type 2024 & 2032
- Figure 61: Asia Gas Sensors Market Revenue Share (%), by Type 2024 & 2032
- Figure 62: Asia Gas Sensors Market Volume Share (%), by Type 2024 & 2032
- Figure 63: Asia Gas Sensors Market Revenue (Million), by Technology 2024 & 2032
- Figure 64: Asia Gas Sensors Market Volume (K Unit), by Technology 2024 & 2032
- Figure 65: Asia Gas Sensors Market Revenue Share (%), by Technology 2024 & 2032
- Figure 66: Asia Gas Sensors Market Volume Share (%), by Technology 2024 & 2032
- Figure 67: Asia Gas Sensors Market Revenue (Million), by Application 2024 & 2032
- Figure 68: Asia Gas Sensors Market Volume (K Unit), by Application 2024 & 2032
- Figure 69: Asia Gas Sensors Market Revenue Share (%), by Application 2024 & 2032
- Figure 70: Asia Gas Sensors Market Volume Share (%), by Application 2024 & 2032
- Figure 71: Asia Gas Sensors Market Revenue (Million), by Country 2024 & 2032
- Figure 72: Asia Gas Sensors Market Volume (K Unit), by Country 2024 & 2032
- Figure 73: Asia Gas Sensors Market Revenue Share (%), by Country 2024 & 2032
- Figure 74: Asia Gas Sensors Market Volume Share (%), by Country 2024 & 2032
- Figure 75: Australia and New Zealand Gas Sensors Market Revenue (Million), by Type 2024 & 2032
- Figure 76: Australia and New Zealand Gas Sensors Market Volume (K Unit), by Type 2024 & 2032
- Figure 77: Australia and New Zealand Gas Sensors Market Revenue Share (%), by Type 2024 & 2032
- Figure 78: Australia and New Zealand Gas Sensors Market Volume Share (%), by Type 2024 & 2032
- Figure 79: Australia and New Zealand Gas Sensors Market Revenue (Million), by Technology 2024 & 2032
- Figure 80: Australia and New Zealand Gas Sensors Market Volume (K Unit), by Technology 2024 & 2032
- Figure 81: Australia and New Zealand Gas Sensors Market Revenue Share (%), by Technology 2024 & 2032
- Figure 82: Australia and New Zealand Gas Sensors Market Volume Share (%), by Technology 2024 & 2032
- Figure 83: Australia and New Zealand Gas Sensors Market Revenue (Million), by Application 2024 & 2032
- Figure 84: Australia and New Zealand Gas Sensors Market Volume (K Unit), by Application 2024 & 2032
- Figure 85: Australia and New Zealand Gas Sensors Market Revenue Share (%), by Application 2024 & 2032
- Figure 86: Australia and New Zealand Gas Sensors Market Volume Share (%), by Application 2024 & 2032
- Figure 87: Australia and New Zealand Gas Sensors Market Revenue (Million), by Country 2024 & 2032
- Figure 88: Australia and New Zealand Gas Sensors Market Volume (K Unit), by Country 2024 & 2032
- Figure 89: Australia and New Zealand Gas Sensors Market Revenue Share (%), by Country 2024 & 2032
- Figure 90: Australia and New Zealand Gas Sensors Market Volume Share (%), by Country 2024 & 2032
- Figure 91: Latin America Gas Sensors Market Revenue (Million), by Type 2024 & 2032
- Figure 92: Latin America Gas Sensors Market Volume (K Unit), by Type 2024 & 2032
- Figure 93: Latin America Gas Sensors Market Revenue Share (%), by Type 2024 & 2032
- Figure 94: Latin America Gas Sensors Market Volume Share (%), by Type 2024 & 2032
- Figure 95: Latin America Gas Sensors Market Revenue (Million), by Technology 2024 & 2032
- Figure 96: Latin America Gas Sensors Market Volume (K Unit), by Technology 2024 & 2032
- Figure 97: Latin America Gas Sensors Market Revenue Share (%), by Technology 2024 & 2032
- Figure 98: Latin America Gas Sensors Market Volume Share (%), by Technology 2024 & 2032
- Figure 99: Latin America Gas Sensors Market Revenue (Million), by Application 2024 & 2032
- Figure 100: Latin America Gas Sensors Market Volume (K Unit), by Application 2024 & 2032
- Figure 101: Latin America Gas Sensors Market Revenue Share (%), by Application 2024 & 2032
- Figure 102: Latin America Gas Sensors Market Volume Share (%), by Application 2024 & 2032
- Figure 103: Latin America Gas Sensors Market Revenue (Million), by Country 2024 & 2032
- Figure 104: Latin America Gas Sensors Market Volume (K Unit), by Country 2024 & 2032
- Figure 105: Latin America Gas Sensors Market Revenue Share (%), by Country 2024 & 2032
- Figure 106: Latin America Gas Sensors Market Volume Share (%), by Country 2024 & 2032
- Figure 107: Middle East and Africa Gas Sensors Market Revenue (Million), by Type 2024 & 2032
- Figure 108: Middle East and Africa Gas Sensors Market Volume (K Unit), by Type 2024 & 2032
- Figure 109: Middle East and Africa Gas Sensors Market Revenue Share (%), by Type 2024 & 2032
- Figure 110: Middle East and Africa Gas Sensors Market Volume Share (%), by Type 2024 & 2032
- Figure 111: Middle East and Africa Gas Sensors Market Revenue (Million), by Technology 2024 & 2032
- Figure 112: Middle East and Africa Gas Sensors Market Volume (K Unit), by Technology 2024 & 2032
- Figure 113: Middle East and Africa Gas Sensors Market Revenue Share (%), by Technology 2024 & 2032
- Figure 114: Middle East and Africa Gas Sensors Market Volume Share (%), by Technology 2024 & 2032
- Figure 115: Middle East and Africa Gas Sensors Market Revenue (Million), by Application 2024 & 2032
- Figure 116: Middle East and Africa Gas Sensors Market Volume (K Unit), by Application 2024 & 2032
- Figure 117: Middle East and Africa Gas Sensors Market Revenue Share (%), by Application 2024 & 2032
- Figure 118: Middle East and Africa Gas Sensors Market Volume Share (%), by Application 2024 & 2032
- Figure 119: Middle East and Africa Gas Sensors Market Revenue (Million), by Country 2024 & 2032
- Figure 120: Middle East and Africa Gas Sensors Market Volume (K Unit), by Country 2024 & 2032
- Figure 121: Middle East and Africa Gas Sensors Market Revenue Share (%), by Country 2024 & 2032
- Figure 122: Middle East and Africa Gas Sensors Market Volume Share (%), by Country 2024 & 2032
List of Tables
- Table 1: Global Gas Sensors Market Revenue Million Forecast, by Region 2019 & 2032
- Table 2: Global Gas Sensors Market Volume K Unit Forecast, by Region 2019 & 2032
- Table 3: Global Gas Sensors Market Revenue Million Forecast, by Type 2019 & 2032
- Table 4: Global Gas Sensors Market Volume K Unit Forecast, by Type 2019 & 2032
- Table 5: Global Gas Sensors Market Revenue Million Forecast, by Technology 2019 & 2032
- Table 6: Global Gas Sensors Market Volume K Unit Forecast, by Technology 2019 & 2032
- Table 7: Global Gas Sensors Market Revenue Million Forecast, by Application 2019 & 2032
- Table 8: Global Gas Sensors Market Volume K Unit Forecast, by Application 2019 & 2032
- Table 9: Global Gas Sensors Market Revenue Million Forecast, by Region 2019 & 2032
- Table 10: Global Gas Sensors Market Volume K Unit Forecast, by Region 2019 & 2032
- Table 11: Global Gas Sensors Market Revenue Million Forecast, by Country 2019 & 2032
- Table 12: Global Gas Sensors Market Volume K Unit Forecast, by Country 2019 & 2032
- Table 13: United States Gas Sensors Market Revenue (Million) Forecast, by Application 2019 & 2032
- Table 14: United States Gas Sensors Market Volume (K Unit) Forecast, by Application 2019 & 2032
- Table 15: Canada Gas Sensors Market Revenue (Million) Forecast, by Application 2019 & 2032
- Table 16: Canada Gas Sensors Market Volume (K Unit) Forecast, by Application 2019 & 2032
- Table 17: Mexico Gas Sensors Market Revenue (Million) Forecast, by Application 2019 & 2032
- Table 18: Mexico Gas Sensors Market Volume (K Unit) Forecast, by Application 2019 & 2032
- Table 19: Global Gas Sensors Market Revenue Million Forecast, by Country 2019 & 2032
- Table 20: Global Gas Sensors Market Volume K Unit Forecast, by Country 2019 & 2032
- Table 21: Germany Gas Sensors Market Revenue (Million) Forecast, by Application 2019 & 2032
- Table 22: Germany Gas Sensors Market Volume (K Unit) Forecast, by Application 2019 & 2032
- Table 23: United Kingdom Gas Sensors Market Revenue (Million) Forecast, by Application 2019 & 2032
- Table 24: United Kingdom Gas Sensors Market Volume (K Unit) Forecast, by Application 2019 & 2032
- Table 25: France Gas Sensors Market Revenue (Million) Forecast, by Application 2019 & 2032
- Table 26: France Gas Sensors Market Volume (K Unit) Forecast, by Application 2019 & 2032
- Table 27: Spain Gas Sensors Market Revenue (Million) Forecast, by Application 2019 & 2032
- Table 28: Spain Gas Sensors Market Volume (K Unit) Forecast, by Application 2019 & 2032
- Table 29: Italy Gas Sensors Market Revenue (Million) Forecast, by Application 2019 & 2032
- Table 30: Italy Gas Sensors Market Volume (K Unit) Forecast, by Application 2019 & 2032
- Table 31: Spain Gas Sensors Market Revenue (Million) Forecast, by Application 2019 & 2032
- Table 32: Spain Gas Sensors Market Volume (K Unit) Forecast, by Application 2019 & 2032
- Table 33: Belgium Gas Sensors Market Revenue (Million) Forecast, by Application 2019 & 2032
- Table 34: Belgium Gas Sensors Market Volume (K Unit) Forecast, by Application 2019 & 2032
- Table 35: Netherland Gas Sensors Market Revenue (Million) Forecast, by Application 2019 & 2032
- Table 36: Netherland Gas Sensors Market Volume (K Unit) Forecast, by Application 2019 & 2032
- Table 37: Nordics Gas Sensors Market Revenue (Million) Forecast, by Application 2019 & 2032
- Table 38: Nordics Gas Sensors Market Volume (K Unit) Forecast, by Application 2019 & 2032
- Table 39: Rest of Europe Gas Sensors Market Revenue (Million) Forecast, by Application 2019 & 2032
- Table 40: Rest of Europe Gas Sensors Market Volume (K Unit) Forecast, by Application 2019 & 2032
- Table 41: Global Gas Sensors Market Revenue Million Forecast, by Country 2019 & 2032
- Table 42: Global Gas Sensors Market Volume K Unit Forecast, by Country 2019 & 2032
- Table 43: China Gas Sensors Market Revenue (Million) Forecast, by Application 2019 & 2032
- Table 44: China Gas Sensors Market Volume (K Unit) Forecast, by Application 2019 & 2032
- Table 45: Japan Gas Sensors Market Revenue (Million) Forecast, by Application 2019 & 2032
- Table 46: Japan Gas Sensors Market Volume (K Unit) Forecast, by Application 2019 & 2032
- Table 47: India Gas Sensors Market Revenue (Million) Forecast, by Application 2019 & 2032
- Table 48: India Gas Sensors Market Volume (K Unit) Forecast, by Application 2019 & 2032
- Table 49: South Korea Gas Sensors Market Revenue (Million) Forecast, by Application 2019 & 2032
- Table 50: South Korea Gas Sensors Market Volume (K Unit) Forecast, by Application 2019 & 2032
- Table 51: Southeast Asia Gas Sensors Market Revenue (Million) Forecast, by Application 2019 & 2032
- Table 52: Southeast Asia Gas Sensors Market Volume (K Unit) Forecast, by Application 2019 & 2032
- Table 53: Australia Gas Sensors Market Revenue (Million) Forecast, by Application 2019 & 2032
- Table 54: Australia Gas Sensors Market Volume (K Unit) Forecast, by Application 2019 & 2032
- Table 55: Indonesia Gas Sensors Market Revenue (Million) Forecast, by Application 2019 & 2032
- Table 56: Indonesia Gas Sensors Market Volume (K Unit) Forecast, by Application 2019 & 2032
- Table 57: Phillipes Gas Sensors Market Revenue (Million) Forecast, by Application 2019 & 2032
- Table 58: Phillipes Gas Sensors Market Volume (K Unit) Forecast, by Application 2019 & 2032
- Table 59: Singapore Gas Sensors Market Revenue (Million) Forecast, by Application 2019 & 2032
- Table 60: Singapore Gas Sensors Market Volume (K Unit) Forecast, by Application 2019 & 2032
- Table 61: Thailandc Gas Sensors Market Revenue (Million) Forecast, by Application 2019 & 2032
- Table 62: Thailandc Gas Sensors Market Volume (K Unit) Forecast, by Application 2019 & 2032
- Table 63: Rest of Asia Pacific Gas Sensors Market Revenue (Million) Forecast, by Application 2019 & 2032
- Table 64: Rest of Asia Pacific Gas Sensors Market Volume (K Unit) Forecast, by Application 2019 & 2032
- Table 65: Global Gas Sensors Market Revenue Million Forecast, by Country 2019 & 2032
- Table 66: Global Gas Sensors Market Volume K Unit Forecast, by Country 2019 & 2032
- Table 67: Brazil Gas Sensors Market Revenue (Million) Forecast, by Application 2019 & 2032
- Table 68: Brazil Gas Sensors Market Volume (K Unit) Forecast, by Application 2019 & 2032
- Table 69: Argentina Gas Sensors Market Revenue (Million) Forecast, by Application 2019 & 2032
- Table 70: Argentina Gas Sensors Market Volume (K Unit) Forecast, by Application 2019 & 2032
- Table 71: Peru Gas Sensors Market Revenue (Million) Forecast, by Application 2019 & 2032
- Table 72: Peru Gas Sensors Market Volume (K Unit) Forecast, by Application 2019 & 2032
- Table 73: Chile Gas Sensors Market Revenue (Million) Forecast, by Application 2019 & 2032
- Table 74: Chile Gas Sensors Market Volume (K Unit) Forecast, by Application 2019 & 2032
- Table 75: Colombia Gas Sensors Market Revenue (Million) Forecast, by Application 2019 & 2032
- Table 76: Colombia Gas Sensors Market Volume (K Unit) Forecast, by Application 2019 & 2032
- Table 77: Ecuador Gas Sensors Market Revenue (Million) Forecast, by Application 2019 & 2032
- Table 78: Ecuador Gas Sensors Market Volume (K Unit) Forecast, by Application 2019 & 2032
- Table 79: Venezuela Gas Sensors Market Revenue (Million) Forecast, by Application 2019 & 2032
- Table 80: Venezuela Gas Sensors Market Volume (K Unit) Forecast, by Application 2019 & 2032
- Table 81: Rest of South America Gas Sensors Market Revenue (Million) Forecast, by Application 2019 & 2032
- Table 82: Rest of South America Gas Sensors Market Volume (K Unit) Forecast, by Application 2019 & 2032
- Table 83: Global Gas Sensors Market Revenue Million Forecast, by Country 2019 & 2032
- Table 84: Global Gas Sensors Market Volume K Unit Forecast, by Country 2019 & 2032
- Table 85: United States Gas Sensors Market Revenue (Million) Forecast, by Application 2019 & 2032
- Table 86: United States Gas Sensors Market Volume (K Unit) Forecast, by Application 2019 & 2032
- Table 87: Canada Gas Sensors Market Revenue (Million) Forecast, by Application 2019 & 2032
- Table 88: Canada Gas Sensors Market Volume (K Unit) Forecast, by Application 2019 & 2032
- Table 89: Mexico Gas Sensors Market Revenue (Million) Forecast, by Application 2019 & 2032
- Table 90: Mexico Gas Sensors Market Volume (K Unit) Forecast, by Application 2019 & 2032
- Table 91: Global Gas Sensors Market Revenue Million Forecast, by Country 2019 & 2032
- Table 92: Global Gas Sensors Market Volume K Unit Forecast, by Country 2019 & 2032
- Table 93: United Arab Emirates Gas Sensors Market Revenue (Million) Forecast, by Application 2019 & 2032
- Table 94: United Arab Emirates Gas Sensors Market Volume (K Unit) Forecast, by Application 2019 & 2032
- Table 95: Saudi Arabia Gas Sensors Market Revenue (Million) Forecast, by Application 2019 & 2032
- Table 96: Saudi Arabia Gas Sensors Market Volume (K Unit) Forecast, by Application 2019 & 2032
- Table 97: South Africa Gas Sensors Market Revenue (Million) Forecast, by Application 2019 & 2032
- Table 98: South Africa Gas Sensors Market Volume (K Unit) Forecast, by Application 2019 & 2032
- Table 99: Rest of Middle East and Africa Gas Sensors Market Revenue (Million) Forecast, by Application 2019 & 2032
- Table 100: Rest of Middle East and Africa Gas Sensors Market Volume (K Unit) Forecast, by Application 2019 & 2032
- Table 101: Global Gas Sensors Market Revenue Million Forecast, by Type 2019 & 2032
- Table 102: Global Gas Sensors Market Volume K Unit Forecast, by Type 2019 & 2032
- Table 103: Global Gas Sensors Market Revenue Million Forecast, by Technology 2019 & 2032
- Table 104: Global Gas Sensors Market Volume K Unit Forecast, by Technology 2019 & 2032
- Table 105: Global Gas Sensors Market Revenue Million Forecast, by Application 2019 & 2032
- Table 106: Global Gas Sensors Market Volume K Unit Forecast, by Application 2019 & 2032
- Table 107: Global Gas Sensors Market Revenue Million Forecast, by Country 2019 & 2032
- Table 108: Global Gas Sensors Market Volume K Unit Forecast, by Country 2019 & 2032
- Table 109: Global Gas Sensors Market Revenue Million Forecast, by Type 2019 & 2032
- Table 110: Global Gas Sensors Market Volume K Unit Forecast, by Type 2019 & 2032
- Table 111: Global Gas Sensors Market Revenue Million Forecast, by Technology 2019 & 2032
- Table 112: Global Gas Sensors Market Volume K Unit Forecast, by Technology 2019 & 2032
- Table 113: Global Gas Sensors Market Revenue Million Forecast, by Application 2019 & 2032
- Table 114: Global Gas Sensors Market Volume K Unit Forecast, by Application 2019 & 2032
- Table 115: Global Gas Sensors Market Revenue Million Forecast, by Country 2019 & 2032
- Table 116: Global Gas Sensors Market Volume K Unit Forecast, by Country 2019 & 2032
- Table 117: Global Gas Sensors Market Revenue Million Forecast, by Type 2019 & 2032
- Table 118: Global Gas Sensors Market Volume K Unit Forecast, by Type 2019 & 2032
- Table 119: Global Gas Sensors Market Revenue Million Forecast, by Technology 2019 & 2032
- Table 120: Global Gas Sensors Market Volume K Unit Forecast, by Technology 2019 & 2032
- Table 121: Global Gas Sensors Market Revenue Million Forecast, by Application 2019 & 2032
- Table 122: Global Gas Sensors Market Volume K Unit Forecast, by Application 2019 & 2032
- Table 123: Global Gas Sensors Market Revenue Million Forecast, by Country 2019 & 2032
- Table 124: Global Gas Sensors Market Volume K Unit Forecast, by Country 2019 & 2032
- Table 125: Global Gas Sensors Market Revenue Million Forecast, by Type 2019 & 2032
- Table 126: Global Gas Sensors Market Volume K Unit Forecast, by Type 2019 & 2032
- Table 127: Global Gas Sensors Market Revenue Million Forecast, by Technology 2019 & 2032
- Table 128: Global Gas Sensors Market Volume K Unit Forecast, by Technology 2019 & 2032
- Table 129: Global Gas Sensors Market Revenue Million Forecast, by Application 2019 & 2032
- Table 130: Global Gas Sensors Market Volume K Unit Forecast, by Application 2019 & 2032
- Table 131: Global Gas Sensors Market Revenue Million Forecast, by Country 2019 & 2032
- Table 132: Global Gas Sensors Market Volume K Unit Forecast, by Country 2019 & 2032
- Table 133: Global Gas Sensors Market Revenue Million Forecast, by Type 2019 & 2032
- Table 134: Global Gas Sensors Market Volume K Unit Forecast, by Type 2019 & 2032
- Table 135: Global Gas Sensors Market Revenue Million Forecast, by Technology 2019 & 2032
- Table 136: Global Gas Sensors Market Volume K Unit Forecast, by Technology 2019 & 2032
- Table 137: Global Gas Sensors Market Revenue Million Forecast, by Application 2019 & 2032
- Table 138: Global Gas Sensors Market Volume K Unit Forecast, by Application 2019 & 2032
- Table 139: Global Gas Sensors Market Revenue Million Forecast, by Country 2019 & 2032
- Table 140: Global Gas Sensors Market Volume K Unit Forecast, by Country 2019 & 2032
- Table 141: Global Gas Sensors Market Revenue Million Forecast, by Type 2019 & 2032
- Table 142: Global Gas Sensors Market Volume K Unit Forecast, by Type 2019 & 2032
- Table 143: Global Gas Sensors Market Revenue Million Forecast, by Technology 2019 & 2032
- Table 144: Global Gas Sensors Market Volume K Unit Forecast, by Technology 2019 & 2032
- Table 145: Global Gas Sensors Market Revenue Million Forecast, by Application 2019 & 2032
- Table 146: Global Gas Sensors Market Volume K Unit Forecast, by Application 2019 & 2032
- Table 147: Global Gas Sensors Market Revenue Million Forecast, by Country 2019 & 2032
- Table 148: Global Gas Sensors Market Volume K Unit Forecast, by Country 2019 & 2032
Frequently Asked Questions
1. What is the projected Compound Annual Growth Rate (CAGR) of the Gas Sensors Market?
The projected CAGR is approximately 10.42%.
2. Which companies are prominent players in the Gas Sensors Market?
Key companies in the market include Figaro Engineering Inc, Nemoto & Co Ltd, Niterra Co Ltd (NGK-NTK), SGX Sensortech Ltd (Amphenol Corporation), Robert Bosch GmbH, Delphi Technologies, Drgerwerk AG & Co KGa, Senseair (Asahi Kesai), AlphaSense Inc, Zhengzhou Winsen Electronics Technology Co Ltd, Membrapor AG.
3. What are the main segments of the Gas Sensors Market?
The market segments include Type, Technology, Application.
4. Can you provide details about the market size?
The market size is estimated to be USD 1.53 Million as of 2022.
5. What are some drivers contributing to market growth?
Increased Demand for Gas Sensors in Automobiles for Compliance with Governmental Regulations; Growing Awareness on Occupational Hazards across Major Industries.
6. What are the notable trends driving market growth?
Carbon Monoxide (CO) Segment to Hold Significant Market Share.
7. Are there any restraints impacting market growth?
Loss Due to Restrictions of Smaller Players to Participate Owing to Potential Low Turnouts.
8. Can you provide examples of recent developments in the market?
May 2024 - Nemoto announced the release of an electrochemical gas sensor that can be integrated into a 4-20mA transmitter base. This integration allows users to receive a current output directly correlating to the gas concentration, eliminating the need to interpret the sensor's output signal. The base offers three mounting connector options: straight pin header, right angle pin header, and straight connector.
9. What pricing options are available for accessing the report?
Pricing options include single-user, multi-user, and enterprise licenses priced at USD 4750, USD 5250, and USD 8750 respectively.
10. Is the market size provided in terms of value or volume?
The market size is provided in terms of value, measured in Million and volume, measured in K Unit.
11. Are there any specific market keywords associated with the report?
Yes, the market keyword associated with the report is "Gas Sensors Market," which aids in identifying and referencing the specific market segment covered.
12. How do I determine which pricing option suits my needs best?
The pricing options vary based on user requirements and access needs. Individual users may opt for single-user licenses, while businesses requiring broader access may choose multi-user or enterprise licenses for cost-effective access to the report.
13. Are there any additional resources or data provided in the Gas Sensors Market report?
While the report offers comprehensive insights, it's advisable to review the specific contents or supplementary materials provided to ascertain if additional resources or data are available.
14. How can I stay updated on further developments or reports in the Gas Sensors Market?
To stay informed about further developments, trends, and reports in the Gas Sensors Market, consider subscribing to industry newsletters, following relevant companies and organizations, or regularly checking reputable industry news sources and publications.
Methodology
Step 1 - Identification of Relevant Samples Size from Population Database


Step 2 - Approaches for Defining Global Market Size (Value, Volume* & Price*)

Note*: In applicable scenarios
Step 3 - Data Sources
Primary Research
- Web Analytics
- Survey Reports
- Research Institute
- Latest Research Reports
- Opinion Leaders
Secondary Research
- Annual Reports
- White Paper
- Latest Press Release
- Industry Association
- Paid Database
- Investor Presentations

Step 4 - Data Triangulation
Involves using different sources of information in order to increase the validity of a study
These sources are likely to be stakeholders in a program - participants, other researchers, program staff, other community members, and so on.
Then we put all data in single framework & apply various statistical tools to find out the dynamic on the market.
During the analysis stage, feedback from the stakeholder groups would be compared to determine areas of agreement as well as areas of divergence


