
Key Insights
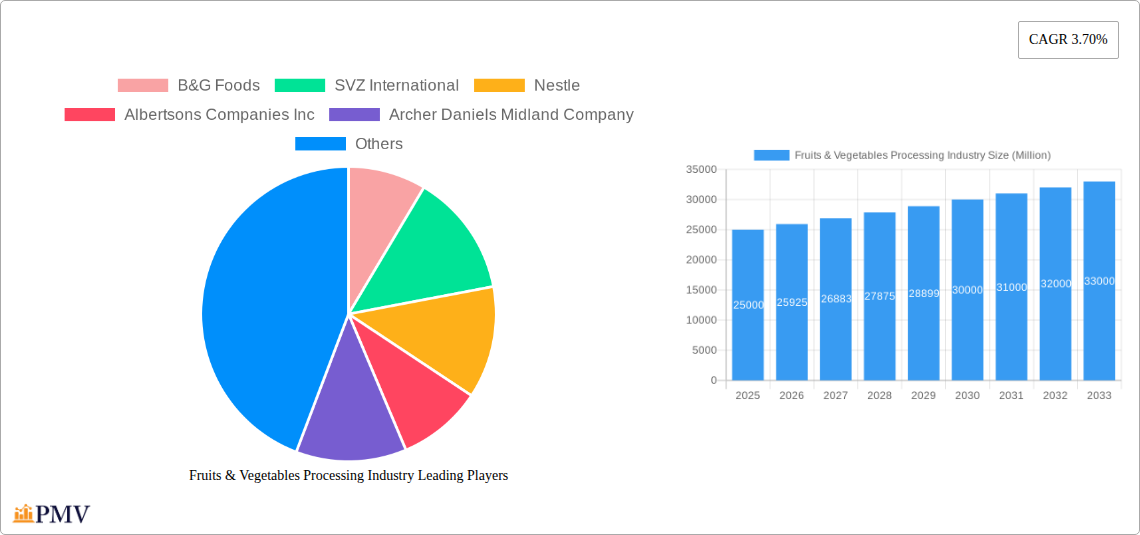
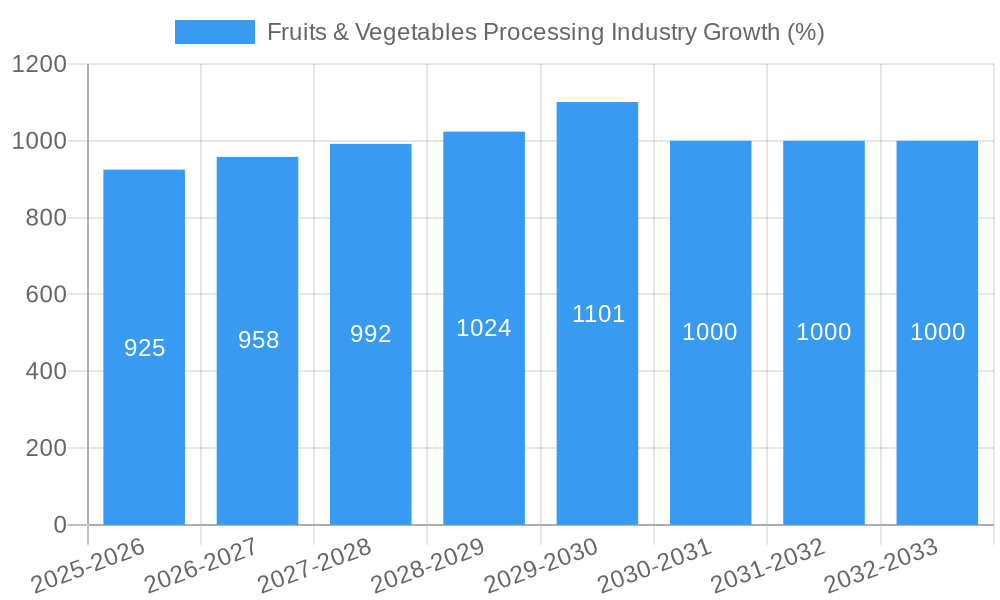
The global fruits and vegetables processing industry is a dynamic sector experiencing steady growth, projected to maintain a Compound Annual Growth Rate (CAGR) of 3.70% from 2025 to 2033. This expansion is driven by several key factors. Increasing consumer demand for convenient, ready-to-eat options fuels the popularity of fresh-cut, canned, frozen, and dried fruits and vegetables. Health-conscious consumers are actively seeking nutritious and minimally processed food choices, boosting the demand for processed fruits and vegetables that retain their nutritional value. Furthermore, the industry benefits from technological advancements in processing equipment, leading to increased efficiency, reduced waste, and improved product quality. The growth is also supported by the expanding food service sector, particularly restaurants and food retailers who rely on processed fruits and vegetables to streamline operations and ensure consistent product availability. However, challenges persist, including supply chain disruptions, fluctuating raw material prices, and stringent regulatory requirements regarding food safety and labeling.
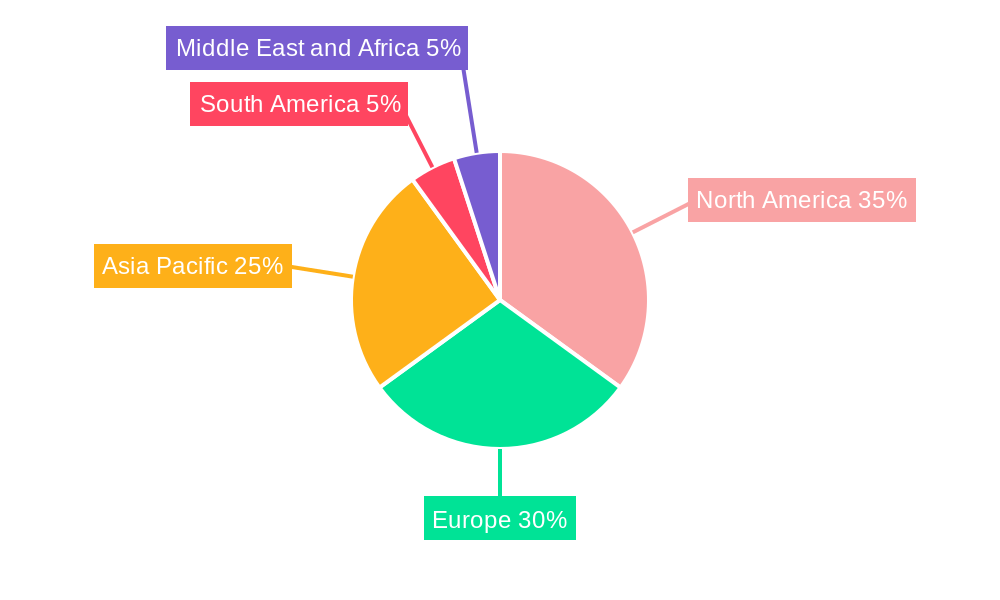
Geographical distribution of the market reveals significant regional variations. North America and Europe currently hold the largest market shares, benefiting from established infrastructure, high consumer spending, and advanced processing technologies. However, the Asia-Pacific region is expected to witness the most rapid growth in the coming years, driven by rising disposable incomes, changing dietary habits, and a burgeoning middle class with increased demand for processed convenience foods. This presents considerable opportunities for both established and emerging players to expand their market presence. The industry is highly fragmented, with numerous players ranging from large multinational corporations to smaller regional processors. Competition is fierce, necessitating ongoing innovation, investment in advanced technologies, and strategic partnerships to maintain a competitive edge. Product diversification, targeting niche markets, and sustainable practices will be crucial for future success in this expanding global market.
Fruits & Vegetables Processing Industry: A Comprehensive Market Report (2019-2033)
This comprehensive report provides a detailed analysis of the Fruits & Vegetables Processing Industry, offering invaluable insights for stakeholders seeking to navigate this dynamic market. With a study period spanning 2019-2033, a base year of 2025, and a forecast period of 2025-2033, this report leverages historical data (2019-2024) to project future trends and opportunities. The market size is estimated at xx Million in 2025 and is projected to reach xx Million by 2033. The report delves into key segments, competitive dynamics, and growth drivers, providing actionable intelligence for informed decision-making.
Fruits & Vegetables Processing Industry Market Structure & Competitive Dynamics
The Fruits & Vegetables Processing Industry exhibits a moderately consolidated market structure, with several multinational corporations and regional players competing for market share. Key players include B&G Foods, SVZ International, Nestle, Albertsons Companies Inc, Archer Daniels Midland Company, OLAM International, Conagra Foods, Agrana, and Kraft Heinz Company. The industry's competitive landscape is shaped by factors such as product innovation, brand recognition, distribution networks, and cost efficiencies. Mergers and acquisitions (M&A) activities have played a significant role in shaping market concentration, with deal values reaching xx Million in recent years. The regulatory framework, encompassing food safety regulations and labeling requirements, significantly influences industry practices. Furthermore, the increasing preference for convenient and processed foods drives demand, while substitutes, such as fresh produce, pose competitive challenges. Market share is dynamic, with leading players continually striving to enhance their position through innovation, strategic partnerships, and expansion into new markets.
- Market Concentration: Moderately Consolidated
- Innovation Ecosystems: Active, driven by technological advancements in processing and preservation.
- Regulatory Frameworks: Stringent food safety and labeling regulations.
- M&A Activities: Significant, with deal values exceeding xx Million annually.
- End-User Trends: Growing preference for convenient and processed food products.
Fruits & Vegetables Processing Industry Industry Trends & Insights
The Fruits & Vegetables Processing Industry is experiencing robust growth, driven by several key factors. The rising global population and increasing disposable incomes in developing economies fuel demand for processed fruits and vegetables. Changing consumer lifestyles and a preference for convenience are also major contributors. Technological disruptions, such as advancements in automation, preservation techniques, and packaging, enhance efficiency and product quality, driving industry expansion. The market demonstrates strong resilience despite economic fluctuations, largely attributed to the essential nature of processed food products. The industry's compound annual growth rate (CAGR) is estimated to be xx% during the forecast period. Market penetration varies significantly across regions and product segments, with developed markets exhibiting higher penetration rates. Competitive dynamics remain intense, with companies vying for market share through product differentiation, branding, and efficient supply chains.
Dominant Markets & Segments in Fruits & Vegetables Processing Industry
The Fruits & Vegetables Processing Industry is geographically diverse, with significant variations in market size and growth rates. While precise rankings are data-dependent, North America and Europe have historically dominated the market. However, Asia-Pacific is projected to witness the highest growth rate during the forecast period due to expanding populations and rising demand for processed food.
Key Drivers:
- Economic Policies: Government support for agricultural development and food processing industries.
- Infrastructure: Efficient transportation and logistics networks.
- Consumer Preferences: Growing demand for convenient, healthy, and ready-to-eat options.
Dominant Segments:
- Type: Fruits and Vegetables (nearly equal dominance)
- Product: Canned and Frozen segments hold significant market share due to longer shelf life and convenience. Fresh and Fresh-cut show healthy growth driven by consumer demand for quality and minimal processing. Dried is a steady performer.
- Processing Equipment: High demand for efficient pre-processing, processing, washing, filling, seasoning, and packaging equipment, reflecting the industry's automation push.
Fruits & Vegetables Processing Industry Product Innovations
Recent innovations focus on extending shelf life, enhancing nutritional value, and improving convenience. This includes advancements in high-pressure processing (HPP), modified atmosphere packaging (MAP), and freeze-drying technologies. These innovations cater to evolving consumer preferences for healthier and more convenient food options, creating new market opportunities and enhancing competitive advantages. The development of advanced sorting technologies, such as Sorma Group's HyperVision platform, boosts efficiency and improves product quality.
Report Segmentation & Scope
This report provides a detailed segmentation of the Fruits & Vegetables Processing Industry across various parameters:
- By Type: Fruits and Vegetables, each with further sub-segmentation into specific fruits and vegetables. Growth projections and market sizes are provided for each.
- By Product: Fresh, Fresh-cut, Canned, Frozen, Dried. Each category's market size and competitive dynamics are analyzed.
- By Processing Equipment: Pre-processing, Processing, Washing, Filling, Seasoning, and Packaging equipment. Market sizes and growth prospects are assessed for each category. Competitive dynamics are analyzed based on technological advancements.
Key Drivers of Fruits & Vegetables Processing Industry Growth
Several factors contribute to the growth of the Fruits & Vegetables Processing Industry:
- Technological Advancements: Automation, improved preservation techniques, and efficient packaging solutions boost production and quality.
- Economic Growth: Rising disposable incomes and urbanization in developing economies fuel demand.
- Favorable Government Policies: Support for the agricultural sector and food processing industries.
Challenges in the Fruits & Vegetables Processing Industry Sector
The Fruits & Vegetables Processing Industry faces several challenges:
- Supply Chain Disruptions: Vulnerability to climate change, price fluctuations, and logistical hurdles.
- Stringent Regulations: Compliance with food safety and labeling regulations requires significant investment.
- Intense Competition: Pressure to offer innovative products and efficient operations.
Leading Players in the Fruits & Vegetables Processing Industry Market
- B&G Foods
- SVZ International
- Nestle
- Albertsons Companies Inc
- Archer Daniels Midland Company
- OLAM International
- Conagra Foods
- Agrana
- Kraft Heinz Company
Key Developments in Fruits & Vegetables Processing Industry Sector
- September 2021: Kraft Heinz acquired Hemmer, expanding its presence in Brazil.
- March 2021: Agrana acquired Taiyo Kagaku's fruit preparations business, strengthening its Asian presence.
- January 2021: Sorma Group launched the HyperVision platform, enhancing fruit sorting technology.
Strategic Fruits & Vegetables Processing Industry Market Outlook
The Fruits & Vegetables Processing Industry is poised for continued growth, driven by technological innovation, evolving consumer preferences, and expansion into emerging markets. Strategic opportunities exist in developing sustainable and innovative products, optimizing supply chains, and leveraging technological advancements to enhance efficiency and reduce costs. Focusing on health-conscious consumers and sustainable practices will be crucial for success in the coming years.
Fruits & Vegetables Processing Industry Segmentation
-
1. Type
- 1.1. Fruits
- 1.2. Vegetables
-
2. Product
- 2.1. Fresh
- 2.2. Fresh-cut
- 2.3. Canned
- 2.4. Frozen
- 2.5. Dried
-
3. Processing Equipment
- 3.1. Pre-processing
- 3.2. Washing
- 3.3. Filling
- 3.4. Seasoning
- 3.5. Packaging
Fruits & Vegetables Processing Industry Segmentation By Geography
-
1. North America
- 1.1. United States
- 1.2. Canada
- 1.3. Mexico
- 1.4. Rest of North America
-
2. Europe
- 2.1. Spain
- 2.2. United Kingdom
- 2.3. Germany
- 2.4. France
- 2.5. Italy
- 2.6. Russia
- 2.7. Rest of Europe
-
3. Asia Pacific
- 3.1. China
- 3.2. Japan
- 3.3. India
- 3.4. Australia
- 3.5. Rest of Asia Pacific
-
4. South America
- 4.1. Brazil
- 4.2. Argentina
- 4.3. Rest of South America
-
5. Middle East and Africa
- 5.1. South Africa
- 5.2. United Arab Emirates
- 5.3. Rest of Middle East and Africa
Fruits & Vegetables Processing Industry REPORT HIGHLIGHTS
| Aspects | Details |
|---|---|
| Study Period | 2019-2033 |
| Base Year | 2024 |
| Estimated Year | 2025 |
| Forecast Period | 2025-2033 |
| Historical Period | 2019-2024 |
| Growth Rate | CAGR of 3.70% from 2019-2033 |
| Segmentation |
|
Table of Contents
- 1. Introduction
- 1.1. Research Scope
- 1.2. Market Segmentation
- 1.3. Research Methodology
- 1.4. Definitions and Assumptions
- 2. Executive Summary
- 2.1. Introduction
- 3. Market Dynamics
- 3.1. Introduction
- 3.2. Market Drivers
- 3.2.1. Increasing Focus on Maintaining Health and Well-Being; Launching Supplements For Specific Purposes and Targeted Population
- 3.3. Market Restrains
- 3.3.1. Supplement Consumption and Their Side-effects; Inclination Towards Substitute Products
- 3.4. Market Trends
- 3.4.1. Adoption of Energy-efficient Food Processing Equipment
- 4. Market Factor Analysis
- 4.1. Porters Five Forces
- 4.2. Supply/Value Chain
- 4.3. PESTEL analysis
- 4.4. Market Entropy
- 4.5. Patent/Trademark Analysis
- 5. Global Fruits & Vegetables Processing Industry Analysis, Insights and Forecast, 2019-2031
- 5.1. Market Analysis, Insights and Forecast - by Type
- 5.1.1. Fruits
- 5.1.2. Vegetables
- 5.2. Market Analysis, Insights and Forecast - by Product
- 5.2.1. Fresh
- 5.2.2. Fresh-cut
- 5.2.3. Canned
- 5.2.4. Frozen
- 5.2.5. Dried
- 5.3. Market Analysis, Insights and Forecast - by Processing Equipment
- 5.3.1. Pre-processing
- 5.3.2. Washing
- 5.3.3. Filling
- 5.3.4. Seasoning
- 5.3.5. Packaging
- 5.4. Market Analysis, Insights and Forecast - by Region
- 5.4.1. North America
- 5.4.2. Europe
- 5.4.3. Asia Pacific
- 5.4.4. South America
- 5.4.5. Middle East and Africa
- 5.1. Market Analysis, Insights and Forecast - by Type
- 6. North America Fruits & Vegetables Processing Industry Analysis, Insights and Forecast, 2019-2031
- 6.1. Market Analysis, Insights and Forecast - by Type
- 6.1.1. Fruits
- 6.1.2. Vegetables
- 6.2. Market Analysis, Insights and Forecast - by Product
- 6.2.1. Fresh
- 6.2.2. Fresh-cut
- 6.2.3. Canned
- 6.2.4. Frozen
- 6.2.5. Dried
- 6.3. Market Analysis, Insights and Forecast - by Processing Equipment
- 6.3.1. Pre-processing
- 6.3.2. Washing
- 6.3.3. Filling
- 6.3.4. Seasoning
- 6.3.5. Packaging
- 6.1. Market Analysis, Insights and Forecast - by Type
- 7. Europe Fruits & Vegetables Processing Industry Analysis, Insights and Forecast, 2019-2031
- 7.1. Market Analysis, Insights and Forecast - by Type
- 7.1.1. Fruits
- 7.1.2. Vegetables
- 7.2. Market Analysis, Insights and Forecast - by Product
- 7.2.1. Fresh
- 7.2.2. Fresh-cut
- 7.2.3. Canned
- 7.2.4. Frozen
- 7.2.5. Dried
- 7.3. Market Analysis, Insights and Forecast - by Processing Equipment
- 7.3.1. Pre-processing
- 7.3.2. Washing
- 7.3.3. Filling
- 7.3.4. Seasoning
- 7.3.5. Packaging
- 7.1. Market Analysis, Insights and Forecast - by Type
- 8. Asia Pacific Fruits & Vegetables Processing Industry Analysis, Insights and Forecast, 2019-2031
- 8.1. Market Analysis, Insights and Forecast - by Type
- 8.1.1. Fruits
- 8.1.2. Vegetables
- 8.2. Market Analysis, Insights and Forecast - by Product
- 8.2.1. Fresh
- 8.2.2. Fresh-cut
- 8.2.3. Canned
- 8.2.4. Frozen
- 8.2.5. Dried
- 8.3. Market Analysis, Insights and Forecast - by Processing Equipment
- 8.3.1. Pre-processing
- 8.3.2. Washing
- 8.3.3. Filling
- 8.3.4. Seasoning
- 8.3.5. Packaging
- 8.1. Market Analysis, Insights and Forecast - by Type
- 9. South America Fruits & Vegetables Processing Industry Analysis, Insights and Forecast, 2019-2031
- 9.1. Market Analysis, Insights and Forecast - by Type
- 9.1.1. Fruits
- 9.1.2. Vegetables
- 9.2. Market Analysis, Insights and Forecast - by Product
- 9.2.1. Fresh
- 9.2.2. Fresh-cut
- 9.2.3. Canned
- 9.2.4. Frozen
- 9.2.5. Dried
- 9.3. Market Analysis, Insights and Forecast - by Processing Equipment
- 9.3.1. Pre-processing
- 9.3.2. Washing
- 9.3.3. Filling
- 9.3.4. Seasoning
- 9.3.5. Packaging
- 9.1. Market Analysis, Insights and Forecast - by Type
- 10. Middle East and Africa Fruits & Vegetables Processing Industry Analysis, Insights and Forecast, 2019-2031
- 10.1. Market Analysis, Insights and Forecast - by Type
- 10.1.1. Fruits
- 10.1.2. Vegetables
- 10.2. Market Analysis, Insights and Forecast - by Product
- 10.2.1. Fresh
- 10.2.2. Fresh-cut
- 10.2.3. Canned
- 10.2.4. Frozen
- 10.2.5. Dried
- 10.3. Market Analysis, Insights and Forecast - by Processing Equipment
- 10.3.1. Pre-processing
- 10.3.2. Washing
- 10.3.3. Filling
- 10.3.4. Seasoning
- 10.3.5. Packaging
- 10.1. Market Analysis, Insights and Forecast - by Type
- 11. North America Fruits & Vegetables Processing Industry Analysis, Insights and Forecast, 2019-2031
- 11.1. Market Analysis, Insights and Forecast - By Country/Sub-region
- 11.1.1 United States
- 11.1.2 Canada
- 11.1.3 Mexico
- 11.1.4 Rest of North America
- 12. Europe Fruits & Vegetables Processing Industry Analysis, Insights and Forecast, 2019-2031
- 12.1. Market Analysis, Insights and Forecast - By Country/Sub-region
- 12.1.1 Spain
- 12.1.2 United Kingdom
- 12.1.3 Germany
- 12.1.4 France
- 12.1.5 Italy
- 12.1.6 Russia
- 12.1.7 Rest of Europe
- 13. Asia Pacific Fruits & Vegetables Processing Industry Analysis, Insights and Forecast, 2019-2031
- 13.1. Market Analysis, Insights and Forecast - By Country/Sub-region
- 13.1.1 China
- 13.1.2 Japan
- 13.1.3 India
- 13.1.4 Australia
- 13.1.5 Rest of Asia Pacific
- 14. South America Fruits & Vegetables Processing Industry Analysis, Insights and Forecast, 2019-2031
- 14.1. Market Analysis, Insights and Forecast - By Country/Sub-region
- 14.1.1 Brazil
- 14.1.2 Argentina
- 14.1.3 Rest of South America
- 15. Middle East and Africa Fruits & Vegetables Processing Industry Analysis, Insights and Forecast, 2019-2031
- 15.1. Market Analysis, Insights and Forecast - By Country/Sub-region
- 15.1.1 South Africa
- 15.1.2 United Arab Emirates
- 15.1.3 Rest of Middle East and Africa
- 16. Competitive Analysis
- 16.1. Global Market Share Analysis 2024
- 16.2. Company Profiles
- 16.2.1 B&G Foods
- 16.2.1.1. Overview
- 16.2.1.2. Products
- 16.2.1.3. SWOT Analysis
- 16.2.1.4. Recent Developments
- 16.2.1.5. Financials (Based on Availability)
- 16.2.2 SVZ International
- 16.2.2.1. Overview
- 16.2.2.2. Products
- 16.2.2.3. SWOT Analysis
- 16.2.2.4. Recent Developments
- 16.2.2.5. Financials (Based on Availability)
- 16.2.3 Nestle
- 16.2.3.1. Overview
- 16.2.3.2. Products
- 16.2.3.3. SWOT Analysis
- 16.2.3.4. Recent Developments
- 16.2.3.5. Financials (Based on Availability)
- 16.2.4 Albertsons Companies Inc
- 16.2.4.1. Overview
- 16.2.4.2. Products
- 16.2.4.3. SWOT Analysis
- 16.2.4.4. Recent Developments
- 16.2.4.5. Financials (Based on Availability)
- 16.2.5 Archer Daniels Midland Company
- 16.2.5.1. Overview
- 16.2.5.2. Products
- 16.2.5.3. SWOT Analysis
- 16.2.5.4. Recent Developments
- 16.2.5.5. Financials (Based on Availability)
- 16.2.6 OLAM International*List Not Exhaustive
- 16.2.6.1. Overview
- 16.2.6.2. Products
- 16.2.6.3. SWOT Analysis
- 16.2.6.4. Recent Developments
- 16.2.6.5. Financials (Based on Availability)
- 16.2.7 Conagra Foods
- 16.2.7.1. Overview
- 16.2.7.2. Products
- 16.2.7.3. SWOT Analysis
- 16.2.7.4. Recent Developments
- 16.2.7.5. Financials (Based on Availability)
- 16.2.8 Agrana
- 16.2.8.1. Overview
- 16.2.8.2. Products
- 16.2.8.3. SWOT Analysis
- 16.2.8.4. Recent Developments
- 16.2.8.5. Financials (Based on Availability)
- 16.2.9 Kraft Heinz Company
- 16.2.9.1. Overview
- 16.2.9.2. Products
- 16.2.9.3. SWOT Analysis
- 16.2.9.4. Recent Developments
- 16.2.9.5. Financials (Based on Availability)
- 16.2.1 B&G Foods
List of Figures
- Figure 1: Global Fruits & Vegetables Processing Industry Revenue Breakdown (Million, %) by Region 2024 & 2032
- Figure 2: Global Fruits & Vegetables Processing Industry Volume Breakdown (K Units, %) by Region 2024 & 2032
- Figure 3: North America Fruits & Vegetables Processing Industry Revenue (Million), by Country 2024 & 2032
- Figure 4: North America Fruits & Vegetables Processing Industry Volume (K Units), by Country 2024 & 2032
- Figure 5: North America Fruits & Vegetables Processing Industry Revenue Share (%), by Country 2024 & 2032
- Figure 6: North America Fruits & Vegetables Processing Industry Volume Share (%), by Country 2024 & 2032
- Figure 7: Europe Fruits & Vegetables Processing Industry Revenue (Million), by Country 2024 & 2032
- Figure 8: Europe Fruits & Vegetables Processing Industry Volume (K Units), by Country 2024 & 2032
- Figure 9: Europe Fruits & Vegetables Processing Industry Revenue Share (%), by Country 2024 & 2032
- Figure 10: Europe Fruits & Vegetables Processing Industry Volume Share (%), by Country 2024 & 2032
- Figure 11: Asia Pacific Fruits & Vegetables Processing Industry Revenue (Million), by Country 2024 & 2032
- Figure 12: Asia Pacific Fruits & Vegetables Processing Industry Volume (K Units), by Country 2024 & 2032
- Figure 13: Asia Pacific Fruits & Vegetables Processing Industry Revenue Share (%), by Country 2024 & 2032
- Figure 14: Asia Pacific Fruits & Vegetables Processing Industry Volume Share (%), by Country 2024 & 2032
- Figure 15: South America Fruits & Vegetables Processing Industry Revenue (Million), by Country 2024 & 2032
- Figure 16: South America Fruits & Vegetables Processing Industry Volume (K Units), by Country 2024 & 2032
- Figure 17: South America Fruits & Vegetables Processing Industry Revenue Share (%), by Country 2024 & 2032
- Figure 18: South America Fruits & Vegetables Processing Industry Volume Share (%), by Country 2024 & 2032
- Figure 19: Middle East and Africa Fruits & Vegetables Processing Industry Revenue (Million), by Country 2024 & 2032
- Figure 20: Middle East and Africa Fruits & Vegetables Processing Industry Volume (K Units), by Country 2024 & 2032
- Figure 21: Middle East and Africa Fruits & Vegetables Processing Industry Revenue Share (%), by Country 2024 & 2032
- Figure 22: Middle East and Africa Fruits & Vegetables Processing Industry Volume Share (%), by Country 2024 & 2032
- Figure 23: North America Fruits & Vegetables Processing Industry Revenue (Million), by Type 2024 & 2032
- Figure 24: North America Fruits & Vegetables Processing Industry Volume (K Units), by Type 2024 & 2032
- Figure 25: North America Fruits & Vegetables Processing Industry Revenue Share (%), by Type 2024 & 2032
- Figure 26: North America Fruits & Vegetables Processing Industry Volume Share (%), by Type 2024 & 2032
- Figure 27: North America Fruits & Vegetables Processing Industry Revenue (Million), by Product 2024 & 2032
- Figure 28: North America Fruits & Vegetables Processing Industry Volume (K Units), by Product 2024 & 2032
- Figure 29: North America Fruits & Vegetables Processing Industry Revenue Share (%), by Product 2024 & 2032
- Figure 30: North America Fruits & Vegetables Processing Industry Volume Share (%), by Product 2024 & 2032
- Figure 31: North America Fruits & Vegetables Processing Industry Revenue (Million), by Processing Equipment 2024 & 2032
- Figure 32: North America Fruits & Vegetables Processing Industry Volume (K Units), by Processing Equipment 2024 & 2032
- Figure 33: North America Fruits & Vegetables Processing Industry Revenue Share (%), by Processing Equipment 2024 & 2032
- Figure 34: North America Fruits & Vegetables Processing Industry Volume Share (%), by Processing Equipment 2024 & 2032
- Figure 35: North America Fruits & Vegetables Processing Industry Revenue (Million), by Country 2024 & 2032
- Figure 36: North America Fruits & Vegetables Processing Industry Volume (K Units), by Country 2024 & 2032
- Figure 37: North America Fruits & Vegetables Processing Industry Revenue Share (%), by Country 2024 & 2032
- Figure 38: North America Fruits & Vegetables Processing Industry Volume Share (%), by Country 2024 & 2032
- Figure 39: Europe Fruits & Vegetables Processing Industry Revenue (Million), by Type 2024 & 2032
- Figure 40: Europe Fruits & Vegetables Processing Industry Volume (K Units), by Type 2024 & 2032
- Figure 41: Europe Fruits & Vegetables Processing Industry Revenue Share (%), by Type 2024 & 2032
- Figure 42: Europe Fruits & Vegetables Processing Industry Volume Share (%), by Type 2024 & 2032
- Figure 43: Europe Fruits & Vegetables Processing Industry Revenue (Million), by Product 2024 & 2032
- Figure 44: Europe Fruits & Vegetables Processing Industry Volume (K Units), by Product 2024 & 2032
- Figure 45: Europe Fruits & Vegetables Processing Industry Revenue Share (%), by Product 2024 & 2032
- Figure 46: Europe Fruits & Vegetables Processing Industry Volume Share (%), by Product 2024 & 2032
- Figure 47: Europe Fruits & Vegetables Processing Industry Revenue (Million), by Processing Equipment 2024 & 2032
- Figure 48: Europe Fruits & Vegetables Processing Industry Volume (K Units), by Processing Equipment 2024 & 2032
- Figure 49: Europe Fruits & Vegetables Processing Industry Revenue Share (%), by Processing Equipment 2024 & 2032
- Figure 50: Europe Fruits & Vegetables Processing Industry Volume Share (%), by Processing Equipment 2024 & 2032
- Figure 51: Europe Fruits & Vegetables Processing Industry Revenue (Million), by Country 2024 & 2032
- Figure 52: Europe Fruits & Vegetables Processing Industry Volume (K Units), by Country 2024 & 2032
- Figure 53: Europe Fruits & Vegetables Processing Industry Revenue Share (%), by Country 2024 & 2032
- Figure 54: Europe Fruits & Vegetables Processing Industry Volume Share (%), by Country 2024 & 2032
- Figure 55: Asia Pacific Fruits & Vegetables Processing Industry Revenue (Million), by Type 2024 & 2032
- Figure 56: Asia Pacific Fruits & Vegetables Processing Industry Volume (K Units), by Type 2024 & 2032
- Figure 57: Asia Pacific Fruits & Vegetables Processing Industry Revenue Share (%), by Type 2024 & 2032
- Figure 58: Asia Pacific Fruits & Vegetables Processing Industry Volume Share (%), by Type 2024 & 2032
- Figure 59: Asia Pacific Fruits & Vegetables Processing Industry Revenue (Million), by Product 2024 & 2032
- Figure 60: Asia Pacific Fruits & Vegetables Processing Industry Volume (K Units), by Product 2024 & 2032
- Figure 61: Asia Pacific Fruits & Vegetables Processing Industry Revenue Share (%), by Product 2024 & 2032
- Figure 62: Asia Pacific Fruits & Vegetables Processing Industry Volume Share (%), by Product 2024 & 2032
- Figure 63: Asia Pacific Fruits & Vegetables Processing Industry Revenue (Million), by Processing Equipment 2024 & 2032
- Figure 64: Asia Pacific Fruits & Vegetables Processing Industry Volume (K Units), by Processing Equipment 2024 & 2032
- Figure 65: Asia Pacific Fruits & Vegetables Processing Industry Revenue Share (%), by Processing Equipment 2024 & 2032
- Figure 66: Asia Pacific Fruits & Vegetables Processing Industry Volume Share (%), by Processing Equipment 2024 & 2032
- Figure 67: Asia Pacific Fruits & Vegetables Processing Industry Revenue (Million), by Country 2024 & 2032
- Figure 68: Asia Pacific Fruits & Vegetables Processing Industry Volume (K Units), by Country 2024 & 2032
- Figure 69: Asia Pacific Fruits & Vegetables Processing Industry Revenue Share (%), by Country 2024 & 2032
- Figure 70: Asia Pacific Fruits & Vegetables Processing Industry Volume Share (%), by Country 2024 & 2032
- Figure 71: South America Fruits & Vegetables Processing Industry Revenue (Million), by Type 2024 & 2032
- Figure 72: South America Fruits & Vegetables Processing Industry Volume (K Units), by Type 2024 & 2032
- Figure 73: South America Fruits & Vegetables Processing Industry Revenue Share (%), by Type 2024 & 2032
- Figure 74: South America Fruits & Vegetables Processing Industry Volume Share (%), by Type 2024 & 2032
- Figure 75: South America Fruits & Vegetables Processing Industry Revenue (Million), by Product 2024 & 2032
- Figure 76: South America Fruits & Vegetables Processing Industry Volume (K Units), by Product 2024 & 2032
- Figure 77: South America Fruits & Vegetables Processing Industry Revenue Share (%), by Product 2024 & 2032
- Figure 78: South America Fruits & Vegetables Processing Industry Volume Share (%), by Product 2024 & 2032
- Figure 79: South America Fruits & Vegetables Processing Industry Revenue (Million), by Processing Equipment 2024 & 2032
- Figure 80: South America Fruits & Vegetables Processing Industry Volume (K Units), by Processing Equipment 2024 & 2032
- Figure 81: South America Fruits & Vegetables Processing Industry Revenue Share (%), by Processing Equipment 2024 & 2032
- Figure 82: South America Fruits & Vegetables Processing Industry Volume Share (%), by Processing Equipment 2024 & 2032
- Figure 83: South America Fruits & Vegetables Processing Industry Revenue (Million), by Country 2024 & 2032
- Figure 84: South America Fruits & Vegetables Processing Industry Volume (K Units), by Country 2024 & 2032
- Figure 85: South America Fruits & Vegetables Processing Industry Revenue Share (%), by Country 2024 & 2032
- Figure 86: South America Fruits & Vegetables Processing Industry Volume Share (%), by Country 2024 & 2032
- Figure 87: Middle East and Africa Fruits & Vegetables Processing Industry Revenue (Million), by Type 2024 & 2032
- Figure 88: Middle East and Africa Fruits & Vegetables Processing Industry Volume (K Units), by Type 2024 & 2032
- Figure 89: Middle East and Africa Fruits & Vegetables Processing Industry Revenue Share (%), by Type 2024 & 2032
- Figure 90: Middle East and Africa Fruits & Vegetables Processing Industry Volume Share (%), by Type 2024 & 2032
- Figure 91: Middle East and Africa Fruits & Vegetables Processing Industry Revenue (Million), by Product 2024 & 2032
- Figure 92: Middle East and Africa Fruits & Vegetables Processing Industry Volume (K Units), by Product 2024 & 2032
- Figure 93: Middle East and Africa Fruits & Vegetables Processing Industry Revenue Share (%), by Product 2024 & 2032
- Figure 94: Middle East and Africa Fruits & Vegetables Processing Industry Volume Share (%), by Product 2024 & 2032
- Figure 95: Middle East and Africa Fruits & Vegetables Processing Industry Revenue (Million), by Processing Equipment 2024 & 2032
- Figure 96: Middle East and Africa Fruits & Vegetables Processing Industry Volume (K Units), by Processing Equipment 2024 & 2032
- Figure 97: Middle East and Africa Fruits & Vegetables Processing Industry Revenue Share (%), by Processing Equipment 2024 & 2032
- Figure 98: Middle East and Africa Fruits & Vegetables Processing Industry Volume Share (%), by Processing Equipment 2024 & 2032
- Figure 99: Middle East and Africa Fruits & Vegetables Processing Industry Revenue (Million), by Country 2024 & 2032
- Figure 100: Middle East and Africa Fruits & Vegetables Processing Industry Volume (K Units), by Country 2024 & 2032
- Figure 101: Middle East and Africa Fruits & Vegetables Processing Industry Revenue Share (%), by Country 2024 & 2032
- Figure 102: Middle East and Africa Fruits & Vegetables Processing Industry Volume Share (%), by Country 2024 & 2032
List of Tables
- Table 1: Global Fruits & Vegetables Processing Industry Revenue Million Forecast, by Region 2019 & 2032
- Table 2: Global Fruits & Vegetables Processing Industry Volume K Units Forecast, by Region 2019 & 2032
- Table 3: Global Fruits & Vegetables Processing Industry Revenue Million Forecast, by Type 2019 & 2032
- Table 4: Global Fruits & Vegetables Processing Industry Volume K Units Forecast, by Type 2019 & 2032
- Table 5: Global Fruits & Vegetables Processing Industry Revenue Million Forecast, by Product 2019 & 2032
- Table 6: Global Fruits & Vegetables Processing Industry Volume K Units Forecast, by Product 2019 & 2032
- Table 7: Global Fruits & Vegetables Processing Industry Revenue Million Forecast, by Processing Equipment 2019 & 2032
- Table 8: Global Fruits & Vegetables Processing Industry Volume K Units Forecast, by Processing Equipment 2019 & 2032
- Table 9: Global Fruits & Vegetables Processing Industry Revenue Million Forecast, by Region 2019 & 2032
- Table 10: Global Fruits & Vegetables Processing Industry Volume K Units Forecast, by Region 2019 & 2032
- Table 11: Global Fruits & Vegetables Processing Industry Revenue Million Forecast, by Country 2019 & 2032
- Table 12: Global Fruits & Vegetables Processing Industry Volume K Units Forecast, by Country 2019 & 2032
- Table 13: United States Fruits & Vegetables Processing Industry Revenue (Million) Forecast, by Application 2019 & 2032
- Table 14: United States Fruits & Vegetables Processing Industry Volume (K Units) Forecast, by Application 2019 & 2032
- Table 15: Canada Fruits & Vegetables Processing Industry Revenue (Million) Forecast, by Application 2019 & 2032
- Table 16: Canada Fruits & Vegetables Processing Industry Volume (K Units) Forecast, by Application 2019 & 2032
- Table 17: Mexico Fruits & Vegetables Processing Industry Revenue (Million) Forecast, by Application 2019 & 2032
- Table 18: Mexico Fruits & Vegetables Processing Industry Volume (K Units) Forecast, by Application 2019 & 2032
- Table 19: Rest of North America Fruits & Vegetables Processing Industry Revenue (Million) Forecast, by Application 2019 & 2032
- Table 20: Rest of North America Fruits & Vegetables Processing Industry Volume (K Units) Forecast, by Application 2019 & 2032
- Table 21: Global Fruits & Vegetables Processing Industry Revenue Million Forecast, by Country 2019 & 2032
- Table 22: Global Fruits & Vegetables Processing Industry Volume K Units Forecast, by Country 2019 & 2032
- Table 23: Spain Fruits & Vegetables Processing Industry Revenue (Million) Forecast, by Application 2019 & 2032
- Table 24: Spain Fruits & Vegetables Processing Industry Volume (K Units) Forecast, by Application 2019 & 2032
- Table 25: United Kingdom Fruits & Vegetables Processing Industry Revenue (Million) Forecast, by Application 2019 & 2032
- Table 26: United Kingdom Fruits & Vegetables Processing Industry Volume (K Units) Forecast, by Application 2019 & 2032
- Table 27: Germany Fruits & Vegetables Processing Industry Revenue (Million) Forecast, by Application 2019 & 2032
- Table 28: Germany Fruits & Vegetables Processing Industry Volume (K Units) Forecast, by Application 2019 & 2032
- Table 29: France Fruits & Vegetables Processing Industry Revenue (Million) Forecast, by Application 2019 & 2032
- Table 30: France Fruits & Vegetables Processing Industry Volume (K Units) Forecast, by Application 2019 & 2032
- Table 31: Italy Fruits & Vegetables Processing Industry Revenue (Million) Forecast, by Application 2019 & 2032
- Table 32: Italy Fruits & Vegetables Processing Industry Volume (K Units) Forecast, by Application 2019 & 2032
- Table 33: Russia Fruits & Vegetables Processing Industry Revenue (Million) Forecast, by Application 2019 & 2032
- Table 34: Russia Fruits & Vegetables Processing Industry Volume (K Units) Forecast, by Application 2019 & 2032
- Table 35: Rest of Europe Fruits & Vegetables Processing Industry Revenue (Million) Forecast, by Application 2019 & 2032
- Table 36: Rest of Europe Fruits & Vegetables Processing Industry Volume (K Units) Forecast, by Application 2019 & 2032
- Table 37: Global Fruits & Vegetables Processing Industry Revenue Million Forecast, by Country 2019 & 2032
- Table 38: Global Fruits & Vegetables Processing Industry Volume K Units Forecast, by Country 2019 & 2032
- Table 39: China Fruits & Vegetables Processing Industry Revenue (Million) Forecast, by Application 2019 & 2032
- Table 40: China Fruits & Vegetables Processing Industry Volume (K Units) Forecast, by Application 2019 & 2032
- Table 41: Japan Fruits & Vegetables Processing Industry Revenue (Million) Forecast, by Application 2019 & 2032
- Table 42: Japan Fruits & Vegetables Processing Industry Volume (K Units) Forecast, by Application 2019 & 2032
- Table 43: India Fruits & Vegetables Processing Industry Revenue (Million) Forecast, by Application 2019 & 2032
- Table 44: India Fruits & Vegetables Processing Industry Volume (K Units) Forecast, by Application 2019 & 2032
- Table 45: Australia Fruits & Vegetables Processing Industry Revenue (Million) Forecast, by Application 2019 & 2032
- Table 46: Australia Fruits & Vegetables Processing Industry Volume (K Units) Forecast, by Application 2019 & 2032
- Table 47: Rest of Asia Pacific Fruits & Vegetables Processing Industry Revenue (Million) Forecast, by Application 2019 & 2032
- Table 48: Rest of Asia Pacific Fruits & Vegetables Processing Industry Volume (K Units) Forecast, by Application 2019 & 2032
- Table 49: Global Fruits & Vegetables Processing Industry Revenue Million Forecast, by Country 2019 & 2032
- Table 50: Global Fruits & Vegetables Processing Industry Volume K Units Forecast, by Country 2019 & 2032
- Table 51: Brazil Fruits & Vegetables Processing Industry Revenue (Million) Forecast, by Application 2019 & 2032
- Table 52: Brazil Fruits & Vegetables Processing Industry Volume (K Units) Forecast, by Application 2019 & 2032
- Table 53: Argentina Fruits & Vegetables Processing Industry Revenue (Million) Forecast, by Application 2019 & 2032
- Table 54: Argentina Fruits & Vegetables Processing Industry Volume (K Units) Forecast, by Application 2019 & 2032
- Table 55: Rest of South America Fruits & Vegetables Processing Industry Revenue (Million) Forecast, by Application 2019 & 2032
- Table 56: Rest of South America Fruits & Vegetables Processing Industry Volume (K Units) Forecast, by Application 2019 & 2032
- Table 57: Global Fruits & Vegetables Processing Industry Revenue Million Forecast, by Country 2019 & 2032
- Table 58: Global Fruits & Vegetables Processing Industry Volume K Units Forecast, by Country 2019 & 2032
- Table 59: South Africa Fruits & Vegetables Processing Industry Revenue (Million) Forecast, by Application 2019 & 2032
- Table 60: South Africa Fruits & Vegetables Processing Industry Volume (K Units) Forecast, by Application 2019 & 2032
- Table 61: United Arab Emirates Fruits & Vegetables Processing Industry Revenue (Million) Forecast, by Application 2019 & 2032
- Table 62: United Arab Emirates Fruits & Vegetables Processing Industry Volume (K Units) Forecast, by Application 2019 & 2032
- Table 63: Rest of Middle East and Africa Fruits & Vegetables Processing Industry Revenue (Million) Forecast, by Application 2019 & 2032
- Table 64: Rest of Middle East and Africa Fruits & Vegetables Processing Industry Volume (K Units) Forecast, by Application 2019 & 2032
- Table 65: Global Fruits & Vegetables Processing Industry Revenue Million Forecast, by Type 2019 & 2032
- Table 66: Global Fruits & Vegetables Processing Industry Volume K Units Forecast, by Type 2019 & 2032
- Table 67: Global Fruits & Vegetables Processing Industry Revenue Million Forecast, by Product 2019 & 2032
- Table 68: Global Fruits & Vegetables Processing Industry Volume K Units Forecast, by Product 2019 & 2032
- Table 69: Global Fruits & Vegetables Processing Industry Revenue Million Forecast, by Processing Equipment 2019 & 2032
- Table 70: Global Fruits & Vegetables Processing Industry Volume K Units Forecast, by Processing Equipment 2019 & 2032
- Table 71: Global Fruits & Vegetables Processing Industry Revenue Million Forecast, by Country 2019 & 2032
- Table 72: Global Fruits & Vegetables Processing Industry Volume K Units Forecast, by Country 2019 & 2032
- Table 73: United States Fruits & Vegetables Processing Industry Revenue (Million) Forecast, by Application 2019 & 2032
- Table 74: United States Fruits & Vegetables Processing Industry Volume (K Units) Forecast, by Application 2019 & 2032
- Table 75: Canada Fruits & Vegetables Processing Industry Revenue (Million) Forecast, by Application 2019 & 2032
- Table 76: Canada Fruits & Vegetables Processing Industry Volume (K Units) Forecast, by Application 2019 & 2032
- Table 77: Mexico Fruits & Vegetables Processing Industry Revenue (Million) Forecast, by Application 2019 & 2032
- Table 78: Mexico Fruits & Vegetables Processing Industry Volume (K Units) Forecast, by Application 2019 & 2032
- Table 79: Rest of North America Fruits & Vegetables Processing Industry Revenue (Million) Forecast, by Application 2019 & 2032
- Table 80: Rest of North America Fruits & Vegetables Processing Industry Volume (K Units) Forecast, by Application 2019 & 2032
- Table 81: Global Fruits & Vegetables Processing Industry Revenue Million Forecast, by Type 2019 & 2032
- Table 82: Global Fruits & Vegetables Processing Industry Volume K Units Forecast, by Type 2019 & 2032
- Table 83: Global Fruits & Vegetables Processing Industry Revenue Million Forecast, by Product 2019 & 2032
- Table 84: Global Fruits & Vegetables Processing Industry Volume K Units Forecast, by Product 2019 & 2032
- Table 85: Global Fruits & Vegetables Processing Industry Revenue Million Forecast, by Processing Equipment 2019 & 2032
- Table 86: Global Fruits & Vegetables Processing Industry Volume K Units Forecast, by Processing Equipment 2019 & 2032
- Table 87: Global Fruits & Vegetables Processing Industry Revenue Million Forecast, by Country 2019 & 2032
- Table 88: Global Fruits & Vegetables Processing Industry Volume K Units Forecast, by Country 2019 & 2032
- Table 89: Spain Fruits & Vegetables Processing Industry Revenue (Million) Forecast, by Application 2019 & 2032
- Table 90: Spain Fruits & Vegetables Processing Industry Volume (K Units) Forecast, by Application 2019 & 2032
- Table 91: United Kingdom Fruits & Vegetables Processing Industry Revenue (Million) Forecast, by Application 2019 & 2032
- Table 92: United Kingdom Fruits & Vegetables Processing Industry Volume (K Units) Forecast, by Application 2019 & 2032
- Table 93: Germany Fruits & Vegetables Processing Industry Revenue (Million) Forecast, by Application 2019 & 2032
- Table 94: Germany Fruits & Vegetables Processing Industry Volume (K Units) Forecast, by Application 2019 & 2032
- Table 95: France Fruits & Vegetables Processing Industry Revenue (Million) Forecast, by Application 2019 & 2032
- Table 96: France Fruits & Vegetables Processing Industry Volume (K Units) Forecast, by Application 2019 & 2032
- Table 97: Italy Fruits & Vegetables Processing Industry Revenue (Million) Forecast, by Application 2019 & 2032
- Table 98: Italy Fruits & Vegetables Processing Industry Volume (K Units) Forecast, by Application 2019 & 2032
- Table 99: Russia Fruits & Vegetables Processing Industry Revenue (Million) Forecast, by Application 2019 & 2032
- Table 100: Russia Fruits & Vegetables Processing Industry Volume (K Units) Forecast, by Application 2019 & 2032
- Table 101: Rest of Europe Fruits & Vegetables Processing Industry Revenue (Million) Forecast, by Application 2019 & 2032
- Table 102: Rest of Europe Fruits & Vegetables Processing Industry Volume (K Units) Forecast, by Application 2019 & 2032
- Table 103: Global Fruits & Vegetables Processing Industry Revenue Million Forecast, by Type 2019 & 2032
- Table 104: Global Fruits & Vegetables Processing Industry Volume K Units Forecast, by Type 2019 & 2032
- Table 105: Global Fruits & Vegetables Processing Industry Revenue Million Forecast, by Product 2019 & 2032
- Table 106: Global Fruits & Vegetables Processing Industry Volume K Units Forecast, by Product 2019 & 2032
- Table 107: Global Fruits & Vegetables Processing Industry Revenue Million Forecast, by Processing Equipment 2019 & 2032
- Table 108: Global Fruits & Vegetables Processing Industry Volume K Units Forecast, by Processing Equipment 2019 & 2032
- Table 109: Global Fruits & Vegetables Processing Industry Revenue Million Forecast, by Country 2019 & 2032
- Table 110: Global Fruits & Vegetables Processing Industry Volume K Units Forecast, by Country 2019 & 2032
- Table 111: China Fruits & Vegetables Processing Industry Revenue (Million) Forecast, by Application 2019 & 2032
- Table 112: China Fruits & Vegetables Processing Industry Volume (K Units) Forecast, by Application 2019 & 2032
- Table 113: Japan Fruits & Vegetables Processing Industry Revenue (Million) Forecast, by Application 2019 & 2032
- Table 114: Japan Fruits & Vegetables Processing Industry Volume (K Units) Forecast, by Application 2019 & 2032
- Table 115: India Fruits & Vegetables Processing Industry Revenue (Million) Forecast, by Application 2019 & 2032
- Table 116: India Fruits & Vegetables Processing Industry Volume (K Units) Forecast, by Application 2019 & 2032
- Table 117: Australia Fruits & Vegetables Processing Industry Revenue (Million) Forecast, by Application 2019 & 2032
- Table 118: Australia Fruits & Vegetables Processing Industry Volume (K Units) Forecast, by Application 2019 & 2032
- Table 119: Rest of Asia Pacific Fruits & Vegetables Processing Industry Revenue (Million) Forecast, by Application 2019 & 2032
- Table 120: Rest of Asia Pacific Fruits & Vegetables Processing Industry Volume (K Units) Forecast, by Application 2019 & 2032
- Table 121: Global Fruits & Vegetables Processing Industry Revenue Million Forecast, by Type 2019 & 2032
- Table 122: Global Fruits & Vegetables Processing Industry Volume K Units Forecast, by Type 2019 & 2032
- Table 123: Global Fruits & Vegetables Processing Industry Revenue Million Forecast, by Product 2019 & 2032
- Table 124: Global Fruits & Vegetables Processing Industry Volume K Units Forecast, by Product 2019 & 2032
- Table 125: Global Fruits & Vegetables Processing Industry Revenue Million Forecast, by Processing Equipment 2019 & 2032
- Table 126: Global Fruits & Vegetables Processing Industry Volume K Units Forecast, by Processing Equipment 2019 & 2032
- Table 127: Global Fruits & Vegetables Processing Industry Revenue Million Forecast, by Country 2019 & 2032
- Table 128: Global Fruits & Vegetables Processing Industry Volume K Units Forecast, by Country 2019 & 2032
- Table 129: Brazil Fruits & Vegetables Processing Industry Revenue (Million) Forecast, by Application 2019 & 2032
- Table 130: Brazil Fruits & Vegetables Processing Industry Volume (K Units) Forecast, by Application 2019 & 2032
- Table 131: Argentina Fruits & Vegetables Processing Industry Revenue (Million) Forecast, by Application 2019 & 2032
- Table 132: Argentina Fruits & Vegetables Processing Industry Volume (K Units) Forecast, by Application 2019 & 2032
- Table 133: Rest of South America Fruits & Vegetables Processing Industry Revenue (Million) Forecast, by Application 2019 & 2032
- Table 134: Rest of South America Fruits & Vegetables Processing Industry Volume (K Units) Forecast, by Application 2019 & 2032
- Table 135: Global Fruits & Vegetables Processing Industry Revenue Million Forecast, by Type 2019 & 2032
- Table 136: Global Fruits & Vegetables Processing Industry Volume K Units Forecast, by Type 2019 & 2032
- Table 137: Global Fruits & Vegetables Processing Industry Revenue Million Forecast, by Product 2019 & 2032
- Table 138: Global Fruits & Vegetables Processing Industry Volume K Units Forecast, by Product 2019 & 2032
- Table 139: Global Fruits & Vegetables Processing Industry Revenue Million Forecast, by Processing Equipment 2019 & 2032
- Table 140: Global Fruits & Vegetables Processing Industry Volume K Units Forecast, by Processing Equipment 2019 & 2032
- Table 141: Global Fruits & Vegetables Processing Industry Revenue Million Forecast, by Country 2019 & 2032
- Table 142: Global Fruits & Vegetables Processing Industry Volume K Units Forecast, by Country 2019 & 2032
- Table 143: South Africa Fruits & Vegetables Processing Industry Revenue (Million) Forecast, by Application 2019 & 2032
- Table 144: South Africa Fruits & Vegetables Processing Industry Volume (K Units) Forecast, by Application 2019 & 2032
- Table 145: United Arab Emirates Fruits & Vegetables Processing Industry Revenue (Million) Forecast, by Application 2019 & 2032
- Table 146: United Arab Emirates Fruits & Vegetables Processing Industry Volume (K Units) Forecast, by Application 2019 & 2032
- Table 147: Rest of Middle East and Africa Fruits & Vegetables Processing Industry Revenue (Million) Forecast, by Application 2019 & 2032
- Table 148: Rest of Middle East and Africa Fruits & Vegetables Processing Industry Volume (K Units) Forecast, by Application 2019 & 2032
Frequently Asked Questions
1. What is the projected Compound Annual Growth Rate (CAGR) of the Fruits & Vegetables Processing Industry?
The projected CAGR is approximately 3.70%.
2. Which companies are prominent players in the Fruits & Vegetables Processing Industry?
Key companies in the market include B&G Foods, SVZ International, Nestle, Albertsons Companies Inc, Archer Daniels Midland Company, OLAM International*List Not Exhaustive, Conagra Foods, Agrana, Kraft Heinz Company.
3. What are the main segments of the Fruits & Vegetables Processing Industry?
The market segments include Type, Product, Processing Equipment.
4. Can you provide details about the market size?
The market size is estimated to be USD XX Million as of 2022.
5. What are some drivers contributing to market growth?
Increasing Focus on Maintaining Health and Well-Being; Launching Supplements For Specific Purposes and Targeted Population.
6. What are the notable trends driving market growth?
Adoption of Energy-efficient Food Processing Equipment.
7. Are there any restraints impacting market growth?
Supplement Consumption and Their Side-effects; Inclination Towards Substitute Products.
8. Can you provide examples of recent developments in the market?
In September 2021, The Kraft Heinz Company entered an agreement to acquire 'Hemmer,' a Brazilian company focused on condiments and sauces. The acquisition is designed to expand consumers' taste options in Brazil while supporting Kraft Heinz's strategy of growing its International Taste Elevation product platform and its presence in emerging markets.
9. What pricing options are available for accessing the report?
Pricing options include single-user, multi-user, and enterprise licenses priced at USD 4750, USD 5250, and USD 8750 respectively.
10. Is the market size provided in terms of value or volume?
The market size is provided in terms of value, measured in Million and volume, measured in K Units.
11. Are there any specific market keywords associated with the report?
Yes, the market keyword associated with the report is "Fruits & Vegetables Processing Industry," which aids in identifying and referencing the specific market segment covered.
12. How do I determine which pricing option suits my needs best?
The pricing options vary based on user requirements and access needs. Individual users may opt for single-user licenses, while businesses requiring broader access may choose multi-user or enterprise licenses for cost-effective access to the report.
13. Are there any additional resources or data provided in the Fruits & Vegetables Processing Industry report?
While the report offers comprehensive insights, it's advisable to review the specific contents or supplementary materials provided to ascertain if additional resources or data are available.
14. How can I stay updated on further developments or reports in the Fruits & Vegetables Processing Industry?
To stay informed about further developments, trends, and reports in the Fruits & Vegetables Processing Industry, consider subscribing to industry newsletters, following relevant companies and organizations, or regularly checking reputable industry news sources and publications.
Methodology
Step 1 - Identification of Relevant Samples Size from Population Database


Step 2 - Approaches for Defining Global Market Size (Value, Volume* & Price*)

Note*: In applicable scenarios
Step 3 - Data Sources
Primary Research
- Web Analytics
- Survey Reports
- Research Institute
- Latest Research Reports
- Opinion Leaders
Secondary Research
- Annual Reports
- White Paper
- Latest Press Release
- Industry Association
- Paid Database
- Investor Presentations

Step 4 - Data Triangulation
Involves using different sources of information in order to increase the validity of a study
These sources are likely to be stakeholders in a program - participants, other researchers, program staff, other community members, and so on.
Then we put all data in single framework & apply various statistical tools to find out the dynamic on the market.
During the analysis stage, feedback from the stakeholder groups would be compared to determine areas of agreement as well as areas of divergence


