
Key Insights
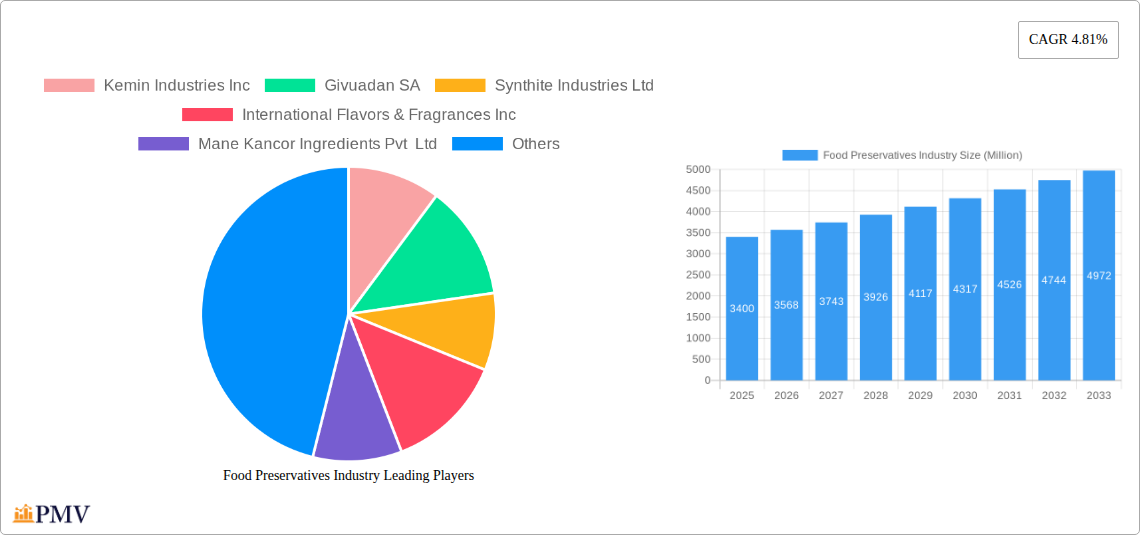
The global food preservatives market, valued at $3.40 billion in 2025, is projected to experience robust growth, driven by increasing consumer demand for longer shelf-life products and a rising focus on food safety. This expanding market is fueled by several key factors. The increasing prevalence of processed and ready-to-eat foods necessitates effective preservation methods to maintain quality and prevent spoilage. Furthermore, advancements in food preservation technologies, including the development of natural and clean-label preservatives, are contributing to market expansion. Changing lifestyles and increased urbanization are also contributing factors, as consumers prioritize convenience and readily available food options. However, growing consumer awareness of the potential health implications of certain preservatives and stringent regulatory landscapes in various regions pose challenges to market growth. The market is segmented based on preservative type (natural vs. synthetic), application (meat, bakery, beverages, etc.), and geographic region. Major players like Kemin Industries Inc., Givaudan SA, and BASF SE are actively shaping the market through innovation and strategic partnerships. The market's future trajectory depends on maintaining a delicate balance between consumer demand for safe and convenient food products and addressing concerns about the use of synthetic preservatives.
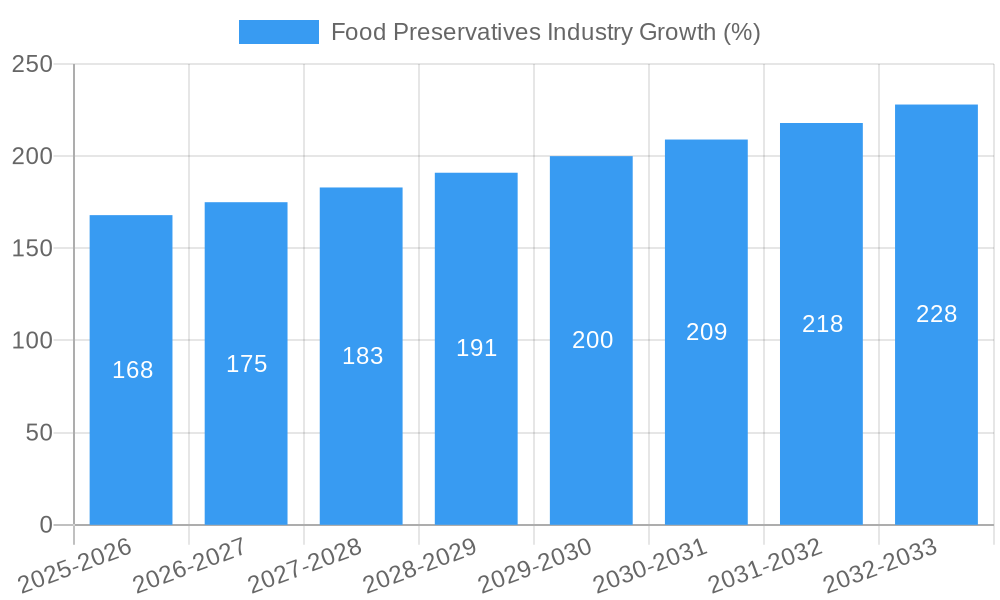
The forecast period (2025-2033) anticipates a continued upward trend, with the CAGR of 4.81% suggesting a steadily expanding market. This growth will likely be influenced by factors such as increasing disposable incomes in developing economies, further technological innovations leading to more effective and safer preservatives, and a continued shift towards convenient food consumption patterns globally. Competition among established players and the emergence of new entrants will be a key dynamic, influencing pricing strategies and the pace of innovation. The market's future success will depend on the industry's ability to adapt to evolving consumer preferences and regulatory changes, while continuing to deliver safe and effective food preservation solutions.
Food Preservatives Industry Market Report: 2019-2033
This comprehensive report provides an in-depth analysis of the global food preservatives industry, encompassing market size, segmentation, competitive landscape, and future growth prospects. The study period covers 2019-2033, with 2025 as the base and estimated year, and a forecast period of 2025-2033. The historical period analyzed is 2019-2024. The report values are expressed in Millions.
Food Preservatives Industry Market Structure & Competitive Dynamics
The global food preservatives market is characterized by a moderately concentrated structure, with several multinational corporations holding significant market share. Key players include Kemin Industries Inc, Givaudan SA, Synthite Industries Ltd, International Flavors & Fragrances Inc, Mane Kancor Ingredients Pvt Ltd, BASF SE, Tate & Lyle PLC, Corbion NV, Hawkins Watt Limited, and Eastman Chemical Company. However, the market also includes numerous smaller regional players and specialized manufacturers. The industry is witnessing increasing M&A activity, driven by the need for expansion into new markets and access to innovative technologies. Deal values have averaged approximately $xx Million in recent years, with a notable increase in acquisitions of smaller, specialized firms by larger players.
- Market Concentration: The top 5 players hold an estimated xx% market share.
- Innovation Ecosystems: Significant investments in R&D are driving innovation in natural and clean-label preservatives.
- Regulatory Frameworks: Stringent regulations regarding food safety and labeling are influencing product development and market dynamics.
- Product Substitutes: The emergence of natural and organic preservatives is challenging traditional synthetic options.
- End-User Trends: Growing demand for convenient, ready-to-eat foods is boosting market growth.
- M&A Activities: Consolidation is increasing, with larger companies acquiring smaller, specialized firms to expand their product portfolio and market reach.
Food Preservatives Industry Industry Trends & Insights
The global food preservatives market is projected to experience a Compound Annual Growth Rate (CAGR) of xx% during the forecast period (2025-2033). This growth is driven by several factors, including the rising demand for processed foods, increasing consumer awareness of food safety, and the growing preference for extended shelf life products. Technological advancements, such as the development of novel preservation techniques and clean-label ingredients, are further fueling market expansion. The market penetration of natural preservatives is increasing steadily, driven by consumer preference for natural and clean-label products. However, the market faces challenges such as stringent regulatory frameworks and fluctuations in raw material prices. Competitive dynamics are intense, with companies investing heavily in R&D and marketing to gain a competitive edge. Market penetration of clean-label preservatives is expected to reach xx% by 2033.
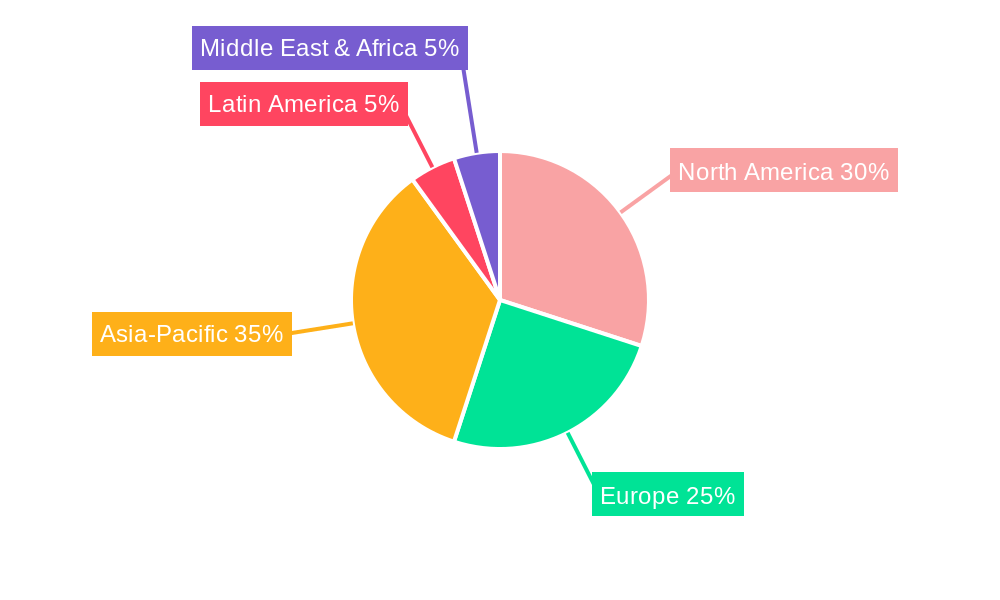
Dominant Markets & Segments in Food Preservatives Industry
The North American region currently dominates the global food preservatives market, followed by Europe and Asia-Pacific. This dominance is attributed to factors such as high per capita consumption of processed foods, well-established food processing industries, and strong regulatory frameworks.
- Key Drivers in North America: High processed food consumption, strong regulatory framework, established food processing infrastructure.
- Key Drivers in Europe: Stringent food safety regulations driving innovation in natural preservatives, high demand for clean-label products.
- Key Drivers in Asia-Pacific: Rapidly growing middle class, increasing disposable incomes, and rising demand for convenience foods.
The detailed dominance analysis highlights the significant contribution of processed meat and dairy segments to overall market revenue. These segments are characterized by high demand for preservatives to enhance shelf life and maintain product quality.
Food Preservatives Industry Product Innovations
Recent innovations in the food preservatives market include the development of natural and clean-label alternatives to traditional synthetic preservatives, such as the launch of Kemin Industries' RUBINITE GC Dry, a natural alternative to sodium nitrite. This trend reflects the growing consumer preference for natural and minimally processed foods. Further innovations involve advanced preservation technologies that extend shelf life while minimizing the use of chemical preservatives.
Report Segmentation & Scope
This report segments the food preservatives market based on type (e.g., natural preservatives, synthetic preservatives), application (e.g., meat & poultry, dairy, bakery), and region (e.g., North America, Europe, Asia-Pacific). Each segment's growth projections, market size, and competitive dynamics are detailed within the report. Growth projections vary across segments, with the natural preservatives segment experiencing significant growth due to increasing consumer demand.
Key Drivers of Food Preservatives Industry Growth
The growth of the food preservatives industry is driven by factors such as the increasing demand for processed and convenience foods, growing consumer awareness of food safety and hygiene, and the need for extending the shelf life of food products. Technological advancements in preservation techniques and the development of novel, clean-label preservatives are further contributing to market expansion. Government regulations related to food safety are also playing a crucial role.
Challenges in the Food Preservatives Industry Sector
The food preservatives industry faces challenges such as stringent regulations, fluctuating raw material prices, and increasing consumer preference for natural and organic preservatives. These factors can significantly impact production costs and profitability. Furthermore, intense competition among manufacturers necessitates continuous innovation and cost optimization to maintain market share. Estimated impact on profitability: xx% due to fluctuating raw material prices.
Leading Players in the Food Preservatives Industry Market
- Kemin Industries Inc
- Givaudan SA
- Synthite Industries Ltd
- International Flavors & Fragrances Inc
- Mane Kancor Ingredients Pvt Ltd
- BASF SE
- Tate & Lyle PLC
- Corbion NV
- Hawkins Watt Limited
- Eastman Chemical Company
- List Not Exhaustive
Key Developments in Food Preservatives Industry Sector
- July 2022: Kemin Industries Inc. launched RUBINITE GC Dry, a natural food preservative.
- March 2022: DSM launched DelvoGuard cultures, clean-label solutions for dairy products.
- November 2021: Tate & Lyle PLC announced a new biomass boiler for its acidulants plant.
- April 2021: Kemin Industries Inc. expanded its distribution agreement with DKSH in the Philippines and Indonesia.
Strategic Food Preservatives Industry Market Outlook
The future of the food preservatives industry appears promising, driven by the continued growth of the processed food sector and the increasing demand for convenient and shelf-stable products. Strategic opportunities exist in the development of sustainable and eco-friendly preservatives, as well as in expanding into emerging markets with high growth potential. Companies focused on innovation and sustainability are best positioned to capture market share in the coming years.
Food Preservatives Industry Segmentation
-
1. Type
-
1.1. Antioxidants
- 1.1.1. Natural Antioxidants
- 1.1.2. Synthetic Antioxidants
-
1.2. Antimicrobials
- 1.2.1. Natural Antimicrobial
- 1.2.2. Synthetic Antimicrobial
- 1.3. Acidulant
- 1.4. Other Types
-
1.1. Antioxidants
-
2. Application
- 2.1. Bakery and Confectionery
- 2.2. Meat and Poultry
- 2.3. Ready Meals
- 2.4. Sweet and Savory Snacks
- 2.5. Sauces and Dressings
- 2.6. Edible Oils
- 2.7. Other Applications
Food Preservatives Industry Segmentation By Geography
-
1. North America
- 1.1. United States
- 1.2. Canada
- 1.3. Mexico
- 1.4. Rest of North America
-
2. Europe
- 2.1. Spain
- 2.2. United Kingdom
- 2.3. Germany
- 2.4. France
- 2.5. Italy
- 2.6. Russia
- 2.7. Rest of Europe
-
3. Asia Pacific
- 3.1. China
- 3.2. Japan
- 3.3. India
- 3.4. Australia
- 3.5. Rest of Asia Pacific
-
4. South America
- 4.1. Brazil
- 4.2. Argentina
- 4.3. Rest of South America
-
5. Middle East and Africa
- 5.1. South Africa
- 5.2. United Arab Emirates
- 5.3. Rest of Middle East and Africa
Food Preservatives Industry REPORT HIGHLIGHTS
| Aspects | Details |
|---|---|
| Study Period | 2019-2033 |
| Base Year | 2024 |
| Estimated Year | 2025 |
| Forecast Period | 2025-2033 |
| Historical Period | 2019-2024 |
| Growth Rate | CAGR of 4.81% from 2019-2033 |
| Segmentation |
|
Table of Contents
- 1. Introduction
- 1.1. Research Scope
- 1.2. Market Segmentation
- 1.3. Research Methodology
- 1.4. Definitions and Assumptions
- 2. Executive Summary
- 2.1. Introduction
- 3. Market Dynamics
- 3.1. Introduction
- 3.2. Market Drivers
- 3.3. Market Restrains
- 3.4. Market Trends
- 3.4.1. Surge in Demand for Clean Label Food Products
- 4. Market Factor Analysis
- 4.1. Porters Five Forces
- 4.2. Supply/Value Chain
- 4.3. PESTEL analysis
- 4.4. Market Entropy
- 4.5. Patent/Trademark Analysis
- 5. Global Food Preservatives Industry Analysis, Insights and Forecast, 2019-2031
- 5.1. Market Analysis, Insights and Forecast - by Type
- 5.1.1. Antioxidants
- 5.1.1.1. Natural Antioxidants
- 5.1.1.2. Synthetic Antioxidants
- 5.1.2. Antimicrobials
- 5.1.2.1. Natural Antimicrobial
- 5.1.2.2. Synthetic Antimicrobial
- 5.1.3. Acidulant
- 5.1.4. Other Types
- 5.1.1. Antioxidants
- 5.2. Market Analysis, Insights and Forecast - by Application
- 5.2.1. Bakery and Confectionery
- 5.2.2. Meat and Poultry
- 5.2.3. Ready Meals
- 5.2.4. Sweet and Savory Snacks
- 5.2.5. Sauces and Dressings
- 5.2.6. Edible Oils
- 5.2.7. Other Applications
- 5.3. Market Analysis, Insights and Forecast - by Region
- 5.3.1. North America
- 5.3.2. Europe
- 5.3.3. Asia Pacific
- 5.3.4. South America
- 5.3.5. Middle East and Africa
- 5.1. Market Analysis, Insights and Forecast - by Type
- 6. North America Food Preservatives Industry Analysis, Insights and Forecast, 2019-2031
- 6.1. Market Analysis, Insights and Forecast - by Type
- 6.1.1. Antioxidants
- 6.1.1.1. Natural Antioxidants
- 6.1.1.2. Synthetic Antioxidants
- 6.1.2. Antimicrobials
- 6.1.2.1. Natural Antimicrobial
- 6.1.2.2. Synthetic Antimicrobial
- 6.1.3. Acidulant
- 6.1.4. Other Types
- 6.1.1. Antioxidants
- 6.2. Market Analysis, Insights and Forecast - by Application
- 6.2.1. Bakery and Confectionery
- 6.2.2. Meat and Poultry
- 6.2.3. Ready Meals
- 6.2.4. Sweet and Savory Snacks
- 6.2.5. Sauces and Dressings
- 6.2.6. Edible Oils
- 6.2.7. Other Applications
- 6.1. Market Analysis, Insights and Forecast - by Type
- 7. Europe Food Preservatives Industry Analysis, Insights and Forecast, 2019-2031
- 7.1. Market Analysis, Insights and Forecast - by Type
- 7.1.1. Antioxidants
- 7.1.1.1. Natural Antioxidants
- 7.1.1.2. Synthetic Antioxidants
- 7.1.2. Antimicrobials
- 7.1.2.1. Natural Antimicrobial
- 7.1.2.2. Synthetic Antimicrobial
- 7.1.3. Acidulant
- 7.1.4. Other Types
- 7.1.1. Antioxidants
- 7.2. Market Analysis, Insights and Forecast - by Application
- 7.2.1. Bakery and Confectionery
- 7.2.2. Meat and Poultry
- 7.2.3. Ready Meals
- 7.2.4. Sweet and Savory Snacks
- 7.2.5. Sauces and Dressings
- 7.2.6. Edible Oils
- 7.2.7. Other Applications
- 7.1. Market Analysis, Insights and Forecast - by Type
- 8. Asia Pacific Food Preservatives Industry Analysis, Insights and Forecast, 2019-2031
- 8.1. Market Analysis, Insights and Forecast - by Type
- 8.1.1. Antioxidants
- 8.1.1.1. Natural Antioxidants
- 8.1.1.2. Synthetic Antioxidants
- 8.1.2. Antimicrobials
- 8.1.2.1. Natural Antimicrobial
- 8.1.2.2. Synthetic Antimicrobial
- 8.1.3. Acidulant
- 8.1.4. Other Types
- 8.1.1. Antioxidants
- 8.2. Market Analysis, Insights and Forecast - by Application
- 8.2.1. Bakery and Confectionery
- 8.2.2. Meat and Poultry
- 8.2.3. Ready Meals
- 8.2.4. Sweet and Savory Snacks
- 8.2.5. Sauces and Dressings
- 8.2.6. Edible Oils
- 8.2.7. Other Applications
- 8.1. Market Analysis, Insights and Forecast - by Type
- 9. South America Food Preservatives Industry Analysis, Insights and Forecast, 2019-2031
- 9.1. Market Analysis, Insights and Forecast - by Type
- 9.1.1. Antioxidants
- 9.1.1.1. Natural Antioxidants
- 9.1.1.2. Synthetic Antioxidants
- 9.1.2. Antimicrobials
- 9.1.2.1. Natural Antimicrobial
- 9.1.2.2. Synthetic Antimicrobial
- 9.1.3. Acidulant
- 9.1.4. Other Types
- 9.1.1. Antioxidants
- 9.2. Market Analysis, Insights and Forecast - by Application
- 9.2.1. Bakery and Confectionery
- 9.2.2. Meat and Poultry
- 9.2.3. Ready Meals
- 9.2.4. Sweet and Savory Snacks
- 9.2.5. Sauces and Dressings
- 9.2.6. Edible Oils
- 9.2.7. Other Applications
- 9.1. Market Analysis, Insights and Forecast - by Type
- 10. Middle East and Africa Food Preservatives Industry Analysis, Insights and Forecast, 2019-2031
- 10.1. Market Analysis, Insights and Forecast - by Type
- 10.1.1. Antioxidants
- 10.1.1.1. Natural Antioxidants
- 10.1.1.2. Synthetic Antioxidants
- 10.1.2. Antimicrobials
- 10.1.2.1. Natural Antimicrobial
- 10.1.2.2. Synthetic Antimicrobial
- 10.1.3. Acidulant
- 10.1.4. Other Types
- 10.1.1. Antioxidants
- 10.2. Market Analysis, Insights and Forecast - by Application
- 10.2.1. Bakery and Confectionery
- 10.2.2. Meat and Poultry
- 10.2.3. Ready Meals
- 10.2.4. Sweet and Savory Snacks
- 10.2.5. Sauces and Dressings
- 10.2.6. Edible Oils
- 10.2.7. Other Applications
- 10.1. Market Analysis, Insights and Forecast - by Type
- 11. Competitive Analysis
- 11.1. Global Market Share Analysis 2024
- 11.2. Company Profiles
- 11.2.1 Kemin Industries Inc
- 11.2.1.1. Overview
- 11.2.1.2. Products
- 11.2.1.3. SWOT Analysis
- 11.2.1.4. Recent Developments
- 11.2.1.5. Financials (Based on Availability)
- 11.2.2 Givuadan SA
- 11.2.2.1. Overview
- 11.2.2.2. Products
- 11.2.2.3. SWOT Analysis
- 11.2.2.4. Recent Developments
- 11.2.2.5. Financials (Based on Availability)
- 11.2.3 Synthite Industries Ltd
- 11.2.3.1. Overview
- 11.2.3.2. Products
- 11.2.3.3. SWOT Analysis
- 11.2.3.4. Recent Developments
- 11.2.3.5. Financials (Based on Availability)
- 11.2.4 International Flavors & Fragrances Inc
- 11.2.4.1. Overview
- 11.2.4.2. Products
- 11.2.4.3. SWOT Analysis
- 11.2.4.4. Recent Developments
- 11.2.4.5. Financials (Based on Availability)
- 11.2.5 Mane Kancor Ingredients Pvt Ltd
- 11.2.5.1. Overview
- 11.2.5.2. Products
- 11.2.5.3. SWOT Analysis
- 11.2.5.4. Recent Developments
- 11.2.5.5. Financials (Based on Availability)
- 11.2.6 BASF SE
- 11.2.6.1. Overview
- 11.2.6.2. Products
- 11.2.6.3. SWOT Analysis
- 11.2.6.4. Recent Developments
- 11.2.6.5. Financials (Based on Availability)
- 11.2.7 Tate & Lyle PLC
- 11.2.7.1. Overview
- 11.2.7.2. Products
- 11.2.7.3. SWOT Analysis
- 11.2.7.4. Recent Developments
- 11.2.7.5. Financials (Based on Availability)
- 11.2.8 Corbion NV
- 11.2.8.1. Overview
- 11.2.8.2. Products
- 11.2.8.3. SWOT Analysis
- 11.2.8.4. Recent Developments
- 11.2.8.5. Financials (Based on Availability)
- 11.2.9 Hawkins Watt Limited
- 11.2.9.1. Overview
- 11.2.9.2. Products
- 11.2.9.3. SWOT Analysis
- 11.2.9.4. Recent Developments
- 11.2.9.5. Financials (Based on Availability)
- 11.2.10 Eastman Chemical Company*List Not Exhaustive
- 11.2.10.1. Overview
- 11.2.10.2. Products
- 11.2.10.3. SWOT Analysis
- 11.2.10.4. Recent Developments
- 11.2.10.5. Financials (Based on Availability)
- 11.2.1 Kemin Industries Inc
List of Figures
- Figure 1: Global Food Preservatives Industry Revenue Breakdown (Million, %) by Region 2024 & 2032
- Figure 2: Global Food Preservatives Industry Volume Breakdown (Billion, %) by Region 2024 & 2032
- Figure 3: North America Food Preservatives Industry Revenue (Million), by Type 2024 & 2032
- Figure 4: North America Food Preservatives Industry Volume (Billion), by Type 2024 & 2032
- Figure 5: North America Food Preservatives Industry Revenue Share (%), by Type 2024 & 2032
- Figure 6: North America Food Preservatives Industry Volume Share (%), by Type 2024 & 2032
- Figure 7: North America Food Preservatives Industry Revenue (Million), by Application 2024 & 2032
- Figure 8: North America Food Preservatives Industry Volume (Billion), by Application 2024 & 2032
- Figure 9: North America Food Preservatives Industry Revenue Share (%), by Application 2024 & 2032
- Figure 10: North America Food Preservatives Industry Volume Share (%), by Application 2024 & 2032
- Figure 11: North America Food Preservatives Industry Revenue (Million), by Country 2024 & 2032
- Figure 12: North America Food Preservatives Industry Volume (Billion), by Country 2024 & 2032
- Figure 13: North America Food Preservatives Industry Revenue Share (%), by Country 2024 & 2032
- Figure 14: North America Food Preservatives Industry Volume Share (%), by Country 2024 & 2032
- Figure 15: Europe Food Preservatives Industry Revenue (Million), by Type 2024 & 2032
- Figure 16: Europe Food Preservatives Industry Volume (Billion), by Type 2024 & 2032
- Figure 17: Europe Food Preservatives Industry Revenue Share (%), by Type 2024 & 2032
- Figure 18: Europe Food Preservatives Industry Volume Share (%), by Type 2024 & 2032
- Figure 19: Europe Food Preservatives Industry Revenue (Million), by Application 2024 & 2032
- Figure 20: Europe Food Preservatives Industry Volume (Billion), by Application 2024 & 2032
- Figure 21: Europe Food Preservatives Industry Revenue Share (%), by Application 2024 & 2032
- Figure 22: Europe Food Preservatives Industry Volume Share (%), by Application 2024 & 2032
- Figure 23: Europe Food Preservatives Industry Revenue (Million), by Country 2024 & 2032
- Figure 24: Europe Food Preservatives Industry Volume (Billion), by Country 2024 & 2032
- Figure 25: Europe Food Preservatives Industry Revenue Share (%), by Country 2024 & 2032
- Figure 26: Europe Food Preservatives Industry Volume Share (%), by Country 2024 & 2032
- Figure 27: Asia Pacific Food Preservatives Industry Revenue (Million), by Type 2024 & 2032
- Figure 28: Asia Pacific Food Preservatives Industry Volume (Billion), by Type 2024 & 2032
- Figure 29: Asia Pacific Food Preservatives Industry Revenue Share (%), by Type 2024 & 2032
- Figure 30: Asia Pacific Food Preservatives Industry Volume Share (%), by Type 2024 & 2032
- Figure 31: Asia Pacific Food Preservatives Industry Revenue (Million), by Application 2024 & 2032
- Figure 32: Asia Pacific Food Preservatives Industry Volume (Billion), by Application 2024 & 2032
- Figure 33: Asia Pacific Food Preservatives Industry Revenue Share (%), by Application 2024 & 2032
- Figure 34: Asia Pacific Food Preservatives Industry Volume Share (%), by Application 2024 & 2032
- Figure 35: Asia Pacific Food Preservatives Industry Revenue (Million), by Country 2024 & 2032
- Figure 36: Asia Pacific Food Preservatives Industry Volume (Billion), by Country 2024 & 2032
- Figure 37: Asia Pacific Food Preservatives Industry Revenue Share (%), by Country 2024 & 2032
- Figure 38: Asia Pacific Food Preservatives Industry Volume Share (%), by Country 2024 & 2032
- Figure 39: South America Food Preservatives Industry Revenue (Million), by Type 2024 & 2032
- Figure 40: South America Food Preservatives Industry Volume (Billion), by Type 2024 & 2032
- Figure 41: South America Food Preservatives Industry Revenue Share (%), by Type 2024 & 2032
- Figure 42: South America Food Preservatives Industry Volume Share (%), by Type 2024 & 2032
- Figure 43: South America Food Preservatives Industry Revenue (Million), by Application 2024 & 2032
- Figure 44: South America Food Preservatives Industry Volume (Billion), by Application 2024 & 2032
- Figure 45: South America Food Preservatives Industry Revenue Share (%), by Application 2024 & 2032
- Figure 46: South America Food Preservatives Industry Volume Share (%), by Application 2024 & 2032
- Figure 47: South America Food Preservatives Industry Revenue (Million), by Country 2024 & 2032
- Figure 48: South America Food Preservatives Industry Volume (Billion), by Country 2024 & 2032
- Figure 49: South America Food Preservatives Industry Revenue Share (%), by Country 2024 & 2032
- Figure 50: South America Food Preservatives Industry Volume Share (%), by Country 2024 & 2032
- Figure 51: Middle East and Africa Food Preservatives Industry Revenue (Million), by Type 2024 & 2032
- Figure 52: Middle East and Africa Food Preservatives Industry Volume (Billion), by Type 2024 & 2032
- Figure 53: Middle East and Africa Food Preservatives Industry Revenue Share (%), by Type 2024 & 2032
- Figure 54: Middle East and Africa Food Preservatives Industry Volume Share (%), by Type 2024 & 2032
- Figure 55: Middle East and Africa Food Preservatives Industry Revenue (Million), by Application 2024 & 2032
- Figure 56: Middle East and Africa Food Preservatives Industry Volume (Billion), by Application 2024 & 2032
- Figure 57: Middle East and Africa Food Preservatives Industry Revenue Share (%), by Application 2024 & 2032
- Figure 58: Middle East and Africa Food Preservatives Industry Volume Share (%), by Application 2024 & 2032
- Figure 59: Middle East and Africa Food Preservatives Industry Revenue (Million), by Country 2024 & 2032
- Figure 60: Middle East and Africa Food Preservatives Industry Volume (Billion), by Country 2024 & 2032
- Figure 61: Middle East and Africa Food Preservatives Industry Revenue Share (%), by Country 2024 & 2032
- Figure 62: Middle East and Africa Food Preservatives Industry Volume Share (%), by Country 2024 & 2032
List of Tables
- Table 1: Global Food Preservatives Industry Revenue Million Forecast, by Region 2019 & 2032
- Table 2: Global Food Preservatives Industry Volume Billion Forecast, by Region 2019 & 2032
- Table 3: Global Food Preservatives Industry Revenue Million Forecast, by Type 2019 & 2032
- Table 4: Global Food Preservatives Industry Volume Billion Forecast, by Type 2019 & 2032
- Table 5: Global Food Preservatives Industry Revenue Million Forecast, by Application 2019 & 2032
- Table 6: Global Food Preservatives Industry Volume Billion Forecast, by Application 2019 & 2032
- Table 7: Global Food Preservatives Industry Revenue Million Forecast, by Region 2019 & 2032
- Table 8: Global Food Preservatives Industry Volume Billion Forecast, by Region 2019 & 2032
- Table 9: Global Food Preservatives Industry Revenue Million Forecast, by Type 2019 & 2032
- Table 10: Global Food Preservatives Industry Volume Billion Forecast, by Type 2019 & 2032
- Table 11: Global Food Preservatives Industry Revenue Million Forecast, by Application 2019 & 2032
- Table 12: Global Food Preservatives Industry Volume Billion Forecast, by Application 2019 & 2032
- Table 13: Global Food Preservatives Industry Revenue Million Forecast, by Country 2019 & 2032
- Table 14: Global Food Preservatives Industry Volume Billion Forecast, by Country 2019 & 2032
- Table 15: United States Food Preservatives Industry Revenue (Million) Forecast, by Application 2019 & 2032
- Table 16: United States Food Preservatives Industry Volume (Billion) Forecast, by Application 2019 & 2032
- Table 17: Canada Food Preservatives Industry Revenue (Million) Forecast, by Application 2019 & 2032
- Table 18: Canada Food Preservatives Industry Volume (Billion) Forecast, by Application 2019 & 2032
- Table 19: Mexico Food Preservatives Industry Revenue (Million) Forecast, by Application 2019 & 2032
- Table 20: Mexico Food Preservatives Industry Volume (Billion) Forecast, by Application 2019 & 2032
- Table 21: Rest of North America Food Preservatives Industry Revenue (Million) Forecast, by Application 2019 & 2032
- Table 22: Rest of North America Food Preservatives Industry Volume (Billion) Forecast, by Application 2019 & 2032
- Table 23: Global Food Preservatives Industry Revenue Million Forecast, by Type 2019 & 2032
- Table 24: Global Food Preservatives Industry Volume Billion Forecast, by Type 2019 & 2032
- Table 25: Global Food Preservatives Industry Revenue Million Forecast, by Application 2019 & 2032
- Table 26: Global Food Preservatives Industry Volume Billion Forecast, by Application 2019 & 2032
- Table 27: Global Food Preservatives Industry Revenue Million Forecast, by Country 2019 & 2032
- Table 28: Global Food Preservatives Industry Volume Billion Forecast, by Country 2019 & 2032
- Table 29: Spain Food Preservatives Industry Revenue (Million) Forecast, by Application 2019 & 2032
- Table 30: Spain Food Preservatives Industry Volume (Billion) Forecast, by Application 2019 & 2032
- Table 31: United Kingdom Food Preservatives Industry Revenue (Million) Forecast, by Application 2019 & 2032
- Table 32: United Kingdom Food Preservatives Industry Volume (Billion) Forecast, by Application 2019 & 2032
- Table 33: Germany Food Preservatives Industry Revenue (Million) Forecast, by Application 2019 & 2032
- Table 34: Germany Food Preservatives Industry Volume (Billion) Forecast, by Application 2019 & 2032
- Table 35: France Food Preservatives Industry Revenue (Million) Forecast, by Application 2019 & 2032
- Table 36: France Food Preservatives Industry Volume (Billion) Forecast, by Application 2019 & 2032
- Table 37: Italy Food Preservatives Industry Revenue (Million) Forecast, by Application 2019 & 2032
- Table 38: Italy Food Preservatives Industry Volume (Billion) Forecast, by Application 2019 & 2032
- Table 39: Russia Food Preservatives Industry Revenue (Million) Forecast, by Application 2019 & 2032
- Table 40: Russia Food Preservatives Industry Volume (Billion) Forecast, by Application 2019 & 2032
- Table 41: Rest of Europe Food Preservatives Industry Revenue (Million) Forecast, by Application 2019 & 2032
- Table 42: Rest of Europe Food Preservatives Industry Volume (Billion) Forecast, by Application 2019 & 2032
- Table 43: Global Food Preservatives Industry Revenue Million Forecast, by Type 2019 & 2032
- Table 44: Global Food Preservatives Industry Volume Billion Forecast, by Type 2019 & 2032
- Table 45: Global Food Preservatives Industry Revenue Million Forecast, by Application 2019 & 2032
- Table 46: Global Food Preservatives Industry Volume Billion Forecast, by Application 2019 & 2032
- Table 47: Global Food Preservatives Industry Revenue Million Forecast, by Country 2019 & 2032
- Table 48: Global Food Preservatives Industry Volume Billion Forecast, by Country 2019 & 2032
- Table 49: China Food Preservatives Industry Revenue (Million) Forecast, by Application 2019 & 2032
- Table 50: China Food Preservatives Industry Volume (Billion) Forecast, by Application 2019 & 2032
- Table 51: Japan Food Preservatives Industry Revenue (Million) Forecast, by Application 2019 & 2032
- Table 52: Japan Food Preservatives Industry Volume (Billion) Forecast, by Application 2019 & 2032
- Table 53: India Food Preservatives Industry Revenue (Million) Forecast, by Application 2019 & 2032
- Table 54: India Food Preservatives Industry Volume (Billion) Forecast, by Application 2019 & 2032
- Table 55: Australia Food Preservatives Industry Revenue (Million) Forecast, by Application 2019 & 2032
- Table 56: Australia Food Preservatives Industry Volume (Billion) Forecast, by Application 2019 & 2032
- Table 57: Rest of Asia Pacific Food Preservatives Industry Revenue (Million) Forecast, by Application 2019 & 2032
- Table 58: Rest of Asia Pacific Food Preservatives Industry Volume (Billion) Forecast, by Application 2019 & 2032
- Table 59: Global Food Preservatives Industry Revenue Million Forecast, by Type 2019 & 2032
- Table 60: Global Food Preservatives Industry Volume Billion Forecast, by Type 2019 & 2032
- Table 61: Global Food Preservatives Industry Revenue Million Forecast, by Application 2019 & 2032
- Table 62: Global Food Preservatives Industry Volume Billion Forecast, by Application 2019 & 2032
- Table 63: Global Food Preservatives Industry Revenue Million Forecast, by Country 2019 & 2032
- Table 64: Global Food Preservatives Industry Volume Billion Forecast, by Country 2019 & 2032
- Table 65: Brazil Food Preservatives Industry Revenue (Million) Forecast, by Application 2019 & 2032
- Table 66: Brazil Food Preservatives Industry Volume (Billion) Forecast, by Application 2019 & 2032
- Table 67: Argentina Food Preservatives Industry Revenue (Million) Forecast, by Application 2019 & 2032
- Table 68: Argentina Food Preservatives Industry Volume (Billion) Forecast, by Application 2019 & 2032
- Table 69: Rest of South America Food Preservatives Industry Revenue (Million) Forecast, by Application 2019 & 2032
- Table 70: Rest of South America Food Preservatives Industry Volume (Billion) Forecast, by Application 2019 & 2032
- Table 71: Global Food Preservatives Industry Revenue Million Forecast, by Type 2019 & 2032
- Table 72: Global Food Preservatives Industry Volume Billion Forecast, by Type 2019 & 2032
- Table 73: Global Food Preservatives Industry Revenue Million Forecast, by Application 2019 & 2032
- Table 74: Global Food Preservatives Industry Volume Billion Forecast, by Application 2019 & 2032
- Table 75: Global Food Preservatives Industry Revenue Million Forecast, by Country 2019 & 2032
- Table 76: Global Food Preservatives Industry Volume Billion Forecast, by Country 2019 & 2032
- Table 77: South Africa Food Preservatives Industry Revenue (Million) Forecast, by Application 2019 & 2032
- Table 78: South Africa Food Preservatives Industry Volume (Billion) Forecast, by Application 2019 & 2032
- Table 79: United Arab Emirates Food Preservatives Industry Revenue (Million) Forecast, by Application 2019 & 2032
- Table 80: United Arab Emirates Food Preservatives Industry Volume (Billion) Forecast, by Application 2019 & 2032
- Table 81: Rest of Middle East and Africa Food Preservatives Industry Revenue (Million) Forecast, by Application 2019 & 2032
- Table 82: Rest of Middle East and Africa Food Preservatives Industry Volume (Billion) Forecast, by Application 2019 & 2032
Frequently Asked Questions
1. What is the projected Compound Annual Growth Rate (CAGR) of the Food Preservatives Industry?
The projected CAGR is approximately 4.81%.
2. Which companies are prominent players in the Food Preservatives Industry?
Key companies in the market include Kemin Industries Inc, Givuadan SA, Synthite Industries Ltd, International Flavors & Fragrances Inc, Mane Kancor Ingredients Pvt Ltd, BASF SE, Tate & Lyle PLC, Corbion NV, Hawkins Watt Limited, Eastman Chemical Company*List Not Exhaustive.
3. What are the main segments of the Food Preservatives Industry?
The market segments include Type, Application.
4. Can you provide details about the market size?
The market size is estimated to be USD 3.40 Million as of 2022.
5. What are some drivers contributing to market growth?
N/A
6. What are the notable trends driving market growth?
Surge in Demand for Clean Label Food Products.
7. Are there any restraints impacting market growth?
N/A
8. Can you provide examples of recent developments in the market?
July 2022: Kemin Industries Inc. launched a new food preservative, RUBINITE GC Dry, as a substitute for sodium nitrite. As per the company, RUBINITE is a natural alternative that can be used as a curing agent in foods, offering the best microbiological protection and maintaining product stability. Furthermore, Kemin Industries intends to employ it in processed meat products like sausages and hot dogs.
9. What pricing options are available for accessing the report?
Pricing options include single-user, multi-user, and enterprise licenses priced at USD 4750, USD 5250, and USD 8750 respectively.
10. Is the market size provided in terms of value or volume?
The market size is provided in terms of value, measured in Million and volume, measured in Billion.
11. Are there any specific market keywords associated with the report?
Yes, the market keyword associated with the report is "Food Preservatives Industry," which aids in identifying and referencing the specific market segment covered.
12. How do I determine which pricing option suits my needs best?
The pricing options vary based on user requirements and access needs. Individual users may opt for single-user licenses, while businesses requiring broader access may choose multi-user or enterprise licenses for cost-effective access to the report.
13. Are there any additional resources or data provided in the Food Preservatives Industry report?
While the report offers comprehensive insights, it's advisable to review the specific contents or supplementary materials provided to ascertain if additional resources or data are available.
14. How can I stay updated on further developments or reports in the Food Preservatives Industry?
To stay informed about further developments, trends, and reports in the Food Preservatives Industry, consider subscribing to industry newsletters, following relevant companies and organizations, or regularly checking reputable industry news sources and publications.
Methodology
Step 1 - Identification of Relevant Samples Size from Population Database


Step 2 - Approaches for Defining Global Market Size (Value, Volume* & Price*)

Note*: In applicable scenarios
Step 3 - Data Sources
Primary Research
- Web Analytics
- Survey Reports
- Research Institute
- Latest Research Reports
- Opinion Leaders
Secondary Research
- Annual Reports
- White Paper
- Latest Press Release
- Industry Association
- Paid Database
- Investor Presentations

Step 4 - Data Triangulation
Involves using different sources of information in order to increase the validity of a study
These sources are likely to be stakeholders in a program - participants, other researchers, program staff, other community members, and so on.
Then we put all data in single framework & apply various statistical tools to find out the dynamic on the market.
During the analysis stage, feedback from the stakeholder groups would be compared to determine areas of agreement as well as areas of divergence


