
Key Insights
The Fabric Data Center market, valued at $2.31 billion in 2025, is experiencing robust growth, projected to expand at a Compound Annual Growth Rate (CAGR) of 28.90% from 2025 to 2033. This surge is driven by the increasing need for agility, scalability, and automation in data center infrastructure to support the growing demands of cloud computing, big data analytics, and the Internet of Things (IoT). Businesses are adopting fabric architectures to overcome limitations of traditional data center designs, which often struggle with bottlenecks and complex management. Key drivers include the rising adoption of software-defined networking (SDN) and network function virtualization (NFV) which enhance operational efficiency and reduce capital expenditure. The shift towards hyperscale data centers and the increasing demand for high-bandwidth, low-latency connections further fuel market growth. Competitive pressures are also motivating the adoption of Fabric Data Centers, as companies seek to improve operational efficiency and maintain a competitive edge in the digital economy.
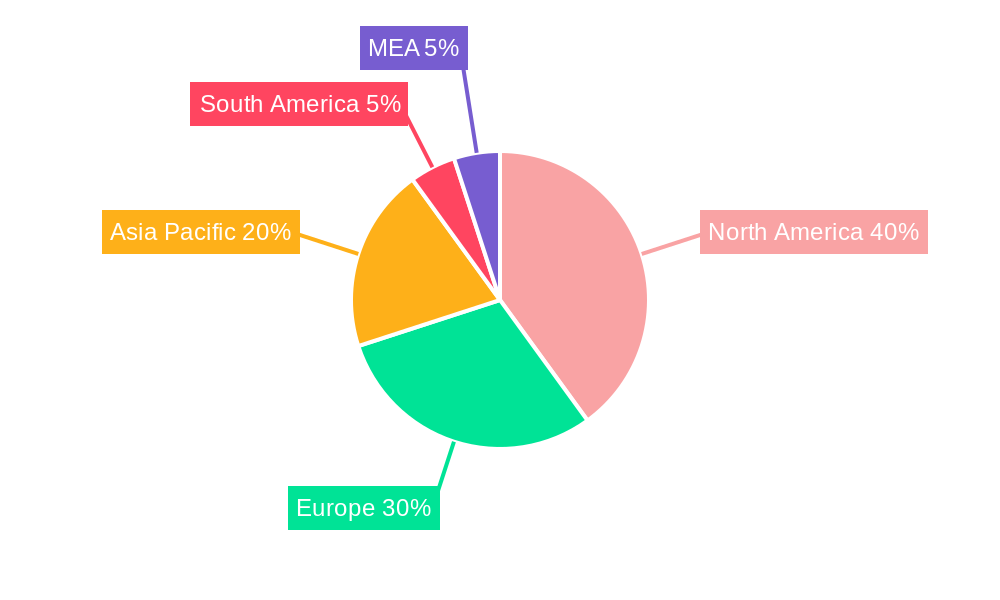
The market segmentation reveals significant opportunities across various solutions (routers, switches, storage area networking, etc.), applications (IT & Communication, Banking & Financial Services, Healthcare, Retail), and end-users (Cloud Service Providers, Telecom Service Providers). North America currently holds a dominant market share due to the high adoption of advanced technologies and the presence of major technology companies. However, the Asia-Pacific region is poised for rapid growth, driven by increasing digitalization and infrastructure investments in countries like China and India. The market faces certain restraints, including the high initial investment costs associated with implementing fabric architectures and the complexity involved in integration and management. Nevertheless, the long-term benefits of improved efficiency, scalability, and reduced operational costs outweigh these challenges, ensuring continued market expansion. Leading vendors like Cisco, IBM, and Huawei are actively investing in research and development to innovate and enhance their offerings, further solidifying their market presence and driving overall market growth.

Fabric Data Center Industry: Comprehensive Market Report (2019-2033)
This in-depth report provides a comprehensive analysis of the Fabric Data Center industry, offering invaluable insights for businesses, investors, and stakeholders seeking to navigate this rapidly evolving market. With a detailed examination spanning the period from 2019 to 2033, including a focus on the pivotal year 2025, this report unveils key trends, growth drivers, and challenges shaping the future of fabric data center technology. The market size is projected to reach xx Million by 2033, exhibiting a robust CAGR of xx% during the forecast period (2025-2033).
Fabric Data Center Industry Market Structure & Competitive Dynamics
The Fabric Data Center industry exhibits a moderately concentrated market structure, with several key players holding significant market share. The competitive landscape is characterized by intense innovation, fueled by continuous advancements in networking technologies and cloud computing. Regulatory frameworks, varying across different regions, significantly impact market dynamics. Product substitution, primarily from alternative networking architectures, poses a challenge to established players. End-user trends, particularly the increasing adoption of cloud services and the rise of edge computing, are reshaping market demand. Mergers and acquisitions (M&A) activity has been moderate, with deal values ranging from xx Million to xx Million in recent years. Key M&A activities have focused on enhancing technological capabilities and expanding market reach.
- Market Share: The top five players (IBM, Cisco, Huawei, Hewlett-Packard Enterprise, and Dell) collectively hold an estimated xx% market share.
- M&A Activity: The total value of M&A deals in the sector during 2022 was approximately xx Million, with an average deal size of approximately xx Million.
- Innovation Ecosystems: Significant investments in R&D drive innovation, resulting in the development of advanced switching technologies and software-defined networking (SDN) solutions.
Fabric Data Center Industry Industry Trends & Insights
The Fabric Data Center industry is experiencing robust growth, fueled by several converging forces. The explosive adoption of cloud computing and the insatiable demand for high-bandwidth, low-latency networks are primary drivers. The ongoing migration towards software-defined data centers (SDDCs) is accelerating market expansion, enabling unprecedented agility and operational efficiency. Disruptive technologies, such as the proliferation of 5G and the Internet of Things (IoT), are creating a wealth of new opportunities for fabric data center solutions. Furthermore, evolving consumer preferences are demanding more flexible, scalable, and secure solutions, prompting the increased adoption of advanced technologies like artificial intelligence (AI) and machine learning (ML) for proactive network management and optimization. The intense competition among vendors fosters continuous innovation and cost reductions, ultimately benefiting end-users. Market penetration of fabric data center solutions across diverse sectors is steadily increasing, with a projected significant expansion in market share by 2033. This growth is further driven by the increasing need for efficient resource utilization and reduced operational costs in data centers worldwide.
Dominant Markets & Segments in Fabric Data Center Industry
The North American region currently dominates the Fabric Data Center market, driven by robust IT infrastructure investment and the presence of major technology players. However, the Asia-Pacific region is poised for significant growth due to rapid digital transformation across various sectors.
By Solution:
- Switches: This segment holds the largest market share, driven by the growing demand for high-speed connectivity and network scalability.
- Routers: This segment is experiencing moderate growth, propelled by the increasing adoption of software-defined networking (SDN).
- Storage Area Networking (SAN): The SAN segment is witnessing steady growth, driven by the increasing demand for data storage and management solutions.
By Application:
- IT & Communication: This application segment dominates the market due to the large-scale adoption of data centers by IT and telecom companies.
- Banking & Financial Services: This segment is exhibiting significant growth driven by the increasing reliance on advanced technology and high security requirements.
By End User:
- Cloud Service Providers: This segment is a key driver of growth, with leading cloud providers investing heavily in fabric data center infrastructure.
- Telecom Service Providers: This segment contributes significantly to the market’s expansion due to the rising demand for high-bandwidth services and 5G network deployments.
Key drivers for regional dominance include robust economic policies promoting technological advancements, well-developed IT infrastructure, and significant investments in data center development.
Fabric Data Center Industry Product Innovations
Recent innovations in the Fabric Data Center industry are focused on significantly enhancing network performance, scalability, security, and overall efficiency. This includes the development of cutting-edge switching technologies, sophisticated software-defined networking (SDN) solutions, and intelligent, AI-powered network management tools. These advancements improve operational efficiency, reduce total cost of ownership (TCO), and deliver a superior user experience. A notable trend is the increasing adoption of virtualization and automation, enabling greater agility and scalability for data center operations. Products are increasingly incorporating AI and ML capabilities for predictive analytics, automated troubleshooting, and proactive resource optimization, resulting in minimized downtime and improved resource utilization. The focus is shifting towards solutions that provide greater resilience, enhanced security features, and simplified management.
Report Segmentation & Scope
This report segments the Fabric Data Center market across multiple key dimensions, including solution type (Routers, Switches, Storage Area Networking, and Other Solutions), application (IT & Communication, Banking & Financial Services, Healthcare, Retail, and Other Applications), and end-user (Cloud Service Providers, Telecom Service Providers, and Enterprise Data Centers). A detailed analysis of each segment's growth projection, market size, and competitive landscape is provided. For instance, the Switches segment is projected to experience substantial growth during the forecast period, driven by the escalating demand for high-speed, low-latency connectivity essential for modern applications and workloads.
Key Drivers of Fabric Data Center Industry Growth
Several key factors drive the growth of the Fabric Data Center industry. The increasing adoption of cloud computing and the rise of big data are significant drivers, demanding robust and scalable networking infrastructure. Government initiatives promoting digital transformation and investments in 5G and IoT technologies also fuel market expansion. Furthermore, the growing need for enhanced security and network resilience drives investments in advanced fabric data center solutions.
Challenges in the Fabric Data Center Industry Sector
The Fabric Data Center industry faces challenges such as the complexity of implementing and managing large-scale fabric networks, the need for skilled professionals, and the high initial investment costs. Competition from alternative technologies and evolving regulatory landscapes also pose challenges. Supply chain disruptions, particularly in the procurement of essential components, can impact production and delivery timelines. These challenges lead to increased operational costs and potential delays in project deployments. The total estimated impact of these challenges on industry growth is approximately xx Million annually.
Leading Players in the Fabric Data Center Industry Market
- IBM Corporation
- Alcatel-Lucent Holdings Inc
- Unisys Corporation
- Cisco Systems Inc
- Avaya Inc
- Extreme Networks Inc
- Dell Inc
- Huawei Technologies Co Ltd
- Hewlett-Packard Enterprise Company
- Oracle Corporation
- Brocade Communications Systems
Key Developments in Fabric Data Center Industry Sector
- July 2023: Huawei's announcement of three innovative data center facility solutions, including the next-generation indirect evaporative cooling solution EHU and the mobile intelligent management solution iManager-M, demonstrates a strong push towards more energy-efficient and manageable data centers. This is impacting market competition and significantly enhancing solution offerings, setting a new benchmark for data center sustainability.
- December 2022: The selection of Nokia's 7220 IXR routers for a large-scale data center deployment underscores the growing adoption of advanced routing technologies for building high-performance fabric data centers. This highlights a shift towards sophisticated, high-capacity networking solutions and influences the market share among networking equipment vendors.
- October 2022: Cloudera's announcement of new hybrid data capabilities enhances data migration and management, indirectly boosting the demand for scalable and adaptable fabric data center solutions. This development reflects the ongoing trend towards hybrid cloud environments and influences the development of compatible, flexible infrastructure solutions.
Strategic Fabric Data Center Industry Market Outlook
The Fabric Data Center industry is poised for sustained growth, driven by the increasing demand for high-performance computing, cloud adoption, and the expansion of 5G networks. Strategic opportunities exist in developing innovative solutions that address the challenges of managing complex and large-scale data center environments. Focus on improving energy efficiency, enhancing security, and simplifying operations will be crucial for success in this dynamic market. The integration of AI and ML capabilities into fabric data center solutions presents a significant avenue for future growth and differentiation.
Fabric Data Center Industry Segmentation
-
1. Solution
- 1.1. Router
- 1.2. Switches
- 1.3. Storage Area Networking
- 1.4. Other Solutions
-
2. Application
- 2.1. IT & Communication
- 2.2. Banking & Financial Services
- 2.3. Healthcare
- 2.4. Retail
- 2.5. Other Applications
-
3. End User
- 3.1. Cloud Service Providers
- 3.2. Telecom Service Providers
Fabric Data Center Industry Segmentation By Geography
- 1. North America
- 2. Europe
- 3. Asia Pacific
- 4. Latin America
- 5. Middle East
Fabric Data Center Industry REPORT HIGHLIGHTS
| Aspects | Details |
|---|---|
| Study Period | 2019-2033 |
| Base Year | 2024 |
| Estimated Year | 2025 |
| Forecast Period | 2025-2033 |
| Historical Period | 2019-2024 |
| Growth Rate | CAGR of 28.90% from 2019-2033 |
| Segmentation |
|
Table of Contents
- 1. Introduction
- 1.1. Research Scope
- 1.2. Market Segmentation
- 1.3. Research Methodology
- 1.4. Definitions and Assumptions
- 2. Executive Summary
- 2.1. Introduction
- 3. Market Dynamics
- 3.1. Introduction
- 3.2. Market Drivers
- 3.2.1. Increasing Demand for Data Storage and Adoption of Cloud Computing; Need for High Speed Data Transfer; Increasing Demand of Fabric Switches
- 3.3. Market Restrains
- 3.3.1. Security issues
- 3.4. Market Trends
- 3.4.1. Increasing Demand of Fabric Switches is Driving the Market
- 4. Market Factor Analysis
- 4.1. Porters Five Forces
- 4.2. Supply/Value Chain
- 4.3. PESTEL analysis
- 4.4. Market Entropy
- 4.5. Patent/Trademark Analysis
- 5. Global Fabric Data Center Industry Analysis, Insights and Forecast, 2019-2031
- 5.1. Market Analysis, Insights and Forecast - by Solution
- 5.1.1. Router
- 5.1.2. Switches
- 5.1.3. Storage Area Networking
- 5.1.4. Other Solutions
- 5.2. Market Analysis, Insights and Forecast - by Application
- 5.2.1. IT & Communication
- 5.2.2. Banking & Financial Services
- 5.2.3. Healthcare
- 5.2.4. Retail
- 5.2.5. Other Applications
- 5.3. Market Analysis, Insights and Forecast - by End User
- 5.3.1. Cloud Service Providers
- 5.3.2. Telecom Service Providers
- 5.4. Market Analysis, Insights and Forecast - by Region
- 5.4.1. North America
- 5.4.2. Europe
- 5.4.3. Asia Pacific
- 5.4.4. Latin America
- 5.4.5. Middle East
- 5.1. Market Analysis, Insights and Forecast - by Solution
- 6. North America Fabric Data Center Industry Analysis, Insights and Forecast, 2019-2031
- 6.1. Market Analysis, Insights and Forecast - by Solution
- 6.1.1. Router
- 6.1.2. Switches
- 6.1.3. Storage Area Networking
- 6.1.4. Other Solutions
- 6.2. Market Analysis, Insights and Forecast - by Application
- 6.2.1. IT & Communication
- 6.2.2. Banking & Financial Services
- 6.2.3. Healthcare
- 6.2.4. Retail
- 6.2.5. Other Applications
- 6.3. Market Analysis, Insights and Forecast - by End User
- 6.3.1. Cloud Service Providers
- 6.3.2. Telecom Service Providers
- 6.1. Market Analysis, Insights and Forecast - by Solution
- 7. Europe Fabric Data Center Industry Analysis, Insights and Forecast, 2019-2031
- 7.1. Market Analysis, Insights and Forecast - by Solution
- 7.1.1. Router
- 7.1.2. Switches
- 7.1.3. Storage Area Networking
- 7.1.4. Other Solutions
- 7.2. Market Analysis, Insights and Forecast - by Application
- 7.2.1. IT & Communication
- 7.2.2. Banking & Financial Services
- 7.2.3. Healthcare
- 7.2.4. Retail
- 7.2.5. Other Applications
- 7.3. Market Analysis, Insights and Forecast - by End User
- 7.3.1. Cloud Service Providers
- 7.3.2. Telecom Service Providers
- 7.1. Market Analysis, Insights and Forecast - by Solution
- 8. Asia Pacific Fabric Data Center Industry Analysis, Insights and Forecast, 2019-2031
- 8.1. Market Analysis, Insights and Forecast - by Solution
- 8.1.1. Router
- 8.1.2. Switches
- 8.1.3. Storage Area Networking
- 8.1.4. Other Solutions
- 8.2. Market Analysis, Insights and Forecast - by Application
- 8.2.1. IT & Communication
- 8.2.2. Banking & Financial Services
- 8.2.3. Healthcare
- 8.2.4. Retail
- 8.2.5. Other Applications
- 8.3. Market Analysis, Insights and Forecast - by End User
- 8.3.1. Cloud Service Providers
- 8.3.2. Telecom Service Providers
- 8.1. Market Analysis, Insights and Forecast - by Solution
- 9. Latin America Fabric Data Center Industry Analysis, Insights and Forecast, 2019-2031
- 9.1. Market Analysis, Insights and Forecast - by Solution
- 9.1.1. Router
- 9.1.2. Switches
- 9.1.3. Storage Area Networking
- 9.1.4. Other Solutions
- 9.2. Market Analysis, Insights and Forecast - by Application
- 9.2.1. IT & Communication
- 9.2.2. Banking & Financial Services
- 9.2.3. Healthcare
- 9.2.4. Retail
- 9.2.5. Other Applications
- 9.3. Market Analysis, Insights and Forecast - by End User
- 9.3.1. Cloud Service Providers
- 9.3.2. Telecom Service Providers
- 9.1. Market Analysis, Insights and Forecast - by Solution
- 10. Middle East Fabric Data Center Industry Analysis, Insights and Forecast, 2019-2031
- 10.1. Market Analysis, Insights and Forecast - by Solution
- 10.1.1. Router
- 10.1.2. Switches
- 10.1.3. Storage Area Networking
- 10.1.4. Other Solutions
- 10.2. Market Analysis, Insights and Forecast - by Application
- 10.2.1. IT & Communication
- 10.2.2. Banking & Financial Services
- 10.2.3. Healthcare
- 10.2.4. Retail
- 10.2.5. Other Applications
- 10.3. Market Analysis, Insights and Forecast - by End User
- 10.3.1. Cloud Service Providers
- 10.3.2. Telecom Service Providers
- 10.1. Market Analysis, Insights and Forecast - by Solution
- 11. North America Fabric Data Center Industry Analysis, Insights and Forecast, 2019-2031
- 11.1. Market Analysis, Insights and Forecast - By Country/Sub-region
- 11.1.1 United States
- 11.1.2 Canada
- 11.1.3 Mexico
- 12. Europe Fabric Data Center Industry Analysis, Insights and Forecast, 2019-2031
- 12.1. Market Analysis, Insights and Forecast - By Country/Sub-region
- 12.1.1 Germany
- 12.1.2 United Kingdom
- 12.1.3 France
- 12.1.4 Spain
- 12.1.5 Italy
- 12.1.6 Spain
- 12.1.7 Belgium
- 12.1.8 Netherland
- 12.1.9 Nordics
- 12.1.10 Rest of Europe
- 13. Asia Pacific Fabric Data Center Industry Analysis, Insights and Forecast, 2019-2031
- 13.1. Market Analysis, Insights and Forecast - By Country/Sub-region
- 13.1.1 China
- 13.1.2 Japan
- 13.1.3 India
- 13.1.4 South Korea
- 13.1.5 Southeast Asia
- 13.1.6 Australia
- 13.1.7 Indonesia
- 13.1.8 Phillipes
- 13.1.9 Singapore
- 13.1.10 Thailandc
- 13.1.11 Rest of Asia Pacific
- 14. South America Fabric Data Center Industry Analysis, Insights and Forecast, 2019-2031
- 14.1. Market Analysis, Insights and Forecast - By Country/Sub-region
- 14.1.1 Brazil
- 14.1.2 Argentina
- 14.1.3 Peru
- 14.1.4 Chile
- 14.1.5 Colombia
- 14.1.6 Ecuador
- 14.1.7 Venezuela
- 14.1.8 Rest of South America
- 15. North America Fabric Data Center Industry Analysis, Insights and Forecast, 2019-2031
- 15.1. Market Analysis, Insights and Forecast - By Country/Sub-region
- 15.1.1 United States
- 15.1.2 Canada
- 15.1.3 Mexico
- 16. MEA Fabric Data Center Industry Analysis, Insights and Forecast, 2019-2031
- 16.1. Market Analysis, Insights and Forecast - By Country/Sub-region
- 16.1.1 United Arab Emirates
- 16.1.2 Saudi Arabia
- 16.1.3 South Africa
- 16.1.4 Rest of Middle East and Africa
- 17. Competitive Analysis
- 17.1. Global Market Share Analysis 2024
- 17.2. Company Profiles
- 17.2.1 IBM Corporation
- 17.2.1.1. Overview
- 17.2.1.2. Products
- 17.2.1.3. SWOT Analysis
- 17.2.1.4. Recent Developments
- 17.2.1.5. Financials (Based on Availability)
- 17.2.2 Alcatel-Lucent Holdings Inc
- 17.2.2.1. Overview
- 17.2.2.2. Products
- 17.2.2.3. SWOT Analysis
- 17.2.2.4. Recent Developments
- 17.2.2.5. Financials (Based on Availability)
- 17.2.3 Unisys Corporation
- 17.2.3.1. Overview
- 17.2.3.2. Products
- 17.2.3.3. SWOT Analysis
- 17.2.3.4. Recent Developments
- 17.2.3.5. Financials (Based on Availability)
- 17.2.4 Cisco Systems Inc
- 17.2.4.1. Overview
- 17.2.4.2. Products
- 17.2.4.3. SWOT Analysis
- 17.2.4.4. Recent Developments
- 17.2.4.5. Financials (Based on Availability)
- 17.2.5 Avaya Inc
- 17.2.5.1. Overview
- 17.2.5.2. Products
- 17.2.5.3. SWOT Analysis
- 17.2.5.4. Recent Developments
- 17.2.5.5. Financials (Based on Availability)
- 17.2.6 Extreme Networks Inc
- 17.2.6.1. Overview
- 17.2.6.2. Products
- 17.2.6.3. SWOT Analysis
- 17.2.6.4. Recent Developments
- 17.2.6.5. Financials (Based on Availability)
- 17.2.7 Dell Inc
- 17.2.7.1. Overview
- 17.2.7.2. Products
- 17.2.7.3. SWOT Analysis
- 17.2.7.4. Recent Developments
- 17.2.7.5. Financials (Based on Availability)
- 17.2.8 Huawei Technologies Co Ltd
- 17.2.8.1. Overview
- 17.2.8.2. Products
- 17.2.8.3. SWOT Analysis
- 17.2.8.4. Recent Developments
- 17.2.8.5. Financials (Based on Availability)
- 17.2.9 Hewlett-Packard Enterprise Company
- 17.2.9.1. Overview
- 17.2.9.2. Products
- 17.2.9.3. SWOT Analysis
- 17.2.9.4. Recent Developments
- 17.2.9.5. Financials (Based on Availability)
- 17.2.10 Oracle Corporation
- 17.2.10.1. Overview
- 17.2.10.2. Products
- 17.2.10.3. SWOT Analysis
- 17.2.10.4. Recent Developments
- 17.2.10.5. Financials (Based on Availability)
- 17.2.11 Brocade Communications Systems
- 17.2.11.1. Overview
- 17.2.11.2. Products
- 17.2.11.3. SWOT Analysis
- 17.2.11.4. Recent Developments
- 17.2.11.5. Financials (Based on Availability)
- 17.2.1 IBM Corporation
List of Figures
- Figure 1: Global Fabric Data Center Industry Revenue Breakdown (Million, %) by Region 2024 & 2032
- Figure 2: North America Fabric Data Center Industry Revenue (Million), by Country 2024 & 2032
- Figure 3: North America Fabric Data Center Industry Revenue Share (%), by Country 2024 & 2032
- Figure 4: Europe Fabric Data Center Industry Revenue (Million), by Country 2024 & 2032
- Figure 5: Europe Fabric Data Center Industry Revenue Share (%), by Country 2024 & 2032
- Figure 6: Asia Pacific Fabric Data Center Industry Revenue (Million), by Country 2024 & 2032
- Figure 7: Asia Pacific Fabric Data Center Industry Revenue Share (%), by Country 2024 & 2032
- Figure 8: South America Fabric Data Center Industry Revenue (Million), by Country 2024 & 2032
- Figure 9: South America Fabric Data Center Industry Revenue Share (%), by Country 2024 & 2032
- Figure 10: North America Fabric Data Center Industry Revenue (Million), by Country 2024 & 2032
- Figure 11: North America Fabric Data Center Industry Revenue Share (%), by Country 2024 & 2032
- Figure 12: MEA Fabric Data Center Industry Revenue (Million), by Country 2024 & 2032
- Figure 13: MEA Fabric Data Center Industry Revenue Share (%), by Country 2024 & 2032
- Figure 14: North America Fabric Data Center Industry Revenue (Million), by Solution 2024 & 2032
- Figure 15: North America Fabric Data Center Industry Revenue Share (%), by Solution 2024 & 2032
- Figure 16: North America Fabric Data Center Industry Revenue (Million), by Application 2024 & 2032
- Figure 17: North America Fabric Data Center Industry Revenue Share (%), by Application 2024 & 2032
- Figure 18: North America Fabric Data Center Industry Revenue (Million), by End User 2024 & 2032
- Figure 19: North America Fabric Data Center Industry Revenue Share (%), by End User 2024 & 2032
- Figure 20: North America Fabric Data Center Industry Revenue (Million), by Country 2024 & 2032
- Figure 21: North America Fabric Data Center Industry Revenue Share (%), by Country 2024 & 2032
- Figure 22: Europe Fabric Data Center Industry Revenue (Million), by Solution 2024 & 2032
- Figure 23: Europe Fabric Data Center Industry Revenue Share (%), by Solution 2024 & 2032
- Figure 24: Europe Fabric Data Center Industry Revenue (Million), by Application 2024 & 2032
- Figure 25: Europe Fabric Data Center Industry Revenue Share (%), by Application 2024 & 2032
- Figure 26: Europe Fabric Data Center Industry Revenue (Million), by End User 2024 & 2032
- Figure 27: Europe Fabric Data Center Industry Revenue Share (%), by End User 2024 & 2032
- Figure 28: Europe Fabric Data Center Industry Revenue (Million), by Country 2024 & 2032
- Figure 29: Europe Fabric Data Center Industry Revenue Share (%), by Country 2024 & 2032
- Figure 30: Asia Pacific Fabric Data Center Industry Revenue (Million), by Solution 2024 & 2032
- Figure 31: Asia Pacific Fabric Data Center Industry Revenue Share (%), by Solution 2024 & 2032
- Figure 32: Asia Pacific Fabric Data Center Industry Revenue (Million), by Application 2024 & 2032
- Figure 33: Asia Pacific Fabric Data Center Industry Revenue Share (%), by Application 2024 & 2032
- Figure 34: Asia Pacific Fabric Data Center Industry Revenue (Million), by End User 2024 & 2032
- Figure 35: Asia Pacific Fabric Data Center Industry Revenue Share (%), by End User 2024 & 2032
- Figure 36: Asia Pacific Fabric Data Center Industry Revenue (Million), by Country 2024 & 2032
- Figure 37: Asia Pacific Fabric Data Center Industry Revenue Share (%), by Country 2024 & 2032
- Figure 38: Latin America Fabric Data Center Industry Revenue (Million), by Solution 2024 & 2032
- Figure 39: Latin America Fabric Data Center Industry Revenue Share (%), by Solution 2024 & 2032
- Figure 40: Latin America Fabric Data Center Industry Revenue (Million), by Application 2024 & 2032
- Figure 41: Latin America Fabric Data Center Industry Revenue Share (%), by Application 2024 & 2032
- Figure 42: Latin America Fabric Data Center Industry Revenue (Million), by End User 2024 & 2032
- Figure 43: Latin America Fabric Data Center Industry Revenue Share (%), by End User 2024 & 2032
- Figure 44: Latin America Fabric Data Center Industry Revenue (Million), by Country 2024 & 2032
- Figure 45: Latin America Fabric Data Center Industry Revenue Share (%), by Country 2024 & 2032
- Figure 46: Middle East Fabric Data Center Industry Revenue (Million), by Solution 2024 & 2032
- Figure 47: Middle East Fabric Data Center Industry Revenue Share (%), by Solution 2024 & 2032
- Figure 48: Middle East Fabric Data Center Industry Revenue (Million), by Application 2024 & 2032
- Figure 49: Middle East Fabric Data Center Industry Revenue Share (%), by Application 2024 & 2032
- Figure 50: Middle East Fabric Data Center Industry Revenue (Million), by End User 2024 & 2032
- Figure 51: Middle East Fabric Data Center Industry Revenue Share (%), by End User 2024 & 2032
- Figure 52: Middle East Fabric Data Center Industry Revenue (Million), by Country 2024 & 2032
- Figure 53: Middle East Fabric Data Center Industry Revenue Share (%), by Country 2024 & 2032
List of Tables
- Table 1: Global Fabric Data Center Industry Revenue Million Forecast, by Region 2019 & 2032
- Table 2: Global Fabric Data Center Industry Revenue Million Forecast, by Solution 2019 & 2032
- Table 3: Global Fabric Data Center Industry Revenue Million Forecast, by Application 2019 & 2032
- Table 4: Global Fabric Data Center Industry Revenue Million Forecast, by End User 2019 & 2032
- Table 5: Global Fabric Data Center Industry Revenue Million Forecast, by Region 2019 & 2032
- Table 6: Global Fabric Data Center Industry Revenue Million Forecast, by Country 2019 & 2032
- Table 7: United States Fabric Data Center Industry Revenue (Million) Forecast, by Application 2019 & 2032
- Table 8: Canada Fabric Data Center Industry Revenue (Million) Forecast, by Application 2019 & 2032
- Table 9: Mexico Fabric Data Center Industry Revenue (Million) Forecast, by Application 2019 & 2032
- Table 10: Global Fabric Data Center Industry Revenue Million Forecast, by Country 2019 & 2032
- Table 11: Germany Fabric Data Center Industry Revenue (Million) Forecast, by Application 2019 & 2032
- Table 12: United Kingdom Fabric Data Center Industry Revenue (Million) Forecast, by Application 2019 & 2032
- Table 13: France Fabric Data Center Industry Revenue (Million) Forecast, by Application 2019 & 2032
- Table 14: Spain Fabric Data Center Industry Revenue (Million) Forecast, by Application 2019 & 2032
- Table 15: Italy Fabric Data Center Industry Revenue (Million) Forecast, by Application 2019 & 2032
- Table 16: Spain Fabric Data Center Industry Revenue (Million) Forecast, by Application 2019 & 2032
- Table 17: Belgium Fabric Data Center Industry Revenue (Million) Forecast, by Application 2019 & 2032
- Table 18: Netherland Fabric Data Center Industry Revenue (Million) Forecast, by Application 2019 & 2032
- Table 19: Nordics Fabric Data Center Industry Revenue (Million) Forecast, by Application 2019 & 2032
- Table 20: Rest of Europe Fabric Data Center Industry Revenue (Million) Forecast, by Application 2019 & 2032
- Table 21: Global Fabric Data Center Industry Revenue Million Forecast, by Country 2019 & 2032
- Table 22: China Fabric Data Center Industry Revenue (Million) Forecast, by Application 2019 & 2032
- Table 23: Japan Fabric Data Center Industry Revenue (Million) Forecast, by Application 2019 & 2032
- Table 24: India Fabric Data Center Industry Revenue (Million) Forecast, by Application 2019 & 2032
- Table 25: South Korea Fabric Data Center Industry Revenue (Million) Forecast, by Application 2019 & 2032
- Table 26: Southeast Asia Fabric Data Center Industry Revenue (Million) Forecast, by Application 2019 & 2032
- Table 27: Australia Fabric Data Center Industry Revenue (Million) Forecast, by Application 2019 & 2032
- Table 28: Indonesia Fabric Data Center Industry Revenue (Million) Forecast, by Application 2019 & 2032
- Table 29: Phillipes Fabric Data Center Industry Revenue (Million) Forecast, by Application 2019 & 2032
- Table 30: Singapore Fabric Data Center Industry Revenue (Million) Forecast, by Application 2019 & 2032
- Table 31: Thailandc Fabric Data Center Industry Revenue (Million) Forecast, by Application 2019 & 2032
- Table 32: Rest of Asia Pacific Fabric Data Center Industry Revenue (Million) Forecast, by Application 2019 & 2032
- Table 33: Global Fabric Data Center Industry Revenue Million Forecast, by Country 2019 & 2032
- Table 34: Brazil Fabric Data Center Industry Revenue (Million) Forecast, by Application 2019 & 2032
- Table 35: Argentina Fabric Data Center Industry Revenue (Million) Forecast, by Application 2019 & 2032
- Table 36: Peru Fabric Data Center Industry Revenue (Million) Forecast, by Application 2019 & 2032
- Table 37: Chile Fabric Data Center Industry Revenue (Million) Forecast, by Application 2019 & 2032
- Table 38: Colombia Fabric Data Center Industry Revenue (Million) Forecast, by Application 2019 & 2032
- Table 39: Ecuador Fabric Data Center Industry Revenue (Million) Forecast, by Application 2019 & 2032
- Table 40: Venezuela Fabric Data Center Industry Revenue (Million) Forecast, by Application 2019 & 2032
- Table 41: Rest of South America Fabric Data Center Industry Revenue (Million) Forecast, by Application 2019 & 2032
- Table 42: Global Fabric Data Center Industry Revenue Million Forecast, by Country 2019 & 2032
- Table 43: United States Fabric Data Center Industry Revenue (Million) Forecast, by Application 2019 & 2032
- Table 44: Canada Fabric Data Center Industry Revenue (Million) Forecast, by Application 2019 & 2032
- Table 45: Mexico Fabric Data Center Industry Revenue (Million) Forecast, by Application 2019 & 2032
- Table 46: Global Fabric Data Center Industry Revenue Million Forecast, by Country 2019 & 2032
- Table 47: United Arab Emirates Fabric Data Center Industry Revenue (Million) Forecast, by Application 2019 & 2032
- Table 48: Saudi Arabia Fabric Data Center Industry Revenue (Million) Forecast, by Application 2019 & 2032
- Table 49: South Africa Fabric Data Center Industry Revenue (Million) Forecast, by Application 2019 & 2032
- Table 50: Rest of Middle East and Africa Fabric Data Center Industry Revenue (Million) Forecast, by Application 2019 & 2032
- Table 51: Global Fabric Data Center Industry Revenue Million Forecast, by Solution 2019 & 2032
- Table 52: Global Fabric Data Center Industry Revenue Million Forecast, by Application 2019 & 2032
- Table 53: Global Fabric Data Center Industry Revenue Million Forecast, by End User 2019 & 2032
- Table 54: Global Fabric Data Center Industry Revenue Million Forecast, by Country 2019 & 2032
- Table 55: Global Fabric Data Center Industry Revenue Million Forecast, by Solution 2019 & 2032
- Table 56: Global Fabric Data Center Industry Revenue Million Forecast, by Application 2019 & 2032
- Table 57: Global Fabric Data Center Industry Revenue Million Forecast, by End User 2019 & 2032
- Table 58: Global Fabric Data Center Industry Revenue Million Forecast, by Country 2019 & 2032
- Table 59: Global Fabric Data Center Industry Revenue Million Forecast, by Solution 2019 & 2032
- Table 60: Global Fabric Data Center Industry Revenue Million Forecast, by Application 2019 & 2032
- Table 61: Global Fabric Data Center Industry Revenue Million Forecast, by End User 2019 & 2032
- Table 62: Global Fabric Data Center Industry Revenue Million Forecast, by Country 2019 & 2032
- Table 63: Global Fabric Data Center Industry Revenue Million Forecast, by Solution 2019 & 2032
- Table 64: Global Fabric Data Center Industry Revenue Million Forecast, by Application 2019 & 2032
- Table 65: Global Fabric Data Center Industry Revenue Million Forecast, by End User 2019 & 2032
- Table 66: Global Fabric Data Center Industry Revenue Million Forecast, by Country 2019 & 2032
- Table 67: Global Fabric Data Center Industry Revenue Million Forecast, by Solution 2019 & 2032
- Table 68: Global Fabric Data Center Industry Revenue Million Forecast, by Application 2019 & 2032
- Table 69: Global Fabric Data Center Industry Revenue Million Forecast, by End User 2019 & 2032
- Table 70: Global Fabric Data Center Industry Revenue Million Forecast, by Country 2019 & 2032
Frequently Asked Questions
1. What is the projected Compound Annual Growth Rate (CAGR) of the Fabric Data Center Industry?
The projected CAGR is approximately 28.90%.
2. Which companies are prominent players in the Fabric Data Center Industry?
Key companies in the market include IBM Corporation, Alcatel-Lucent Holdings Inc, Unisys Corporation, Cisco Systems Inc, Avaya Inc, Extreme Networks Inc, Dell Inc, Huawei Technologies Co Ltd, Hewlett-Packard Enterprise Company, Oracle Corporation, Brocade Communications Systems.
3. What are the main segments of the Fabric Data Center Industry?
The market segments include Solution, Application, End User.
4. Can you provide details about the market size?
The market size is estimated to be USD 2.31 Million as of 2022.
5. What are some drivers contributing to market growth?
Increasing Demand for Data Storage and Adoption of Cloud Computing; Need for High Speed Data Transfer; Increasing Demand of Fabric Switches.
6. What are the notable trends driving market growth?
Increasing Demand of Fabric Switches is Driving the Market.
7. Are there any restraints impacting market growth?
Security issues.
8. Can you provide examples of recent developments in the market?
July 2023: Huawei's announced three innovative data center facility solutions as unveiled the next-generation indirect evaporative cooling solution EHU and the mobile intelligent management solution iManager-M. These scenario-based data center solutions promise optimal reliability throughout the lifecycle and aim to drive the high-quality development of the data center industry.
9. What pricing options are available for accessing the report?
Pricing options include single-user, multi-user, and enterprise licenses priced at USD 4750, USD 5250, and USD 8750 respectively.
10. Is the market size provided in terms of value or volume?
The market size is provided in terms of value, measured in Million.
11. Are there any specific market keywords associated with the report?
Yes, the market keyword associated with the report is "Fabric Data Center Industry," which aids in identifying and referencing the specific market segment covered.
12. How do I determine which pricing option suits my needs best?
The pricing options vary based on user requirements and access needs. Individual users may opt for single-user licenses, while businesses requiring broader access may choose multi-user or enterprise licenses for cost-effective access to the report.
13. Are there any additional resources or data provided in the Fabric Data Center Industry report?
While the report offers comprehensive insights, it's advisable to review the specific contents or supplementary materials provided to ascertain if additional resources or data are available.
14. How can I stay updated on further developments or reports in the Fabric Data Center Industry?
To stay informed about further developments, trends, and reports in the Fabric Data Center Industry, consider subscribing to industry newsletters, following relevant companies and organizations, or regularly checking reputable industry news sources and publications.
Methodology
Step 1 - Identification of Relevant Samples Size from Population Database


Step 2 - Approaches for Defining Global Market Size (Value, Volume* & Price*)

Note*: In applicable scenarios
Step 3 - Data Sources
Primary Research
- Web Analytics
- Survey Reports
- Research Institute
- Latest Research Reports
- Opinion Leaders
Secondary Research
- Annual Reports
- White Paper
- Latest Press Release
- Industry Association
- Paid Database
- Investor Presentations

Step 4 - Data Triangulation
Involves using different sources of information in order to increase the validity of a study
These sources are likely to be stakeholders in a program - participants, other researchers, program staff, other community members, and so on.
Then we put all data in single framework & apply various statistical tools to find out the dynamic on the market.
During the analysis stage, feedback from the stakeholder groups would be compared to determine areas of agreement as well as areas of divergence


