
Key Insights
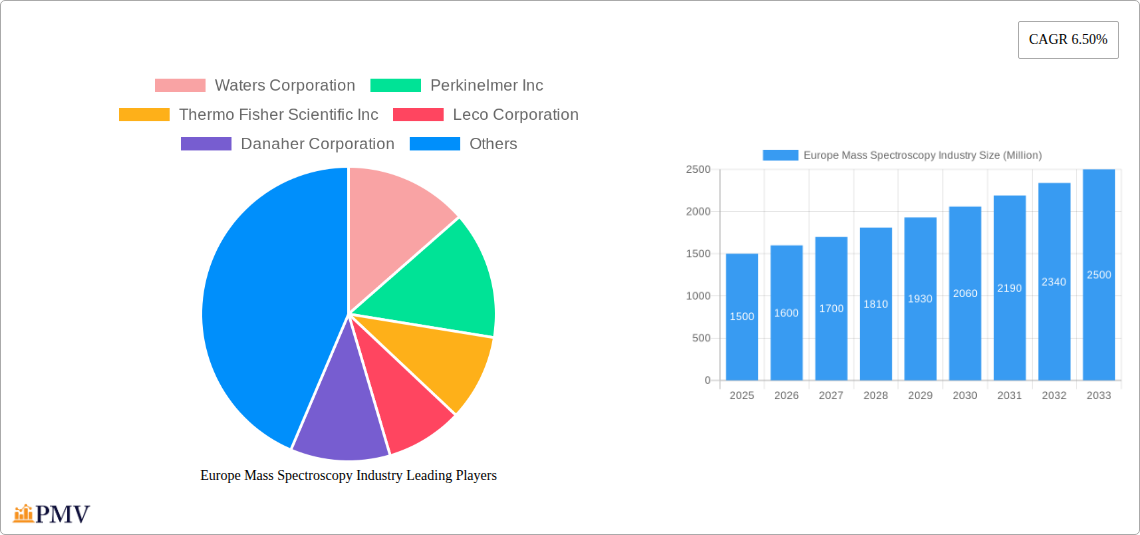
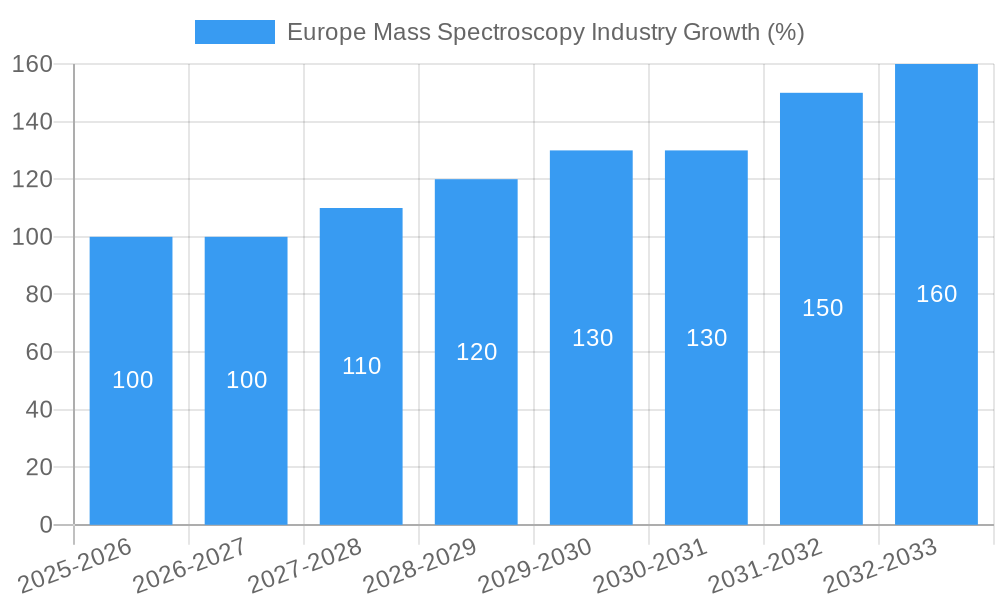
The European mass spectrometry market, valued at approximately €1.5 billion in 2025, is projected to experience robust growth, exhibiting a Compound Annual Growth Rate (CAGR) of 6.5% from 2025 to 2033. This expansion is driven primarily by the pharmaceutical and biotechnology industries' increasing reliance on advanced analytical techniques for drug discovery, development, and quality control. The rising prevalence of chronic diseases and the consequent surge in demand for innovative therapeutics are major contributing factors. Furthermore, technological advancements within mass spectrometry, such as the development of more sensitive and higher-throughput instruments like Hybrid Mass Spectrometry and FTMS, are fueling market growth. The adoption of these sophisticated technologies enables faster and more precise analysis, leading to improved efficiency and reduced costs across various applications. Germany, France, and the United Kingdom are expected to remain the leading markets within Europe, fueled by robust research infrastructure and substantial investments in life sciences.
However, the market's growth is not without constraints. High initial investment costs associated with advanced mass spectrometry systems can pose a significant barrier to entry for smaller laboratories and research institutions. Furthermore, the need for highly skilled personnel to operate and maintain these complex instruments presents a potential challenge. Despite these limitations, the overall market outlook remains positive, propelled by continuous technological innovations, increased funding for research and development, and the growing importance of mass spectrometry in various sectors beyond pharmaceuticals and biotechnology, including environmental monitoring and food safety. The continued development and adoption of miniaturized and more user-friendly mass spectrometry systems will likely mitigate some of the current challenges and expand the market's reach in the coming years.
Europe Mass Spectroscopy Industry: A Comprehensive Market Report (2019-2033)
This detailed report provides a comprehensive analysis of the Europe Mass Spectroscopy industry, covering market structure, competitive dynamics, technological advancements, and future growth prospects. The study period spans from 2019 to 2033, with 2025 serving as the base and estimated year. The report offers actionable insights for stakeholders, including manufacturers, investors, and researchers. The market is segmented by technology (Hybrid Mass Spectrometry, FTMS, Time-of-flight, and Other Mass Spectrometry) and application (Pharmaceuticals, Biotechnology, Chemical, and Other Applications). Key players analyzed include Waters Corporation, Perkinelmer Inc, Thermo Fisher Scientific Inc, Leco Corporation, Danaher Corporation, Agilent Technologies Inc, Dani Instruments SpA, Bruker Corporation, and Shimadzu Corporation. The report projects a market value of XX Million by 2033, with a CAGR of XX% during the forecast period (2025-2033).
Europe Mass Spectroscopy Industry Market Structure & Competitive Dynamics
The European Mass Spectroscopy market exhibits a moderately concentrated structure, with a few dominant players holding significant market share. Thermo Fisher Scientific, Waters Corporation, and Agilent Technologies collectively account for approximately 60% of the market. The industry features a dynamic innovation ecosystem, with continuous advancements in mass spectrometry technologies driving market growth. Stringent regulatory frameworks, particularly concerning data privacy and safety standards within the pharmaceutical and biotechnology sectors, significantly influence market operations. Product substitutes, such as chromatography techniques, pose competitive challenges, though mass spectrometry retains a strong advantage in its sensitivity and versatility. End-user trends reveal increasing demand for high-throughput, automated systems, pushing manufacturers to innovate in this direction. Mergers and acquisitions (M&A) activity has been moderate but notable. For instance, Bruker's acquisition of IonSense in 2022 significantly expanded their ambient ionization capabilities. The total value of M&A deals in the period 2019-2024 is estimated at XX Million.
- Market Concentration: Oligopolistic, with top 3 players holding ~60% market share.
- Innovation Ecosystem: High, with continuous development of new technologies and software.
- Regulatory Landscape: Stringent, influencing market access and operations.
- M&A Activity: Moderate, with significant deals impacting market dynamics (e.g., Bruker’s acquisition of IonSense).
- Key Substitutes: Chromatography techniques.
- End-user Trends: Demand for high-throughput and automated systems is increasing.
Europe Mass Spectroscopy Industry Industry Trends & Insights
The European Mass Spectroscopy market is experiencing robust growth, driven by several factors. The increasing prevalence of chronic diseases is fueling demand for advanced diagnostic tools in the pharmaceutical and biotechnology sectors. The rising adoption of mass spectrometry in various applications, such as proteomics, metabolomics, and environmental monitoring, is also contributing to market expansion. Technological advancements, such as the development of miniaturized and portable mass spectrometers, are enhancing accessibility and affordability. However, the high cost of instruments and maintenance can hinder market penetration, particularly in smaller laboratories. Consumer preferences are shifting towards solutions that offer improved sensitivity, speed, and ease of use. The competitive landscape remains highly dynamic, with leading players focusing on product innovation, strategic partnerships, and acquisitions to maintain their market positions. The market is projected to witness a compound annual growth rate (CAGR) of XX% from 2025 to 2033, reaching a value of XX Million by 2033. Market penetration of hybrid mass spectrometry systems is expected to reach XX% by 2033.
Dominant Markets & Segments in Europe Mass Spectroscopy Industry
The German market currently holds the largest share in the European mass spectroscopy industry, driven by a robust pharmaceutical and biotechnology sector, coupled with substantial government funding for research and development. Within technology segments, Hybrid Mass Spectrometry dominates due to its versatility and superior performance. In applications, the Pharmaceuticals Industry is the largest segment, owing to its widespread use in drug discovery, development, and quality control.
- Leading Region: Germany
- Key Drivers for Germany: Strong pharmaceutical and biotech sector, substantial R&D funding.
- Dominant Technology Segment: Hybrid Mass Spectrometry (versatility and superior performance)
- Dominant Application Segment: Pharmaceuticals Industry (drug discovery, development, quality control)
- Other Key Countries: United Kingdom, France, Switzerland, and the Netherlands.
Europe Mass Spectroscopy Industry Product Innovations
Recent years have witnessed significant advancements in mass spectrometry technologies. Hybrid instruments combine the strengths of different mass analyzer types, providing enhanced performance. Miniaturization and improved software are making mass spectrometry more accessible and user-friendly. Innovations in ionization techniques, such as ambient ionization, are expanding the range of analytes that can be analyzed. These developments have broadened the applications of mass spectrometry across various industries, including environmental monitoring and food safety.
Report Segmentation & Scope
This report segments the European Mass Spectroscopy market by technology and application. Technology segments include Hybrid Mass Spectrometry (projected growth of XX% from 2025-2033, market size of XX Million in 2025), FTMS (XX% growth, XX Million in 2025), Time-of-flight (XX% growth, XX Million in 2025), and Other Mass Spectrometry (XX% growth, XX Million in 2025). Application segments include Pharmaceuticals (largest segment, XX Million in 2025, XX% growth), Biotechnology (XX Million in 2025, XX% growth), Chemical (XX Million in 2025, XX% growth), and Other Applications (XX Million in 2025, XX% growth). Each segment’s competitive landscape is analyzed, highlighting key players and their market strategies.
Key Drivers of Europe Mass Spectroscopy Industry Growth
The growth of the European Mass Spectroscopy market is primarily driven by technological advancements, increasing healthcare spending, and rising demand for improved diagnostics. The development of high-throughput, sensitive, and user-friendly mass spectrometers is significantly expanding its applications. Government funding for research and development in life sciences also plays a crucial role. Regulatory changes encouraging the adoption of advanced analytical techniques further stimulate market growth.
Challenges in the Europe Mass Spectroscopy Industry Sector
The Europe Mass Spectroscopy industry faces challenges such as the high cost of instruments and maintenance, which can limit accessibility, especially for smaller laboratories. The complex regulatory environment and stringent safety standards also pose hurdles. Competition from alternative analytical techniques, such as chromatography, puts pressure on market share. Supply chain disruptions can impact instrument availability and cost. These factors collectively influence market growth dynamics.
Leading Players in the Europe Mass Spectroscopy Industry Market
- Waters Corporation
- Perkinelmer Inc
- Thermo Fisher Scientific Inc
- Leco Corporation
- Danaher Corporation
- Agilent Technologies Inc
- Dani Instruments SpA
- Bruker Corporation
- Shimadzu Corporation
Key Developments in Europe Mass Spectroscopy Industry Sector
- June 2022: Waters Corporation launched new instruments, software, and product enhancements to boost drug discovery and development, enhancing its market position.
- April 2022: Bruker's acquisition of IonSense expanded its capabilities in ambient ionization, broadening its market reach and product offerings.
Strategic Europe Mass Spectroscopy Industry Market Outlook
The future of the European Mass Spectroscopy market appears promising, driven by ongoing technological innovations, expanding applications, and increasing demand across various sectors. Strategic opportunities lie in developing cost-effective and user-friendly instruments, focusing on specialized applications, and exploring partnerships to expand market access. The market is poised for significant growth, with substantial potential for companies that can effectively leverage technological advancements and meet the evolving needs of end-users.
Europe Mass Spectroscopy Industry Segmentation
-
1. Technology
-
1.1. Hybrid Mass Spectrometry
- 1.1.1. Triple Quadrupole (Tandem)
- 1.1.2. Quadrupole TOF (Q-TOF)
- 1.1.3. FTMS (Fourier Transform Mass Spectrometry)
-
1.2. Single Mass Spectrometry
- 1.2.1. ION Trap
- 1.2.2. Time-of-flight (TOF)
- 1.3. Other Mass Spectrometry
-
1.1. Hybrid Mass Spectrometry
-
2. Application
- 2.1. Pharmaceuticals Industry
- 2.2. Biotechnology Industry
- 2.3. Chemical Industry
- 2.4. Other Applications
Europe Mass Spectroscopy Industry Segmentation By Geography
- 1. Germany
- 2. United Kingdom
- 3. France
- 4. Italy
- 5. Spain
- 6. Rest of Europe
Europe Mass Spectroscopy Industry REPORT HIGHLIGHTS
| Aspects | Details |
|---|---|
| Study Period | 2019-2033 |
| Base Year | 2024 |
| Estimated Year | 2025 |
| Forecast Period | 2025-2033 |
| Historical Period | 2019-2024 |
| Growth Rate | CAGR of 6.50% from 2019-2033 |
| Segmentation |
|
Table of Contents
- 1. Introduction
- 1.1. Research Scope
- 1.2. Market Segmentation
- 1.3. Research Methodology
- 1.4. Definitions and Assumptions
- 2. Executive Summary
- 2.1. Introduction
- 3. Market Dynamics
- 3.1. Introduction
- 3.2. Market Drivers
- 3.2.1. Increasing Technological Advancement; Increased Pharmaceutical and Biotechnological Compounds in Pipeline
- 3.3. Market Restrains
- 3.3.1. High Cost of Instrument; Shortage of Skilled Technicians
- 3.4. Market Trends
- 3.4.1. Triple Quadrupole (Tandem Mass Spectrometry Devices) Segment is Expected to Dominate the Market over the Forecast Period
- 4. Market Factor Analysis
- 4.1. Porters Five Forces
- 4.2. Supply/Value Chain
- 4.3. PESTEL analysis
- 4.4. Market Entropy
- 4.5. Patent/Trademark Analysis
- 5. Europe Mass Spectroscopy Industry Analysis, Insights and Forecast, 2019-2031
- 5.1. Market Analysis, Insights and Forecast - by Technology
- 5.1.1. Hybrid Mass Spectrometry
- 5.1.1.1. Triple Quadrupole (Tandem)
- 5.1.1.2. Quadrupole TOF (Q-TOF)
- 5.1.1.3. FTMS (Fourier Transform Mass Spectrometry)
- 5.1.2. Single Mass Spectrometry
- 5.1.2.1. ION Trap
- 5.1.2.2. Time-of-flight (TOF)
- 5.1.3. Other Mass Spectrometry
- 5.1.1. Hybrid Mass Spectrometry
- 5.2. Market Analysis, Insights and Forecast - by Application
- 5.2.1. Pharmaceuticals Industry
- 5.2.2. Biotechnology Industry
- 5.2.3. Chemical Industry
- 5.2.4. Other Applications
- 5.3. Market Analysis, Insights and Forecast - by Region
- 5.3.1. Germany
- 5.3.2. United Kingdom
- 5.3.3. France
- 5.3.4. Italy
- 5.3.5. Spain
- 5.3.6. Rest of Europe
- 5.1. Market Analysis, Insights and Forecast - by Technology
- 6. Germany Europe Mass Spectroscopy Industry Analysis, Insights and Forecast, 2019-2031
- 6.1. Market Analysis, Insights and Forecast - by Technology
- 6.1.1. Hybrid Mass Spectrometry
- 6.1.1.1. Triple Quadrupole (Tandem)
- 6.1.1.2. Quadrupole TOF (Q-TOF)
- 6.1.1.3. FTMS (Fourier Transform Mass Spectrometry)
- 6.1.2. Single Mass Spectrometry
- 6.1.2.1. ION Trap
- 6.1.2.2. Time-of-flight (TOF)
- 6.1.3. Other Mass Spectrometry
- 6.1.1. Hybrid Mass Spectrometry
- 6.2. Market Analysis, Insights and Forecast - by Application
- 6.2.1. Pharmaceuticals Industry
- 6.2.2. Biotechnology Industry
- 6.2.3. Chemical Industry
- 6.2.4. Other Applications
- 6.1. Market Analysis, Insights and Forecast - by Technology
- 7. United Kingdom Europe Mass Spectroscopy Industry Analysis, Insights and Forecast, 2019-2031
- 7.1. Market Analysis, Insights and Forecast - by Technology
- 7.1.1. Hybrid Mass Spectrometry
- 7.1.1.1. Triple Quadrupole (Tandem)
- 7.1.1.2. Quadrupole TOF (Q-TOF)
- 7.1.1.3. FTMS (Fourier Transform Mass Spectrometry)
- 7.1.2. Single Mass Spectrometry
- 7.1.2.1. ION Trap
- 7.1.2.2. Time-of-flight (TOF)
- 7.1.3. Other Mass Spectrometry
- 7.1.1. Hybrid Mass Spectrometry
- 7.2. Market Analysis, Insights and Forecast - by Application
- 7.2.1. Pharmaceuticals Industry
- 7.2.2. Biotechnology Industry
- 7.2.3. Chemical Industry
- 7.2.4. Other Applications
- 7.1. Market Analysis, Insights and Forecast - by Technology
- 8. France Europe Mass Spectroscopy Industry Analysis, Insights and Forecast, 2019-2031
- 8.1. Market Analysis, Insights and Forecast - by Technology
- 8.1.1. Hybrid Mass Spectrometry
- 8.1.1.1. Triple Quadrupole (Tandem)
- 8.1.1.2. Quadrupole TOF (Q-TOF)
- 8.1.1.3. FTMS (Fourier Transform Mass Spectrometry)
- 8.1.2. Single Mass Spectrometry
- 8.1.2.1. ION Trap
- 8.1.2.2. Time-of-flight (TOF)
- 8.1.3. Other Mass Spectrometry
- 8.1.1. Hybrid Mass Spectrometry
- 8.2. Market Analysis, Insights and Forecast - by Application
- 8.2.1. Pharmaceuticals Industry
- 8.2.2. Biotechnology Industry
- 8.2.3. Chemical Industry
- 8.2.4. Other Applications
- 8.1. Market Analysis, Insights and Forecast - by Technology
- 9. Italy Europe Mass Spectroscopy Industry Analysis, Insights and Forecast, 2019-2031
- 9.1. Market Analysis, Insights and Forecast - by Technology
- 9.1.1. Hybrid Mass Spectrometry
- 9.1.1.1. Triple Quadrupole (Tandem)
- 9.1.1.2. Quadrupole TOF (Q-TOF)
- 9.1.1.3. FTMS (Fourier Transform Mass Spectrometry)
- 9.1.2. Single Mass Spectrometry
- 9.1.2.1. ION Trap
- 9.1.2.2. Time-of-flight (TOF)
- 9.1.3. Other Mass Spectrometry
- 9.1.1. Hybrid Mass Spectrometry
- 9.2. Market Analysis, Insights and Forecast - by Application
- 9.2.1. Pharmaceuticals Industry
- 9.2.2. Biotechnology Industry
- 9.2.3. Chemical Industry
- 9.2.4. Other Applications
- 9.1. Market Analysis, Insights and Forecast - by Technology
- 10. Spain Europe Mass Spectroscopy Industry Analysis, Insights and Forecast, 2019-2031
- 10.1. Market Analysis, Insights and Forecast - by Technology
- 10.1.1. Hybrid Mass Spectrometry
- 10.1.1.1. Triple Quadrupole (Tandem)
- 10.1.1.2. Quadrupole TOF (Q-TOF)
- 10.1.1.3. FTMS (Fourier Transform Mass Spectrometry)
- 10.1.2. Single Mass Spectrometry
- 10.1.2.1. ION Trap
- 10.1.2.2. Time-of-flight (TOF)
- 10.1.3. Other Mass Spectrometry
- 10.1.1. Hybrid Mass Spectrometry
- 10.2. Market Analysis, Insights and Forecast - by Application
- 10.2.1. Pharmaceuticals Industry
- 10.2.2. Biotechnology Industry
- 10.2.3. Chemical Industry
- 10.2.4. Other Applications
- 10.1. Market Analysis, Insights and Forecast - by Technology
- 11. Rest of Europe Europe Mass Spectroscopy Industry Analysis, Insights and Forecast, 2019-2031
- 11.1. Market Analysis, Insights and Forecast - by Technology
- 11.1.1. Hybrid Mass Spectrometry
- 11.1.1.1. Triple Quadrupole (Tandem)
- 11.1.1.2. Quadrupole TOF (Q-TOF)
- 11.1.1.3. FTMS (Fourier Transform Mass Spectrometry)
- 11.1.2. Single Mass Spectrometry
- 11.1.2.1. ION Trap
- 11.1.2.2. Time-of-flight (TOF)
- 11.1.3. Other Mass Spectrometry
- 11.1.1. Hybrid Mass Spectrometry
- 11.2. Market Analysis, Insights and Forecast - by Application
- 11.2.1. Pharmaceuticals Industry
- 11.2.2. Biotechnology Industry
- 11.2.3. Chemical Industry
- 11.2.4. Other Applications
- 11.1. Market Analysis, Insights and Forecast - by Technology
- 12. Germany Europe Mass Spectroscopy Industry Analysis, Insights and Forecast, 2019-2031
- 13. France Europe Mass Spectroscopy Industry Analysis, Insights and Forecast, 2019-2031
- 14. Italy Europe Mass Spectroscopy Industry Analysis, Insights and Forecast, 2019-2031
- 15. United Kingdom Europe Mass Spectroscopy Industry Analysis, Insights and Forecast, 2019-2031
- 16. Netherlands Europe Mass Spectroscopy Industry Analysis, Insights and Forecast, 2019-2031
- 17. Sweden Europe Mass Spectroscopy Industry Analysis, Insights and Forecast, 2019-2031
- 18. Rest of Europe Europe Mass Spectroscopy Industry Analysis, Insights and Forecast, 2019-2031
- 19. Competitive Analysis
- 19.1. Market Share Analysis 2024
- 19.2. Company Profiles
- 19.2.1 Waters Corporation
- 19.2.1.1. Overview
- 19.2.1.2. Products
- 19.2.1.3. SWOT Analysis
- 19.2.1.4. Recent Developments
- 19.2.1.5. Financials (Based on Availability)
- 19.2.2 Perkinelmer Inc
- 19.2.2.1. Overview
- 19.2.2.2. Products
- 19.2.2.3. SWOT Analysis
- 19.2.2.4. Recent Developments
- 19.2.2.5. Financials (Based on Availability)
- 19.2.3 Thermo Fisher Scientific Inc
- 19.2.3.1. Overview
- 19.2.3.2. Products
- 19.2.3.3. SWOT Analysis
- 19.2.3.4. Recent Developments
- 19.2.3.5. Financials (Based on Availability)
- 19.2.4 Leco Corporation
- 19.2.4.1. Overview
- 19.2.4.2. Products
- 19.2.4.3. SWOT Analysis
- 19.2.4.4. Recent Developments
- 19.2.4.5. Financials (Based on Availability)
- 19.2.5 Danaher Corporation
- 19.2.5.1. Overview
- 19.2.5.2. Products
- 19.2.5.3. SWOT Analysis
- 19.2.5.4. Recent Developments
- 19.2.5.5. Financials (Based on Availability)
- 19.2.6 Agilent Technologies Inc
- 19.2.6.1. Overview
- 19.2.6.2. Products
- 19.2.6.3. SWOT Analysis
- 19.2.6.4. Recent Developments
- 19.2.6.5. Financials (Based on Availability)
- 19.2.7 Dani Instruments SpA
- 19.2.7.1. Overview
- 19.2.7.2. Products
- 19.2.7.3. SWOT Analysis
- 19.2.7.4. Recent Developments
- 19.2.7.5. Financials (Based on Availability)
- 19.2.8 Bruker Corporation
- 19.2.8.1. Overview
- 19.2.8.2. Products
- 19.2.8.3. SWOT Analysis
- 19.2.8.4. Recent Developments
- 19.2.8.5. Financials (Based on Availability)
- 19.2.9 Shimadzu Corporation
- 19.2.9.1. Overview
- 19.2.9.2. Products
- 19.2.9.3. SWOT Analysis
- 19.2.9.4. Recent Developments
- 19.2.9.5. Financials (Based on Availability)
- 19.2.1 Waters Corporation
List of Figures
- Figure 1: Europe Mass Spectroscopy Industry Revenue Breakdown (Million, %) by Product 2024 & 2032
- Figure 2: Europe Mass Spectroscopy Industry Share (%) by Company 2024
List of Tables
- Table 1: Europe Mass Spectroscopy Industry Revenue Million Forecast, by Region 2019 & 2032
- Table 2: Europe Mass Spectroscopy Industry Volume K Unit Forecast, by Region 2019 & 2032
- Table 3: Europe Mass Spectroscopy Industry Revenue Million Forecast, by Technology 2019 & 2032
- Table 4: Europe Mass Spectroscopy Industry Volume K Unit Forecast, by Technology 2019 & 2032
- Table 5: Europe Mass Spectroscopy Industry Revenue Million Forecast, by Application 2019 & 2032
- Table 6: Europe Mass Spectroscopy Industry Volume K Unit Forecast, by Application 2019 & 2032
- Table 7: Europe Mass Spectroscopy Industry Revenue Million Forecast, by Region 2019 & 2032
- Table 8: Europe Mass Spectroscopy Industry Volume K Unit Forecast, by Region 2019 & 2032
- Table 9: Europe Mass Spectroscopy Industry Revenue Million Forecast, by Country 2019 & 2032
- Table 10: Europe Mass Spectroscopy Industry Volume K Unit Forecast, by Country 2019 & 2032
- Table 11: Germany Europe Mass Spectroscopy Industry Revenue (Million) Forecast, by Application 2019 & 2032
- Table 12: Germany Europe Mass Spectroscopy Industry Volume (K Unit) Forecast, by Application 2019 & 2032
- Table 13: France Europe Mass Spectroscopy Industry Revenue (Million) Forecast, by Application 2019 & 2032
- Table 14: France Europe Mass Spectroscopy Industry Volume (K Unit) Forecast, by Application 2019 & 2032
- Table 15: Italy Europe Mass Spectroscopy Industry Revenue (Million) Forecast, by Application 2019 & 2032
- Table 16: Italy Europe Mass Spectroscopy Industry Volume (K Unit) Forecast, by Application 2019 & 2032
- Table 17: United Kingdom Europe Mass Spectroscopy Industry Revenue (Million) Forecast, by Application 2019 & 2032
- Table 18: United Kingdom Europe Mass Spectroscopy Industry Volume (K Unit) Forecast, by Application 2019 & 2032
- Table 19: Netherlands Europe Mass Spectroscopy Industry Revenue (Million) Forecast, by Application 2019 & 2032
- Table 20: Netherlands Europe Mass Spectroscopy Industry Volume (K Unit) Forecast, by Application 2019 & 2032
- Table 21: Sweden Europe Mass Spectroscopy Industry Revenue (Million) Forecast, by Application 2019 & 2032
- Table 22: Sweden Europe Mass Spectroscopy Industry Volume (K Unit) Forecast, by Application 2019 & 2032
- Table 23: Rest of Europe Europe Mass Spectroscopy Industry Revenue (Million) Forecast, by Application 2019 & 2032
- Table 24: Rest of Europe Europe Mass Spectroscopy Industry Volume (K Unit) Forecast, by Application 2019 & 2032
- Table 25: Europe Mass Spectroscopy Industry Revenue Million Forecast, by Technology 2019 & 2032
- Table 26: Europe Mass Spectroscopy Industry Volume K Unit Forecast, by Technology 2019 & 2032
- Table 27: Europe Mass Spectroscopy Industry Revenue Million Forecast, by Application 2019 & 2032
- Table 28: Europe Mass Spectroscopy Industry Volume K Unit Forecast, by Application 2019 & 2032
- Table 29: Europe Mass Spectroscopy Industry Revenue Million Forecast, by Country 2019 & 2032
- Table 30: Europe Mass Spectroscopy Industry Volume K Unit Forecast, by Country 2019 & 2032
- Table 31: Europe Mass Spectroscopy Industry Revenue Million Forecast, by Technology 2019 & 2032
- Table 32: Europe Mass Spectroscopy Industry Volume K Unit Forecast, by Technology 2019 & 2032
- Table 33: Europe Mass Spectroscopy Industry Revenue Million Forecast, by Application 2019 & 2032
- Table 34: Europe Mass Spectroscopy Industry Volume K Unit Forecast, by Application 2019 & 2032
- Table 35: Europe Mass Spectroscopy Industry Revenue Million Forecast, by Country 2019 & 2032
- Table 36: Europe Mass Spectroscopy Industry Volume K Unit Forecast, by Country 2019 & 2032
- Table 37: Europe Mass Spectroscopy Industry Revenue Million Forecast, by Technology 2019 & 2032
- Table 38: Europe Mass Spectroscopy Industry Volume K Unit Forecast, by Technology 2019 & 2032
- Table 39: Europe Mass Spectroscopy Industry Revenue Million Forecast, by Application 2019 & 2032
- Table 40: Europe Mass Spectroscopy Industry Volume K Unit Forecast, by Application 2019 & 2032
- Table 41: Europe Mass Spectroscopy Industry Revenue Million Forecast, by Country 2019 & 2032
- Table 42: Europe Mass Spectroscopy Industry Volume K Unit Forecast, by Country 2019 & 2032
- Table 43: Europe Mass Spectroscopy Industry Revenue Million Forecast, by Technology 2019 & 2032
- Table 44: Europe Mass Spectroscopy Industry Volume K Unit Forecast, by Technology 2019 & 2032
- Table 45: Europe Mass Spectroscopy Industry Revenue Million Forecast, by Application 2019 & 2032
- Table 46: Europe Mass Spectroscopy Industry Volume K Unit Forecast, by Application 2019 & 2032
- Table 47: Europe Mass Spectroscopy Industry Revenue Million Forecast, by Country 2019 & 2032
- Table 48: Europe Mass Spectroscopy Industry Volume K Unit Forecast, by Country 2019 & 2032
- Table 49: Europe Mass Spectroscopy Industry Revenue Million Forecast, by Technology 2019 & 2032
- Table 50: Europe Mass Spectroscopy Industry Volume K Unit Forecast, by Technology 2019 & 2032
- Table 51: Europe Mass Spectroscopy Industry Revenue Million Forecast, by Application 2019 & 2032
- Table 52: Europe Mass Spectroscopy Industry Volume K Unit Forecast, by Application 2019 & 2032
- Table 53: Europe Mass Spectroscopy Industry Revenue Million Forecast, by Country 2019 & 2032
- Table 54: Europe Mass Spectroscopy Industry Volume K Unit Forecast, by Country 2019 & 2032
- Table 55: Europe Mass Spectroscopy Industry Revenue Million Forecast, by Technology 2019 & 2032
- Table 56: Europe Mass Spectroscopy Industry Volume K Unit Forecast, by Technology 2019 & 2032
- Table 57: Europe Mass Spectroscopy Industry Revenue Million Forecast, by Application 2019 & 2032
- Table 58: Europe Mass Spectroscopy Industry Volume K Unit Forecast, by Application 2019 & 2032
- Table 59: Europe Mass Spectroscopy Industry Revenue Million Forecast, by Country 2019 & 2032
- Table 60: Europe Mass Spectroscopy Industry Volume K Unit Forecast, by Country 2019 & 2032
Frequently Asked Questions
1. What is the projected Compound Annual Growth Rate (CAGR) of the Europe Mass Spectroscopy Industry?
The projected CAGR is approximately 6.50%.
2. Which companies are prominent players in the Europe Mass Spectroscopy Industry?
Key companies in the market include Waters Corporation, Perkinelmer Inc, Thermo Fisher Scientific Inc, Leco Corporation, Danaher Corporation, Agilent Technologies Inc, Dani Instruments SpA, Bruker Corporation, Shimadzu Corporation.
3. What are the main segments of the Europe Mass Spectroscopy Industry?
The market segments include Technology, Application.
4. Can you provide details about the market size?
The market size is estimated to be USD XX Million as of 2022.
5. What are some drivers contributing to market growth?
Increasing Technological Advancement; Increased Pharmaceutical and Biotechnological Compounds in Pipeline.
6. What are the notable trends driving market growth?
Triple Quadrupole (Tandem Mass Spectrometry Devices) Segment is Expected to Dominate the Market over the Forecast Period.
7. Are there any restraints impacting market growth?
High Cost of Instrument; Shortage of Skilled Technicians.
8. Can you provide examples of recent developments in the market?
June 2022: Waters Corporation unveiled new instruments, software, and product enhancements to drive drug discovery and development.
9. What pricing options are available for accessing the report?
Pricing options include single-user, multi-user, and enterprise licenses priced at USD 4750, USD 5250, and USD 8750 respectively.
10. Is the market size provided in terms of value or volume?
The market size is provided in terms of value, measured in Million and volume, measured in K Unit.
11. Are there any specific market keywords associated with the report?
Yes, the market keyword associated with the report is "Europe Mass Spectroscopy Industry," which aids in identifying and referencing the specific market segment covered.
12. How do I determine which pricing option suits my needs best?
The pricing options vary based on user requirements and access needs. Individual users may opt for single-user licenses, while businesses requiring broader access may choose multi-user or enterprise licenses for cost-effective access to the report.
13. Are there any additional resources or data provided in the Europe Mass Spectroscopy Industry report?
While the report offers comprehensive insights, it's advisable to review the specific contents or supplementary materials provided to ascertain if additional resources or data are available.
14. How can I stay updated on further developments or reports in the Europe Mass Spectroscopy Industry?
To stay informed about further developments, trends, and reports in the Europe Mass Spectroscopy Industry, consider subscribing to industry newsletters, following relevant companies and organizations, or regularly checking reputable industry news sources and publications.
Methodology
Step 1 - Identification of Relevant Samples Size from Population Database


Step 2 - Approaches for Defining Global Market Size (Value, Volume* & Price*)

Note*: In applicable scenarios
Step 3 - Data Sources
Primary Research
- Web Analytics
- Survey Reports
- Research Institute
- Latest Research Reports
- Opinion Leaders
Secondary Research
- Annual Reports
- White Paper
- Latest Press Release
- Industry Association
- Paid Database
- Investor Presentations

Step 4 - Data Triangulation
Involves using different sources of information in order to increase the validity of a study
These sources are likely to be stakeholders in a program - participants, other researchers, program staff, other community members, and so on.
Then we put all data in single framework & apply various statistical tools to find out the dynamic on the market.
During the analysis stage, feedback from the stakeholder groups would be compared to determine areas of agreement as well as areas of divergence


