Energy Demand Response Management Market Growth Forecast and Consumer Insights

Energy Demand Response Management Market by Production Analysis, by Consumption Analysis, by Import Market Analysis (Value & Volume), by Export Market Analysis (Value & Volume), by Price Trend Analysis, by North America (United States, Canada, Rest of North America), by Asia Pacific (Australia, China, Japan, South Korea, India, Rest of Asia Pacific), by Europe (France, Germany, Italy, United Kingdom, Rest of Europe), by Middle East and Africa (United Arab Emirates, South Africa, Saudi Arabia, Rest of Middle East and Africa), by South America (Brazil, Argentina, Colombia, Rest of South America) Forecast 2025-2033

Jul 15 2025
Base Year: 2024

234 Pages
Main Logo

Energy Demand Response Management Market Growth Forecast and Consumer Insights


Home
Industries
Energy & Power
sponsor image
sponsor image
sponsor image
sponsor image
sponsor image

Tailored for you

  • In-depth Analysis Tailored to Specified Regions or Segments
  • Company Profiles Customized to User Preferences
  • Comprehensive Insights Focused on Specific Segments or Regions
  • Customized Evaluation of Competitive Landscape to Meet Your Needs
  • Tailored Customization to Address Other Specific Requirements
Ask for customization


Key Insights

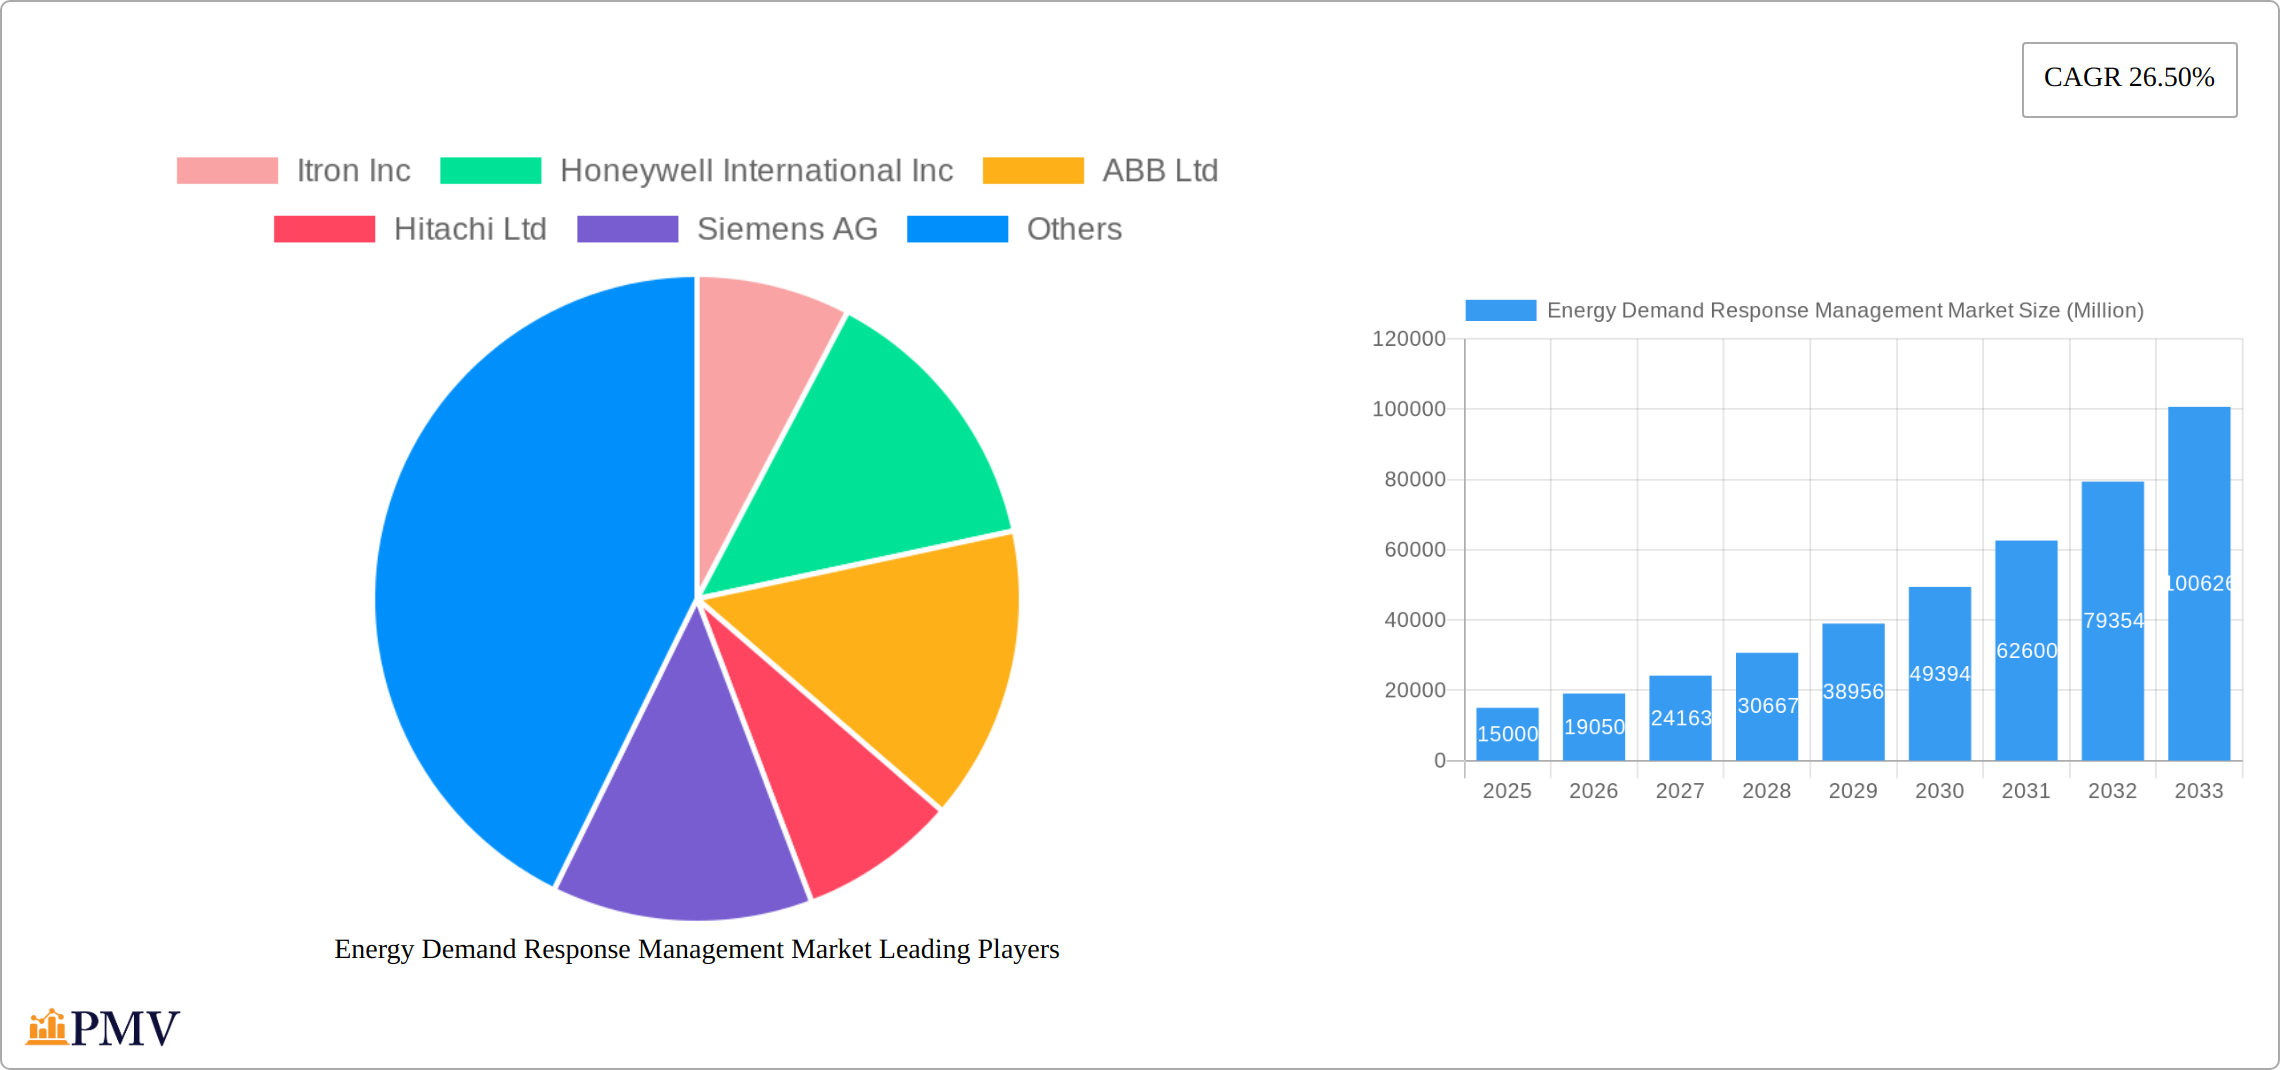
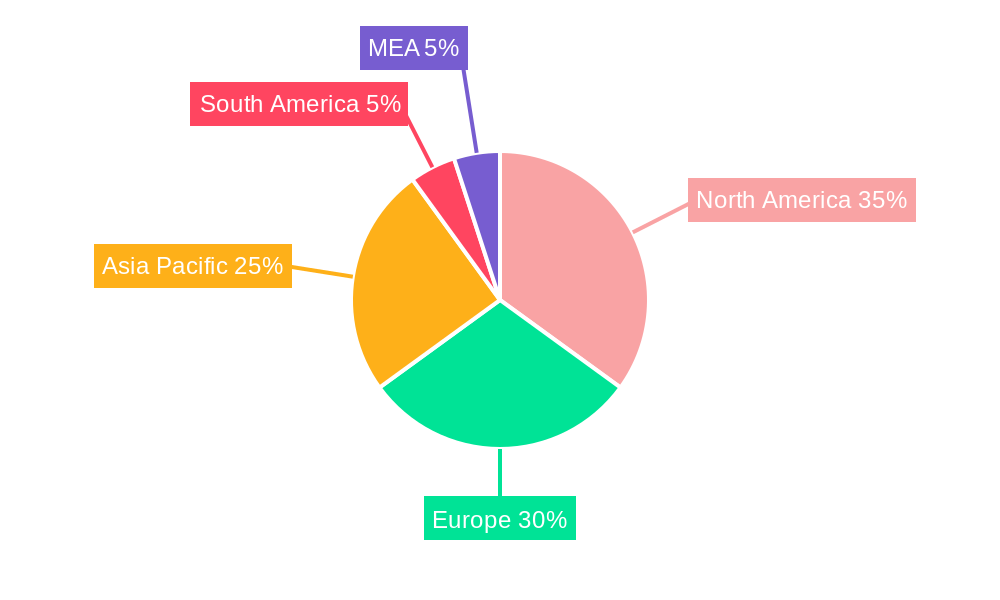
The Energy Demand Response Management (DERM) market is experiencing robust growth, driven by increasing energy costs, growing concerns about grid stability, and the expanding adoption of renewable energy sources. A 26.50% CAGR indicates a significant upward trajectory, transforming the energy landscape. The market's segmentation highlights key growth areas: price-based demand response programs are proving highly effective in managing peak demand, while incentive-based programs are attracting broader participation. Smart meters are the foundational technology, enabling real-time monitoring and control, and are complemented by advanced load control devices and energy management systems (EMS) for enhanced efficiency. The residential sector presents a significant opportunity, fueled by increasing energy awareness among consumers and the availability of affordable smart home technologies. However, the commercial and industrial sectors are expected to demonstrate even stronger growth due to the significant potential for energy savings and operational efficiency improvements. The transportation sector is emerging as a new application area, with electric vehicle charging management becoming increasingly important for grid stability. Geographic distribution shows strong growth across North America and Europe, driven by established regulatory frameworks and technological advancements. Asia-Pacific is poised for rapid expansion due to increasing urbanization and industrialization, while other regions, including South America and the Middle East & Africa, show promising, albeit slower, growth rates reflecting varying levels of infrastructure development and regulatory support. Major players, including Itron, Honeywell, ABB, and Siemens, are actively investing in R&D and strategic partnerships to capitalize on this growing market.

The success of the DERM market hinges on addressing several key restraints. These include the high initial investment costs associated with implementing smart grid technologies, the complexity of integrating various systems, and the need for effective regulatory frameworks to incentivize participation. Furthermore, overcoming consumer reluctance to adopt new technologies and ensuring data security and privacy are crucial for widespread adoption. The market's future growth will depend on continued technological innovation, particularly in areas such as AI-powered demand forecasting and advanced control algorithms. Government policies promoting energy efficiency and renewable energy integration will play a vital role in accelerating market penetration. Successful strategies will focus on educating consumers and businesses about the benefits of demand response, creating user-friendly interfaces for managing energy consumption, and developing robust cybersecurity measures to address concerns about data vulnerabilities.

Energy Demand Response Management Market Research Report - Market Size, Growth & Forecast

Energy Demand Response Management Market: A Comprehensive Report (2019-2033)

This in-depth report provides a comprehensive analysis of the Energy Demand Response Management (DR) market, offering invaluable insights for stakeholders across the energy sector. The study period covers 2019-2033, with 2025 serving as the base and estimated year. The report meticulously examines market structure, competitive dynamics, technological advancements, and growth drivers to provide a complete understanding of this rapidly evolving market. The report projects a market value of xx Million by 2033, exhibiting a CAGR of xx% during the forecast period (2025-2033).

Energy Demand Response Management Market Market Structure & Competitive Dynamics

The Energy Demand Response Management (DR) market presents a dynamic competitive landscape shaped by market concentration, innovation, regulatory frameworks, and evolving industry dynamics. While exhibiting a moderately concentrated structure, the market is characterized by a diverse range of players, from established industry giants to agile, innovative startups. Key players such as Itron Inc, Honeywell International Inc, ABB Ltd, Hitachi Ltd, Siemens AG, Mitsubishi Electric Corporation, Autogrid Systems Inc, Schneider Electric SE, Eaton Corporation PLC, and General Electric Company actively compete for market share, employing various strategies to maintain and expand their positions.

Market share analysis indicates that established players like Itron Inc and Honeywell International Inc hold substantial market positions, leveraging their extensive experience and established customer bases. However, smaller, innovative companies are rapidly gaining traction by introducing cutting-edge technologies and specialized solutions catering to niche market segments. The past five years have witnessed robust mergers and acquisitions (M&A) activity within the sector, with deal values totaling xx Million. This trend reflects larger companies' strategic efforts to consolidate market share and acquire specialized technologies, further enhancing their capabilities and expanding their service portfolios. The regulatory landscape varies considerably across different regions, significantly impacting market access, investment decisions, and the overall pace of adoption. Globally, stringent emission reduction targets are driving increased adoption of DR solutions, creating a favorable market environment.

Importantly, substitution risks within the DR market are relatively low. DR solutions provide unique capabilities in optimizing energy consumption and grid stability, which are not easily replicated by other technologies. This contributes to the market's resilience and continued growth prospects.

  • Market Concentration: Moderately concentrated, with a few dominant players and a growing number of niche players.
  • Innovation Ecosystems: Robust and expanding, driven by advancements in smart grid technologies, artificial intelligence (AI), machine learning (ML), and advanced data analytics.
  • Regulatory Frameworks: Diverse across regions, impacting market entry, investment strategies, and the design of DR programs.
  • Product Substitutes: Limited direct substitutes due to the unique value proposition of DR in grid management and energy efficiency.
  • End-User Trends: Increasing adoption across residential, commercial, and industrial sectors driven by cost savings, sustainability initiatives, and regulatory compliance mandates.
  • M&A Activity: Significant M&A activity, driven by strategic acquisitions of specialized technologies and expansion into new markets.

Energy Demand Response Management Market Industry Trends & Insights

The Energy Demand Response Management market is experiencing robust growth, fueled by a confluence of factors. The increasing integration of renewable energy sources, often characterized by intermittency, necessitates effective DR solutions to ensure grid stability and reliability. Technological advancements, including the widespread adoption of smart meters and the sophistication of advanced energy management systems (EMS), are facilitating more precise and efficient demand response programs. The growing consumer awareness of energy efficiency and sustainability is a significant driver, particularly in the residential and commercial sectors. Supportive government policies and incentives designed to promote energy conservation and grid modernization further enhance market growth. Rising energy prices and the critical need to reduce peak demand are additional factors contributing to the market's upward trajectory.

The market is projected to reach xx Million by 2033, exhibiting a CAGR of xx% from 2025 to 2033. This substantial growth is largely attributed to the expanding adoption of smart grid technologies, favorable regulatory landscapes in key regions, and the escalating cost of energy. Furthermore, the market penetration of DR programs is expected to increase significantly, especially in regions with high electricity demand and grid instability, demonstrating the market's resilience and strong growth potential.

Dominant Markets & Segments in Energy Demand Response Management Market

The North American region currently dominates the Energy Demand Response Management market, driven by robust regulatory frameworks supporting DR programs and high energy consumption in the region. Within the market segments, the price-based demand response approach holds the largest market share due to its simplicity and cost-effectiveness. Smart meters are the leading technology segment due to their widespread deployment and ability to collect real-time energy consumption data. The commercial and industrial sectors are the primary adopters of DR programs, driven by higher energy consumption and potential cost savings.

  • Key Drivers in North America: Stringent environmental regulations, robust grid infrastructure, high energy consumption, and government incentives.
  • Dominant Demand Response Type: Price-based (market share: xx%), followed by incentive-based (xx%) and direct load control (xx%).
  • Dominant Technology: Smart meters (market share: xx%), followed by energy management systems and load control devices.
  • Dominant Application: Commercial (market share: xx%), followed by industrial (xx%) and residential (xx%) sectors.

Energy Demand Response Management Market Product Innovations

Recent innovations in the Energy Demand Response Management market have focused on enhancing the accuracy, efficiency, and scalability of DR programs. Advancements in artificial intelligence (AI) and machine learning (ML) are enabling more sophisticated predictive models to optimize energy consumption and grid stability. The integration of DR systems with other smart grid technologies, such as battery storage and electric vehicle (EV) charging infrastructure, is further expanding the potential applications of demand response. These innovations are leading to more tailored and responsive DR solutions that meet the specific needs of various customer segments. The market is seeing a rise in cloud-based solutions for demand response management, offering improved scalability and data analytics capabilities.

Report Segmentation & Scope

The report provides a comprehensive segmentation of the Energy Demand Response Management market, offering granular insights into various market segments:

Type of Demand Response: The market is segmented by the type of demand response programs: Price-based, incentive-based, and direct load control. Each segment's growth trajectory is analyzed in detail, considering market size, adoption rates, and competitive dynamics. While price-based demand response currently holds the largest market share, the incentive-based segment is projected to exhibit faster growth due to increasing government support and incentives.

Technology: This segmentation focuses on the key technologies enabling DR programs: Smart meters, load control devices, advanced energy management systems (EMS), and specialized demand response software. Smart meters, owing to their cost-effectiveness and ability to form the foundation for broader DR solutions, currently hold the largest market share in this segment.

Application: The report analyzes the market across various applications: Residential, commercial, industrial, and transportation. Currently, the commercial and industrial segments hold the largest market share, reflecting their higher energy consumption and the potential for significant energy savings. However, the residential sector presents considerable growth potential due to increasing awareness and government initiatives promoting energy efficiency.

Key Drivers of Energy Demand Response Management Market Growth

Several factors are driving the growth of the Energy Demand Response Management market. These include rising energy costs, increasing government regulations to improve grid stability and reduce carbon emissions, advancements in smart grid technologies (like AI-powered load forecasting), and growing consumer awareness of energy efficiency. Incentive programs offered by utilities and governments further stimulate market expansion. The increasing integration of renewable energy sources necessitates advanced grid management techniques like DR to maintain balance.

Challenges in the Energy Demand Response Management Market Sector

The Energy Demand Response Management market faces several challenges, including the high initial investment costs for implementing DR programs, cybersecurity vulnerabilities, and the need for interoperability between different DR systems. Furthermore, consumer participation rates can be a challenge, particularly in the residential sector. In some regions, regulatory frameworks may not fully support the implementation of DR programs. The complexity of integrating DR with existing grid infrastructure can also pose a challenge. These factors potentially constrain the market's growth rate by xx% in the coming years.

Leading Players in the Energy Demand Response Management Market Market

  • Itron Inc
  • Honeywell International Inc
  • ABB Ltd
  • Hitachi Ltd
  • Siemens AG
  • Mitsubishi Electric Corporation
  • Autogrid Systems Inc
  • Schneider Electric SE
  • Eaton Corporation PLC
  • General Electric Company

Key Developments in Energy Demand Response Management Market Sector

  • January 2023: Itron Inc. launched a new advanced metering infrastructure (AMI) solution integrated with enhanced DR capabilities, strengthening its position in the market.
  • June 2022: Honeywell International Inc. announced a strategic partnership with a major utility to deploy a large-scale DR program, demonstrating the increasing collaboration between technology providers and energy companies.
  • October 2021: ABB Ltd. acquired a smaller DR software company, expanding its portfolio of solutions and enhancing its technological capabilities. This acquisition highlights the ongoing consolidation within the market.
  • (Further developments can be added here as needed)

Strategic Energy Demand Response Management Market Market Outlook

The future of the Energy Demand Response Management market looks promising. Continued growth is expected, driven by the increasing adoption of renewable energy sources, stricter environmental regulations, and technological advancements in areas like AI and IoT. Strategic opportunities lie in developing innovative DR solutions that are tailored to specific customer needs and integrating DR systems with other smart grid technologies. The market is expected to experience a significant surge in demand for more sophisticated and intelligent DR systems that can seamlessly integrate with existing grid infrastructures. Expanding into developing economies presents lucrative growth potential.

Energy Demand Response Management Market Segmentation

  • 1. Production Analysis
  • 2. Consumption Analysis
  • 3. Import Market Analysis (Value & Volume)
  • 4. Export Market Analysis (Value & Volume)
  • 5. Price Trend Analysis

Energy Demand Response Management Market Segmentation By Geography

  • 1. North America
    • 1.1. United States
    • 1.2. Canada
    • 1.3. Rest of North America
  • 2. Asia Pacific
    • 2.1. Australia
    • 2.2. China
    • 2.3. Japan
    • 2.4. South Korea
    • 2.5. India
    • 2.6. Rest of Asia Pacific
  • 3. Europe
    • 3.1. France
    • 3.2. Germany
    • 3.3. Italy
    • 3.4. United Kingdom
    • 3.5. Rest of Europe
  • 4. Middle East and Africa
    • 4.1. United Arab Emirates
    • 4.2. South Africa
    • 4.3. Saudi Arabia
    • 4.4. Rest of Middle East and Africa
  • 5. South America
    • 5.1. Brazil
    • 5.2. Argentina
    • 5.3. Colombia
    • 5.4. Rest of South America
Energy Demand Response Management Market Regional Share


Energy Demand Response Management Market REPORT HIGHLIGHTS

AspectsDetails
Study Period 2019-2033
Base Year 2024
Estimated Year 2025
Forecast Period2025-2033
Historical Period2019-2024
Growth RateCAGR of 26.50% from 2019-2033
Segmentation
    • By Production Analysis
    • By Consumption Analysis
    • By Import Market Analysis (Value & Volume)
    • By Export Market Analysis (Value & Volume)
    • By Price Trend Analysis
  • By Geography
    • North America
      • United States
      • Canada
      • Rest of North America
    • Asia Pacific
      • Australia
      • China
      • Japan
      • South Korea
      • India
      • Rest of Asia Pacific
    • Europe
      • France
      • Germany
      • Italy
      • United Kingdom
      • Rest of Europe
    • Middle East and Africa
      • United Arab Emirates
      • South Africa
      • Saudi Arabia
      • Rest of Middle East and Africa
    • South America
      • Brazil
      • Argentina
      • Colombia
      • Rest of South America


Table of Contents

  1. 1. Introduction
    • 1.1. Research Scope
    • 1.2. Market Segmentation
    • 1.3. Research Methodology
    • 1.4. Definitions and Assumptions
  2. 2. Executive Summary
    • 2.1. Introduction
  3. 3. Market Dynamics
    • 3.1. Introduction
      • 3.2. Market Drivers
        • 3.2.1. 4.; Growing Vehicle Ownership4.; Government Initiatives
      • 3.3. Market Restrains
        • 3.3.1. 4.; Volatile Crude Oil Prices
      • 3.4. Market Trends
        • 3.4.1. Increased Adoption of Smart Grid Technologies
  4. 4. Market Factor Analysis
    • 4.1. Porters Five Forces
    • 4.2. Supply/Value Chain
    • 4.3. PESTEL analysis
    • 4.4. Market Entropy
    • 4.5. Patent/Trademark Analysis
  5. 5. Global Energy Demand Response Management Market Analysis, Insights and Forecast, 2019-2031
    • 5.1. Market Analysis, Insights and Forecast - by Production Analysis
      • 5.2. Market Analysis, Insights and Forecast - by Consumption Analysis
        • 5.3. Market Analysis, Insights and Forecast - by Import Market Analysis (Value & Volume)
          • 5.4. Market Analysis, Insights and Forecast - by Export Market Analysis (Value & Volume)
            • 5.5. Market Analysis, Insights and Forecast - by Price Trend Analysis
              • 5.6. Market Analysis, Insights and Forecast - by Region
                • 5.6.1. North America
                • 5.6.2. Asia Pacific
                • 5.6.3. Europe
                • 5.6.4. Middle East and Africa
                • 5.6.5. South America
            • 6. North America Energy Demand Response Management Market Analysis, Insights and Forecast, 2019-2031
              • 6.1. Market Analysis, Insights and Forecast - by Production Analysis
                • 6.2. Market Analysis, Insights and Forecast - by Consumption Analysis
                  • 6.3. Market Analysis, Insights and Forecast - by Import Market Analysis (Value & Volume)
                    • 6.4. Market Analysis, Insights and Forecast - by Export Market Analysis (Value & Volume)
                      • 6.5. Market Analysis, Insights and Forecast - by Price Trend Analysis
                      • 7. Asia Pacific Energy Demand Response Management Market Analysis, Insights and Forecast, 2019-2031
                        • 7.1. Market Analysis, Insights and Forecast - by Production Analysis
                          • 7.2. Market Analysis, Insights and Forecast - by Consumption Analysis
                            • 7.3. Market Analysis, Insights and Forecast - by Import Market Analysis (Value & Volume)
                              • 7.4. Market Analysis, Insights and Forecast - by Export Market Analysis (Value & Volume)
                                • 7.5. Market Analysis, Insights and Forecast - by Price Trend Analysis
                                • 8. Europe Energy Demand Response Management Market Analysis, Insights and Forecast, 2019-2031
                                  • 8.1. Market Analysis, Insights and Forecast - by Production Analysis
                                    • 8.2. Market Analysis, Insights and Forecast - by Consumption Analysis
                                      • 8.3. Market Analysis, Insights and Forecast - by Import Market Analysis (Value & Volume)
                                        • 8.4. Market Analysis, Insights and Forecast - by Export Market Analysis (Value & Volume)
                                          • 8.5. Market Analysis, Insights and Forecast - by Price Trend Analysis
                                          • 9. Middle East and Africa Energy Demand Response Management Market Analysis, Insights and Forecast, 2019-2031
                                            • 9.1. Market Analysis, Insights and Forecast - by Production Analysis
                                              • 9.2. Market Analysis, Insights and Forecast - by Consumption Analysis
                                                • 9.3. Market Analysis, Insights and Forecast - by Import Market Analysis (Value & Volume)
                                                  • 9.4. Market Analysis, Insights and Forecast - by Export Market Analysis (Value & Volume)
                                                    • 9.5. Market Analysis, Insights and Forecast - by Price Trend Analysis
                                                    • 10. South America Energy Demand Response Management Market Analysis, Insights and Forecast, 2019-2031
                                                      • 10.1. Market Analysis, Insights and Forecast - by Production Analysis
                                                        • 10.2. Market Analysis, Insights and Forecast - by Consumption Analysis
                                                          • 10.3. Market Analysis, Insights and Forecast - by Import Market Analysis (Value & Volume)
                                                            • 10.4. Market Analysis, Insights and Forecast - by Export Market Analysis (Value & Volume)
                                                              • 10.5. Market Analysis, Insights and Forecast - by Price Trend Analysis
                                                              • 11. North America Energy Demand Response Management Market Analysis, Insights and Forecast, 2019-2031
                                                                  • 11.1. Market Analysis, Insights and Forecast - By Country/Sub-region
                                                                    • 11.1.1 United States
                                                                    • 11.1.2 Canada
                                                                    • 11.1.3 Mexico
                                                              • 12. Europe Energy Demand Response Management Market Analysis, Insights and Forecast, 2019-2031
                                                                  • 12.1. Market Analysis, Insights and Forecast - By Country/Sub-region
                                                                    • 12.1.1 Germany
                                                                    • 12.1.2 United Kingdom
                                                                    • 12.1.3 France
                                                                    • 12.1.4 Spain
                                                                    • 12.1.5 Italy
                                                                    • 12.1.6 Spain
                                                                    • 12.1.7 Belgium
                                                                    • 12.1.8 Netherland
                                                                    • 12.1.9 Nordics
                                                                    • 12.1.10 Rest of Europe
                                                              • 13. Asia Pacific Energy Demand Response Management Market Analysis, Insights and Forecast, 2019-2031
                                                                  • 13.1. Market Analysis, Insights and Forecast - By Country/Sub-region
                                                                    • 13.1.1 China
                                                                    • 13.1.2 Japan
                                                                    • 13.1.3 India
                                                                    • 13.1.4 South Korea
                                                                    • 13.1.5 Southeast Asia
                                                                    • 13.1.6 Australia
                                                                    • 13.1.7 Indonesia
                                                                    • 13.1.8 Phillipes
                                                                    • 13.1.9 Singapore
                                                                    • 13.1.10 Thailandc
                                                                    • 13.1.11 Rest of Asia Pacific
                                                              • 14. South America Energy Demand Response Management Market Analysis, Insights and Forecast, 2019-2031
                                                                  • 14.1. Market Analysis, Insights and Forecast - By Country/Sub-region
                                                                    • 14.1.1 Brazil
                                                                    • 14.1.2 Argentina
                                                                    • 14.1.3 Peru
                                                                    • 14.1.4 Chile
                                                                    • 14.1.5 Colombia
                                                                    • 14.1.6 Ecuador
                                                                    • 14.1.7 Venezuela
                                                                    • 14.1.8 Rest of South America
                                                              • 15. MEA Energy Demand Response Management Market Analysis, Insights and Forecast, 2019-2031
                                                                  • 15.1. Market Analysis, Insights and Forecast - By Country/Sub-region
                                                                    • 15.1.1 United Arab Emirates
                                                                    • 15.1.2 Saudi Arabia
                                                                    • 15.1.3 South Africa
                                                                    • 15.1.4 Rest of Middle East and Africa
                                                              • 16. Competitive Analysis
                                                                • 16.1. Global Market Share Analysis 2024
                                                                  • 16.2. Company Profiles
                                                                    • 16.2.1 Itron Inc
                                                                      • 16.2.1.1. Overview
                                                                      • 16.2.1.2. Products
                                                                      • 16.2.1.3. SWOT Analysis
                                                                      • 16.2.1.4. Recent Developments
                                                                      • 16.2.1.5. Financials (Based on Availability)
                                                                    • 16.2.2 Honeywell International Inc
                                                                      • 16.2.2.1. Overview
                                                                      • 16.2.2.2. Products
                                                                      • 16.2.2.3. SWOT Analysis
                                                                      • 16.2.2.4. Recent Developments
                                                                      • 16.2.2.5. Financials (Based on Availability)
                                                                    • 16.2.3 ABB Ltd
                                                                      • 16.2.3.1. Overview
                                                                      • 16.2.3.2. Products
                                                                      • 16.2.3.3. SWOT Analysis
                                                                      • 16.2.3.4. Recent Developments
                                                                      • 16.2.3.5. Financials (Based on Availability)
                                                                    • 16.2.4 Hitachi Ltd
                                                                      • 16.2.4.1. Overview
                                                                      • 16.2.4.2. Products
                                                                      • 16.2.4.3. SWOT Analysis
                                                                      • 16.2.4.4. Recent Developments
                                                                      • 16.2.4.5. Financials (Based on Availability)
                                                                    • 16.2.5 Siemens AG
                                                                      • 16.2.5.1. Overview
                                                                      • 16.2.5.2. Products
                                                                      • 16.2.5.3. SWOT Analysis
                                                                      • 16.2.5.4. Recent Developments
                                                                      • 16.2.5.5. Financials (Based on Availability)
                                                                    • 16.2.6 Mitsubishi Electric Corporation
                                                                      • 16.2.6.1. Overview
                                                                      • 16.2.6.2. Products
                                                                      • 16.2.6.3. SWOT Analysis
                                                                      • 16.2.6.4. Recent Developments
                                                                      • 16.2.6.5. Financials (Based on Availability)
                                                                    • 16.2.7 Autogrid Systems Inc
                                                                      • 16.2.7.1. Overview
                                                                      • 16.2.7.2. Products
                                                                      • 16.2.7.3. SWOT Analysis
                                                                      • 16.2.7.4. Recent Developments
                                                                      • 16.2.7.5. Financials (Based on Availability)
                                                                    • 16.2.8 Schneider Electric SE
                                                                      • 16.2.8.1. Overview
                                                                      • 16.2.8.2. Products
                                                                      • 16.2.8.3. SWOT Analysis
                                                                      • 16.2.8.4. Recent Developments
                                                                      • 16.2.8.5. Financials (Based on Availability)
                                                                    • 16.2.9 Eaton Corporation PLC
                                                                      • 16.2.9.1. Overview
                                                                      • 16.2.9.2. Products
                                                                      • 16.2.9.3. SWOT Analysis
                                                                      • 16.2.9.4. Recent Developments
                                                                      • 16.2.9.5. Financials (Based on Availability)
                                                                    • 16.2.10 General Electric Company
                                                                      • 16.2.10.1. Overview
                                                                      • 16.2.10.2. Products
                                                                      • 16.2.10.3. SWOT Analysis
                                                                      • 16.2.10.4. Recent Developments
                                                                      • 16.2.10.5. Financials (Based on Availability)

                                                              List of Figures

                                                              1. Figure 1: Global Energy Demand Response Management Market Revenue Breakdown (Million, %) by Region 2024 & 2032
                                                              2. Figure 2: North America Energy Demand Response Management Market Revenue (Million), by Country 2024 & 2032
                                                              3. Figure 3: North America Energy Demand Response Management Market Revenue Share (%), by Country 2024 & 2032
                                                              4. Figure 4: Europe Energy Demand Response Management Market Revenue (Million), by Country 2024 & 2032
                                                              5. Figure 5: Europe Energy Demand Response Management Market Revenue Share (%), by Country 2024 & 2032
                                                              6. Figure 6: Asia Pacific Energy Demand Response Management Market Revenue (Million), by Country 2024 & 2032
                                                              7. Figure 7: Asia Pacific Energy Demand Response Management Market Revenue Share (%), by Country 2024 & 2032
                                                              8. Figure 8: South America Energy Demand Response Management Market Revenue (Million), by Country 2024 & 2032
                                                              9. Figure 9: South America Energy Demand Response Management Market Revenue Share (%), by Country 2024 & 2032
                                                              10. Figure 10: MEA Energy Demand Response Management Market Revenue (Million), by Country 2024 & 2032
                                                              11. Figure 11: MEA Energy Demand Response Management Market Revenue Share (%), by Country 2024 & 2032
                                                              12. Figure 12: North America Energy Demand Response Management Market Revenue (Million), by Production Analysis 2024 & 2032
                                                              13. Figure 13: North America Energy Demand Response Management Market Revenue Share (%), by Production Analysis 2024 & 2032
                                                              14. Figure 14: North America Energy Demand Response Management Market Revenue (Million), by Consumption Analysis 2024 & 2032
                                                              15. Figure 15: North America Energy Demand Response Management Market Revenue Share (%), by Consumption Analysis 2024 & 2032
                                                              16. Figure 16: North America Energy Demand Response Management Market Revenue (Million), by Import Market Analysis (Value & Volume) 2024 & 2032
                                                              17. Figure 17: North America Energy Demand Response Management Market Revenue Share (%), by Import Market Analysis (Value & Volume) 2024 & 2032
                                                              18. Figure 18: North America Energy Demand Response Management Market Revenue (Million), by Export Market Analysis (Value & Volume) 2024 & 2032
                                                              19. Figure 19: North America Energy Demand Response Management Market Revenue Share (%), by Export Market Analysis (Value & Volume) 2024 & 2032
                                                              20. Figure 20: North America Energy Demand Response Management Market Revenue (Million), by Price Trend Analysis 2024 & 2032
                                                              21. Figure 21: North America Energy Demand Response Management Market Revenue Share (%), by Price Trend Analysis 2024 & 2032
                                                              22. Figure 22: North America Energy Demand Response Management Market Revenue (Million), by Country 2024 & 2032
                                                              23. Figure 23: North America Energy Demand Response Management Market Revenue Share (%), by Country 2024 & 2032
                                                              24. Figure 24: Asia Pacific Energy Demand Response Management Market Revenue (Million), by Production Analysis 2024 & 2032
                                                              25. Figure 25: Asia Pacific Energy Demand Response Management Market Revenue Share (%), by Production Analysis 2024 & 2032
                                                              26. Figure 26: Asia Pacific Energy Demand Response Management Market Revenue (Million), by Consumption Analysis 2024 & 2032
                                                              27. Figure 27: Asia Pacific Energy Demand Response Management Market Revenue Share (%), by Consumption Analysis 2024 & 2032
                                                              28. Figure 28: Asia Pacific Energy Demand Response Management Market Revenue (Million), by Import Market Analysis (Value & Volume) 2024 & 2032
                                                              29. Figure 29: Asia Pacific Energy Demand Response Management Market Revenue Share (%), by Import Market Analysis (Value & Volume) 2024 & 2032
                                                              30. Figure 30: Asia Pacific Energy Demand Response Management Market Revenue (Million), by Export Market Analysis (Value & Volume) 2024 & 2032
                                                              31. Figure 31: Asia Pacific Energy Demand Response Management Market Revenue Share (%), by Export Market Analysis (Value & Volume) 2024 & 2032
                                                              32. Figure 32: Asia Pacific Energy Demand Response Management Market Revenue (Million), by Price Trend Analysis 2024 & 2032
                                                              33. Figure 33: Asia Pacific Energy Demand Response Management Market Revenue Share (%), by Price Trend Analysis 2024 & 2032
                                                              34. Figure 34: Asia Pacific Energy Demand Response Management Market Revenue (Million), by Country 2024 & 2032
                                                              35. Figure 35: Asia Pacific Energy Demand Response Management Market Revenue Share (%), by Country 2024 & 2032
                                                              36. Figure 36: Europe Energy Demand Response Management Market Revenue (Million), by Production Analysis 2024 & 2032
                                                              37. Figure 37: Europe Energy Demand Response Management Market Revenue Share (%), by Production Analysis 2024 & 2032
                                                              38. Figure 38: Europe Energy Demand Response Management Market Revenue (Million), by Consumption Analysis 2024 & 2032
                                                              39. Figure 39: Europe Energy Demand Response Management Market Revenue Share (%), by Consumption Analysis 2024 & 2032
                                                              40. Figure 40: Europe Energy Demand Response Management Market Revenue (Million), by Import Market Analysis (Value & Volume) 2024 & 2032
                                                              41. Figure 41: Europe Energy Demand Response Management Market Revenue Share (%), by Import Market Analysis (Value & Volume) 2024 & 2032
                                                              42. Figure 42: Europe Energy Demand Response Management Market Revenue (Million), by Export Market Analysis (Value & Volume) 2024 & 2032
                                                              43. Figure 43: Europe Energy Demand Response Management Market Revenue Share (%), by Export Market Analysis (Value & Volume) 2024 & 2032
                                                              44. Figure 44: Europe Energy Demand Response Management Market Revenue (Million), by Price Trend Analysis 2024 & 2032
                                                              45. Figure 45: Europe Energy Demand Response Management Market Revenue Share (%), by Price Trend Analysis 2024 & 2032
                                                              46. Figure 46: Europe Energy Demand Response Management Market Revenue (Million), by Country 2024 & 2032
                                                              47. Figure 47: Europe Energy Demand Response Management Market Revenue Share (%), by Country 2024 & 2032
                                                              48. Figure 48: Middle East and Africa Energy Demand Response Management Market Revenue (Million), by Production Analysis 2024 & 2032
                                                              49. Figure 49: Middle East and Africa Energy Demand Response Management Market Revenue Share (%), by Production Analysis 2024 & 2032
                                                              50. Figure 50: Middle East and Africa Energy Demand Response Management Market Revenue (Million), by Consumption Analysis 2024 & 2032
                                                              51. Figure 51: Middle East and Africa Energy Demand Response Management Market Revenue Share (%), by Consumption Analysis 2024 & 2032
                                                              52. Figure 52: Middle East and Africa Energy Demand Response Management Market Revenue (Million), by Import Market Analysis (Value & Volume) 2024 & 2032
                                                              53. Figure 53: Middle East and Africa Energy Demand Response Management Market Revenue Share (%), by Import Market Analysis (Value & Volume) 2024 & 2032
                                                              54. Figure 54: Middle East and Africa Energy Demand Response Management Market Revenue (Million), by Export Market Analysis (Value & Volume) 2024 & 2032
                                                              55. Figure 55: Middle East and Africa Energy Demand Response Management Market Revenue Share (%), by Export Market Analysis (Value & Volume) 2024 & 2032
                                                              56. Figure 56: Middle East and Africa Energy Demand Response Management Market Revenue (Million), by Price Trend Analysis 2024 & 2032
                                                              57. Figure 57: Middle East and Africa Energy Demand Response Management Market Revenue Share (%), by Price Trend Analysis 2024 & 2032
                                                              58. Figure 58: Middle East and Africa Energy Demand Response Management Market Revenue (Million), by Country 2024 & 2032
                                                              59. Figure 59: Middle East and Africa Energy Demand Response Management Market Revenue Share (%), by Country 2024 & 2032
                                                              60. Figure 60: South America Energy Demand Response Management Market Revenue (Million), by Production Analysis 2024 & 2032
                                                              61. Figure 61: South America Energy Demand Response Management Market Revenue Share (%), by Production Analysis 2024 & 2032
                                                              62. Figure 62: South America Energy Demand Response Management Market Revenue (Million), by Consumption Analysis 2024 & 2032
                                                              63. Figure 63: South America Energy Demand Response Management Market Revenue Share (%), by Consumption Analysis 2024 & 2032
                                                              64. Figure 64: South America Energy Demand Response Management Market Revenue (Million), by Import Market Analysis (Value & Volume) 2024 & 2032
                                                              65. Figure 65: South America Energy Demand Response Management Market Revenue Share (%), by Import Market Analysis (Value & Volume) 2024 & 2032
                                                              66. Figure 66: South America Energy Demand Response Management Market Revenue (Million), by Export Market Analysis (Value & Volume) 2024 & 2032
                                                              67. Figure 67: South America Energy Demand Response Management Market Revenue Share (%), by Export Market Analysis (Value & Volume) 2024 & 2032
                                                              68. Figure 68: South America Energy Demand Response Management Market Revenue (Million), by Price Trend Analysis 2024 & 2032
                                                              69. Figure 69: South America Energy Demand Response Management Market Revenue Share (%), by Price Trend Analysis 2024 & 2032
                                                              70. Figure 70: South America Energy Demand Response Management Market Revenue (Million), by Country 2024 & 2032
                                                              71. Figure 71: South America Energy Demand Response Management Market Revenue Share (%), by Country 2024 & 2032

                                                              List of Tables

                                                              1. Table 1: Global Energy Demand Response Management Market Revenue Million Forecast, by Region 2019 & 2032
                                                              2. Table 2: Global Energy Demand Response Management Market Revenue Million Forecast, by Production Analysis 2019 & 2032
                                                              3. Table 3: Global Energy Demand Response Management Market Revenue Million Forecast, by Consumption Analysis 2019 & 2032
                                                              4. Table 4: Global Energy Demand Response Management Market Revenue Million Forecast, by Import Market Analysis (Value & Volume) 2019 & 2032
                                                              5. Table 5: Global Energy Demand Response Management Market Revenue Million Forecast, by Export Market Analysis (Value & Volume) 2019 & 2032
                                                              6. Table 6: Global Energy Demand Response Management Market Revenue Million Forecast, by Price Trend Analysis 2019 & 2032
                                                              7. Table 7: Global Energy Demand Response Management Market Revenue Million Forecast, by Region 2019 & 2032
                                                              8. Table 8: Global Energy Demand Response Management Market Revenue Million Forecast, by Country 2019 & 2032
                                                              9. Table 9: United States Energy Demand Response Management Market Revenue (Million) Forecast, by Application 2019 & 2032
                                                              10. Table 10: Canada Energy Demand Response Management Market Revenue (Million) Forecast, by Application 2019 & 2032
                                                              11. Table 11: Mexico Energy Demand Response Management Market Revenue (Million) Forecast, by Application 2019 & 2032
                                                              12. Table 12: Global Energy Demand Response Management Market Revenue Million Forecast, by Country 2019 & 2032
                                                              13. Table 13: Germany Energy Demand Response Management Market Revenue (Million) Forecast, by Application 2019 & 2032
                                                              14. Table 14: United Kingdom Energy Demand Response Management Market Revenue (Million) Forecast, by Application 2019 & 2032
                                                              15. Table 15: France Energy Demand Response Management Market Revenue (Million) Forecast, by Application 2019 & 2032
                                                              16. Table 16: Spain Energy Demand Response Management Market Revenue (Million) Forecast, by Application 2019 & 2032
                                                              17. Table 17: Italy Energy Demand Response Management Market Revenue (Million) Forecast, by Application 2019 & 2032
                                                              18. Table 18: Spain Energy Demand Response Management Market Revenue (Million) Forecast, by Application 2019 & 2032
                                                              19. Table 19: Belgium Energy Demand Response Management Market Revenue (Million) Forecast, by Application 2019 & 2032
                                                              20. Table 20: Netherland Energy Demand Response Management Market Revenue (Million) Forecast, by Application 2019 & 2032
                                                              21. Table 21: Nordics Energy Demand Response Management Market Revenue (Million) Forecast, by Application 2019 & 2032
                                                              22. Table 22: Rest of Europe Energy Demand Response Management Market Revenue (Million) Forecast, by Application 2019 & 2032
                                                              23. Table 23: Global Energy Demand Response Management Market Revenue Million Forecast, by Country 2019 & 2032
                                                              24. Table 24: China Energy Demand Response Management Market Revenue (Million) Forecast, by Application 2019 & 2032
                                                              25. Table 25: Japan Energy Demand Response Management Market Revenue (Million) Forecast, by Application 2019 & 2032
                                                              26. Table 26: India Energy Demand Response Management Market Revenue (Million) Forecast, by Application 2019 & 2032
                                                              27. Table 27: South Korea Energy Demand Response Management Market Revenue (Million) Forecast, by Application 2019 & 2032
                                                              28. Table 28: Southeast Asia Energy Demand Response Management Market Revenue (Million) Forecast, by Application 2019 & 2032
                                                              29. Table 29: Australia Energy Demand Response Management Market Revenue (Million) Forecast, by Application 2019 & 2032
                                                              30. Table 30: Indonesia Energy Demand Response Management Market Revenue (Million) Forecast, by Application 2019 & 2032
                                                              31. Table 31: Phillipes Energy Demand Response Management Market Revenue (Million) Forecast, by Application 2019 & 2032
                                                              32. Table 32: Singapore Energy Demand Response Management Market Revenue (Million) Forecast, by Application 2019 & 2032
                                                              33. Table 33: Thailandc Energy Demand Response Management Market Revenue (Million) Forecast, by Application 2019 & 2032
                                                              34. Table 34: Rest of Asia Pacific Energy Demand Response Management Market Revenue (Million) Forecast, by Application 2019 & 2032
                                                              35. Table 35: Global Energy Demand Response Management Market Revenue Million Forecast, by Country 2019 & 2032
                                                              36. Table 36: Brazil Energy Demand Response Management Market Revenue (Million) Forecast, by Application 2019 & 2032
                                                              37. Table 37: Argentina Energy Demand Response Management Market Revenue (Million) Forecast, by Application 2019 & 2032
                                                              38. Table 38: Peru Energy Demand Response Management Market Revenue (Million) Forecast, by Application 2019 & 2032
                                                              39. Table 39: Chile Energy Demand Response Management Market Revenue (Million) Forecast, by Application 2019 & 2032
                                                              40. Table 40: Colombia Energy Demand Response Management Market Revenue (Million) Forecast, by Application 2019 & 2032
                                                              41. Table 41: Ecuador Energy Demand Response Management Market Revenue (Million) Forecast, by Application 2019 & 2032
                                                              42. Table 42: Venezuela Energy Demand Response Management Market Revenue (Million) Forecast, by Application 2019 & 2032
                                                              43. Table 43: Rest of South America Energy Demand Response Management Market Revenue (Million) Forecast, by Application 2019 & 2032
                                                              44. Table 44: Global Energy Demand Response Management Market Revenue Million Forecast, by Country 2019 & 2032
                                                              45. Table 45: United Arab Emirates Energy Demand Response Management Market Revenue (Million) Forecast, by Application 2019 & 2032
                                                              46. Table 46: Saudi Arabia Energy Demand Response Management Market Revenue (Million) Forecast, by Application 2019 & 2032
                                                              47. Table 47: South Africa Energy Demand Response Management Market Revenue (Million) Forecast, by Application 2019 & 2032
                                                              48. Table 48: Rest of Middle East and Africa Energy Demand Response Management Market Revenue (Million) Forecast, by Application 2019 & 2032
                                                              49. Table 49: Global Energy Demand Response Management Market Revenue Million Forecast, by Production Analysis 2019 & 2032
                                                              50. Table 50: Global Energy Demand Response Management Market Revenue Million Forecast, by Consumption Analysis 2019 & 2032
                                                              51. Table 51: Global Energy Demand Response Management Market Revenue Million Forecast, by Import Market Analysis (Value & Volume) 2019 & 2032
                                                              52. Table 52: Global Energy Demand Response Management Market Revenue Million Forecast, by Export Market Analysis (Value & Volume) 2019 & 2032
                                                              53. Table 53: Global Energy Demand Response Management Market Revenue Million Forecast, by Price Trend Analysis 2019 & 2032
                                                              54. Table 54: Global Energy Demand Response Management Market Revenue Million Forecast, by Country 2019 & 2032
                                                              55. Table 55: United States Energy Demand Response Management Market Revenue (Million) Forecast, by Application 2019 & 2032
                                                              56. Table 56: Canada Energy Demand Response Management Market Revenue (Million) Forecast, by Application 2019 & 2032
                                                              57. Table 57: Rest of North America Energy Demand Response Management Market Revenue (Million) Forecast, by Application 2019 & 2032
                                                              58. Table 58: Global Energy Demand Response Management Market Revenue Million Forecast, by Production Analysis 2019 & 2032
                                                              59. Table 59: Global Energy Demand Response Management Market Revenue Million Forecast, by Consumption Analysis 2019 & 2032
                                                              60. Table 60: Global Energy Demand Response Management Market Revenue Million Forecast, by Import Market Analysis (Value & Volume) 2019 & 2032
                                                              61. Table 61: Global Energy Demand Response Management Market Revenue Million Forecast, by Export Market Analysis (Value & Volume) 2019 & 2032
                                                              62. Table 62: Global Energy Demand Response Management Market Revenue Million Forecast, by Price Trend Analysis 2019 & 2032
                                                              63. Table 63: Global Energy Demand Response Management Market Revenue Million Forecast, by Country 2019 & 2032
                                                              64. Table 64: Australia Energy Demand Response Management Market Revenue (Million) Forecast, by Application 2019 & 2032
                                                              65. Table 65: China Energy Demand Response Management Market Revenue (Million) Forecast, by Application 2019 & 2032
                                                              66. Table 66: Japan Energy Demand Response Management Market Revenue (Million) Forecast, by Application 2019 & 2032
                                                              67. Table 67: South Korea Energy Demand Response Management Market Revenue (Million) Forecast, by Application 2019 & 2032
                                                              68. Table 68: India Energy Demand Response Management Market Revenue (Million) Forecast, by Application 2019 & 2032
                                                              69. Table 69: Rest of Asia Pacific Energy Demand Response Management Market Revenue (Million) Forecast, by Application 2019 & 2032
                                                              70. Table 70: Global Energy Demand Response Management Market Revenue Million Forecast, by Production Analysis 2019 & 2032
                                                              71. Table 71: Global Energy Demand Response Management Market Revenue Million Forecast, by Consumption Analysis 2019 & 2032
                                                              72. Table 72: Global Energy Demand Response Management Market Revenue Million Forecast, by Import Market Analysis (Value & Volume) 2019 & 2032
                                                              73. Table 73: Global Energy Demand Response Management Market Revenue Million Forecast, by Export Market Analysis (Value & Volume) 2019 & 2032
                                                              74. Table 74: Global Energy Demand Response Management Market Revenue Million Forecast, by Price Trend Analysis 2019 & 2032
                                                              75. Table 75: Global Energy Demand Response Management Market Revenue Million Forecast, by Country 2019 & 2032
                                                              76. Table 76: France Energy Demand Response Management Market Revenue (Million) Forecast, by Application 2019 & 2032
                                                              77. Table 77: Germany Energy Demand Response Management Market Revenue (Million) Forecast, by Application 2019 & 2032
                                                              78. Table 78: Italy Energy Demand Response Management Market Revenue (Million) Forecast, by Application 2019 & 2032
                                                              79. Table 79: United Kingdom Energy Demand Response Management Market Revenue (Million) Forecast, by Application 2019 & 2032
                                                              80. Table 80: Rest of Europe Energy Demand Response Management Market Revenue (Million) Forecast, by Application 2019 & 2032
                                                              81. Table 81: Global Energy Demand Response Management Market Revenue Million Forecast, by Production Analysis 2019 & 2032
                                                              82. Table 82: Global Energy Demand Response Management Market Revenue Million Forecast, by Consumption Analysis 2019 & 2032
                                                              83. Table 83: Global Energy Demand Response Management Market Revenue Million Forecast, by Import Market Analysis (Value & Volume) 2019 & 2032
                                                              84. Table 84: Global Energy Demand Response Management Market Revenue Million Forecast, by Export Market Analysis (Value & Volume) 2019 & 2032
                                                              85. Table 85: Global Energy Demand Response Management Market Revenue Million Forecast, by Price Trend Analysis 2019 & 2032
                                                              86. Table 86: Global Energy Demand Response Management Market Revenue Million Forecast, by Country 2019 & 2032
                                                              87. Table 87: United Arab Emirates Energy Demand Response Management Market Revenue (Million) Forecast, by Application 2019 & 2032
                                                              88. Table 88: South Africa Energy Demand Response Management Market Revenue (Million) Forecast, by Application 2019 & 2032
                                                              89. Table 89: Saudi Arabia Energy Demand Response Management Market Revenue (Million) Forecast, by Application 2019 & 2032
                                                              90. Table 90: Rest of Middle East and Africa Energy Demand Response Management Market Revenue (Million) Forecast, by Application 2019 & 2032
                                                              91. Table 91: Global Energy Demand Response Management Market Revenue Million Forecast, by Production Analysis 2019 & 2032
                                                              92. Table 92: Global Energy Demand Response Management Market Revenue Million Forecast, by Consumption Analysis 2019 & 2032
                                                              93. Table 93: Global Energy Demand Response Management Market Revenue Million Forecast, by Import Market Analysis (Value & Volume) 2019 & 2032
                                                              94. Table 94: Global Energy Demand Response Management Market Revenue Million Forecast, by Export Market Analysis (Value & Volume) 2019 & 2032
                                                              95. Table 95: Global Energy Demand Response Management Market Revenue Million Forecast, by Price Trend Analysis 2019 & 2032
                                                              96. Table 96: Global Energy Demand Response Management Market Revenue Million Forecast, by Country 2019 & 2032
                                                              97. Table 97: Brazil Energy Demand Response Management Market Revenue (Million) Forecast, by Application 2019 & 2032
                                                              98. Table 98: Argentina Energy Demand Response Management Market Revenue (Million) Forecast, by Application 2019 & 2032
                                                              99. Table 99: Colombia Energy Demand Response Management Market Revenue (Million) Forecast, by Application 2019 & 2032
                                                              100. Table 100: Rest of South America Energy Demand Response Management Market Revenue (Million) Forecast, by Application 2019 & 2032


                                                              Frequently Asked Questions

                                                              1. What is the projected Compound Annual Growth Rate (CAGR) of the Energy Demand Response Management Market?

                                                              The projected CAGR is approximately 26.50%.

                                                              2. Which companies are prominent players in the Energy Demand Response Management Market?

                                                              Key companies in the market include Itron Inc, Honeywell International Inc, ABB Ltd, Hitachi Ltd, Siemens AG, Mitsubishi Electric Corporation, Autogrid Systems Inc, Schneider Electric SE, Eaton Corporation PLC, General Electric Company.

                                                              3. What are the main segments of the Energy Demand Response Management Market?

                                                              The market segments include Production Analysis, Consumption Analysis, Import Market Analysis (Value & Volume), Export Market Analysis (Value & Volume), Price Trend Analysis.

                                                              4. Can you provide details about the market size?

                                                              The market size is estimated to be USD XX Million as of 2022.

                                                              5. What are some drivers contributing to market growth?

                                                              4.; Growing Vehicle Ownership4.; Government Initiatives.

                                                              6. What are the notable trends driving market growth?

                                                              Increased Adoption of Smart Grid Technologies.

                                                              7. Are there any restraints impacting market growth?

                                                              4.; Volatile Crude Oil Prices.

                                                              8. Can you provide examples of recent developments in the market?

                                                              N/A

                                                              9. What pricing options are available for accessing the report?

                                                              Pricing options include single-user, multi-user, and enterprise licenses priced at USD 4750, USD 5250, and USD 8750 respectively.

                                                              10. Is the market size provided in terms of value or volume?

                                                              The market size is provided in terms of value, measured in Million.

                                                              11. Are there any specific market keywords associated with the report?

                                                              Yes, the market keyword associated with the report is "Energy Demand Response Management Market," which aids in identifying and referencing the specific market segment covered.

                                                              12. How do I determine which pricing option suits my needs best?

                                                              The pricing options vary based on user requirements and access needs. Individual users may opt for single-user licenses, while businesses requiring broader access may choose multi-user or enterprise licenses for cost-effective access to the report.

                                                              13. Are there any additional resources or data provided in the Energy Demand Response Management Market report?

                                                              While the report offers comprehensive insights, it's advisable to review the specific contents or supplementary materials provided to ascertain if additional resources or data are available.

                                                              14. How can I stay updated on further developments or reports in the Energy Demand Response Management Market?

                                                              To stay informed about further developments, trends, and reports in the Energy Demand Response Management Market, consider subscribing to industry newsletters, following relevant companies and organizations, or regularly checking reputable industry news sources and publications.


                                                              Methodology

                                                              Step 1 - Identification of Relevant Samples Size from Population Database

                                                              Step Chart
                                                              Bar Chart
                                                              Method Chart

                                                              Step 2 - Approaches for Defining Global Market Size (Value, Volume* & Price*)

                                                              Approach Chart
                                                              Top-down and bottom-up approaches are used to validate the global market size and estimate the market size for manufactures, regional segments, product, and application.

                                                              Note*: In applicable scenarios

                                                              Step 3 - Data Sources

                                                              Primary Research

                                                              • Web Analytics
                                                              • Survey Reports
                                                              • Research Institute
                                                              • Latest Research Reports
                                                              • Opinion Leaders

                                                              Secondary Research

                                                              • Annual Reports
                                                              • White Paper
                                                              • Latest Press Release
                                                              • Industry Association
                                                              • Paid Database
                                                              • Investor Presentations
                                                              Analyst Chart

                                                              Step 4 - Data Triangulation

                                                              Involves using different sources of information in order to increase the validity of a study

                                                              These sources are likely to be stakeholders in a program - participants, other researchers, program staff, other community members, and so on.

                                                              Then we put all data in single framework & apply various statistical tools to find out the dynamic on the market.

                                                              During the analysis stage, feedback from the stakeholder groups would be compared to determine areas of agreement as well as areas of divergence

                                                              Additionally, after gathering mixed and scattered data from a wide range of sources, data is triangulated and correlated to come up with estimated figures which are further validated through primary mediums or industry experts, opinion leaders.

                                                              About Precision Market View

                                                              Precision Market View offers precise market research, industry intelligence, and data analysis for healthcare, manufacturing, technology, and energy. Our reports provide the clarity you need to make informed decisions and drive growth.

                                                              Our team combines primary research, advanced analytics, and industry expertise to deliver actionable intelligence. We offer syndicated reports, custom research, and consulting services tailored to your business needs.

                                                              At Precision Market View, we are committed to quality, transparency, and client satisfaction. Every report is rigorously validated to ensure accuracy and relevance. Our global perspective and local expertise help you understand both the big picture and the finer details of your market.

                                                              Stay informed with Precision Market View. Subscribe to our newsletter for the latest updates and research highlights, and follow us on social media for real-time insights.

                                                              Precision Market View – Clarity for Your Strategic Decisions.

                                                              Business Address

                                                              Head Office

                                                              Office no. A 5010, fifth floor, Solitaire Business Hub, Near Phoenix mall, Pune, Maharashtra 411014

                                                              Contact Information

                                                              Craig Francis

                                                              Business Development Head

                                                              +17162654855

                                                              [email protected]

                                                              Connect With Us

                                                              Secure Payment Partners

                                                              payment image
                                                              RetailLogisticsPackagingAutomotiveHealthcareAgricultureEnergy & PowerFood & BeverageAerospace & DefenseChemicals & MaterialsHospitality and TourismAnimal Nutrition & WellnessConsumer Goods and ServicesReal Estate and ConstructionHome and Property ImprovementTechnology, Media and TelecomManufacturing Products and ServicesFinancial Services and Investment Intelligence

                                                              © 2025 All rights reserved


                                                              Privacy Policy
                                                              Terms and Conditions
                                                              FAQ
                                                              • Home
                                                              • About Us
                                                              • Industries
                                                                • Aerospace & Defense
                                                                • Agriculture
                                                                • Animal Nutrition & Wellness
                                                                • Automotive
                                                                • Chemicals & Materials
                                                                • Consumer Goods and Services
                                                                • Energy & Power
                                                                • Financial Services and Investment Intelligence
                                                                • Food & Beverage
                                                                • Home and Property Improvement
                                                                • Hospitality and Tourism
                                                                • Logistics
                                                                • Manufacturing Products and Services
                                                                • Packaging
                                                                • Professional and Commercial Services
                                                                • Real Estate and Construction
                                                                • Retail
                                                                • Technology, Media and Telecom
                                                                • Healthcare
                                                              • Services
                                                              • Contact
                                                              Main Logo
                                                              • Home
                                                              • About Us
                                                              • Industries
                                                                • Aerospace & Defense
                                                                • Agriculture
                                                                • Animal Nutrition & Wellness
                                                                • Automotive
                                                                • Chemicals & Materials
                                                                • Consumer Goods and Services
                                                                • Energy & Power
                                                                • Financial Services and Investment Intelligence
                                                                • Food & Beverage
                                                                • Home and Property Improvement
                                                                • Hospitality and Tourism
                                                                • Logistics
                                                                • Manufacturing Products and Services
                                                                • Packaging
                                                                • Professional and Commercial Services
                                                                • Real Estate and Construction
                                                                • Retail
                                                                • Technology, Media and Telecom
                                                                • Healthcare
                                                              • Services
                                                              • Contact
                                                              +17162654855
                                                              [email protected]

                                                              +17162654855

                                                              [email protected]

                                                              artwork spiralartwork spiralRelated Reports
                                                              artwork underline

                                                              Clean Coal Technology Industry Growth Projections: Trends to Watch

                                                              Discover the booming Clean Coal Technology market: A comprehensive analysis reveals a CAGR exceeding 4.50% through 2033, driven by CCS, advanced combustion, and stringent environmental regulations. Explore regional trends, key players (Shell, Siemens, GE), and market segmentation for this crucial sector.

                                                              July 2025
                                                              Base Year: 2024
                                                              No Of Pages: 234
                                                              Price: $4750

                                                              Unlocking Insights for East Africa Diesel Genset Market Growth Strategies

                                                              Discover the booming East African diesel genset market! Our comprehensive analysis reveals a CAGR of 4.39% driven by infrastructure development and unreliable power grids. Explore market size, segmentation, key players (Caterpillar, Kirloskar, Wartsila), and growth forecasts for 2025-2033.

                                                              July 2025
                                                              Base Year: 2024
                                                              No Of Pages: 234
                                                              Price: $4750

                                                              Europe Small Wind Turbine Market Charting Growth Trajectories: Analysis and Forecasts 2025-2033

                                                              Discover the booming European small wind turbine market! This comprehensive analysis reveals key trends, growth drivers, and leading companies, projecting significant expansion through 2033. Explore market segmentation, regional breakdowns, and future opportunities in this sustainable energy sector.

                                                              July 2025
                                                              Base Year: 2024
                                                              No Of Pages: 234
                                                              Price: $4750

                                                              Japan Nuclear Power Reactor Decommissioning Market Market Valuation to Hit XXX Million by 2033

                                                              The Japan Nuclear Power Reactor Decommissioning market is booming, driven by aging infrastructure and stringent regulations. Explore market size, CAGR, key players (GE-Hitachi, Toshiba), and regional insights (Asia Pacific) in this comprehensive analysis forecasting growth to 2033. Learn about reactor types, applications, and capacity segments impacting this multi-billion dollar industry.

                                                              July 2025
                                                              Base Year: 2024
                                                              No Of Pages: 197
                                                              Price: $3800

                                                              Turbomachinery Control Systems, Retrofitting, and Ancillary Services Market Dynamics and Forecasts: 2025-2033 Strategic Insights

                                                              Discover the booming Turbomachinery Control Systems market! Our analysis reveals a steady CAGR of 2.94%, driven by retrofitting, ancillary services, and rising demand across power, oil & gas, and chemical sectors. Explore market size, key players, and regional trends through 2033.

                                                              July 2025
                                                              Base Year: 2024
                                                              No Of Pages: 234
                                                              Price: $4750

                                                              Deep Dive into DC Circuit Breaker Industry: Comprehensive Growth Analysis 2025-2033

                                                              The DC Circuit Breaker market is booming, projected to reach \$9.5 billion by 2033, driven by renewable energy growth and technological advancements. Explore market trends, key players (ABB, Siemens, Eaton), and regional insights in this comprehensive analysis.

                                                              July 2025
                                                              Base Year: 2024
                                                              No Of Pages: 234
                                                              Price: $4750

                                                              Cordless Power Tool Battery Industry Growth Opportunities and Market Forecast 2025-2033: A Strategic Analysis

                                                              The cordless power tool battery market is booming, projected to reach [estimated 2033 market size based on CAGR calculation] by 2033, driven by lithium-ion technology advancements and increased demand. Explore market trends, key players (Ryobi, Samsung SDI, Stanley Black & Decker), and regional growth in our comprehensive analysis.

                                                              July 2025
                                                              Base Year: 2024
                                                              No Of Pages: 234
                                                              Price: $4750

                                                              APAC Onshore Wind Turbine Industry Trends and Opportunities for Growth

                                                              Discover the booming APAC onshore wind turbine market! Our analysis projects significant growth from 2025-2033, driven by renewable energy initiatives and technological advancements. Learn about market size, CAGR, and key regional players in this comprehensive report.

                                                              July 2025
                                                              Base Year: 2024
                                                              No Of Pages: 234
                                                              Price: $4750

                                                              Japan High Voltage Direct Current (HVDC) Transmission Systems Market Navigating Dynamics Comprehensive Analysis and Forecasts 2025-2033

                                                              Discover the booming Japan High Voltage Direct Current (HVDC) Transmission Systems market! Learn about its projected 6.51% CAGR, key drivers like renewable energy integration, and leading companies shaping its future. Explore regional breakdowns and market segmentation for insightful analysis.

                                                              July 2025
                                                              Base Year: 2024
                                                              No Of Pages: 197
                                                              Price: $3800

                                                              Netherlands Combined Heat and Power Market Market’s Evolutionary Trends 2025-2033

                                                              Discover the growth potential of the Netherlands combined heat and power (CHP) market. This in-depth analysis reveals key trends, drivers, and restraints impacting this €250 million market, forecasting steady growth through 2033. Explore market segmentation, key players, and the increasing role of renewable energy.

                                                              July 2025
                                                              Base Year: 2024
                                                              No Of Pages: 197
                                                              Price: $3800

                                                              Equatorial Guinea Power EPC Market Industry’s Evolution and Growth Pathways

                                                              Discover the booming Equatorial Guinea power EPC market. This in-depth analysis reveals a $150 million (2025) market projected for strong growth (CAGR > 4.5%), driven by industrial expansion and renewable energy initiatives. Explore key players, market segments (turnkey, EPC), and future trends.

                                                              July 2025
                                                              Base Year: 2024
                                                              No Of Pages: 197
                                                              Price: $3800

                                                              Denmark Offshore Oil And Gas Decommissioning Market Market’s Growth Blueprint

                                                              The Denmark offshore oil and gas decommissioning market is booming, projected to reach €191.5 million by 2033 with a CAGR exceeding 6%. Learn about market drivers, trends, key players (Aker Solutions, Saipem, Halliburton), and the opportunities in this rapidly growing sector.

                                                              July 2025
                                                              Base Year: 2024
                                                              No Of Pages: 197
                                                              Price: $3800

                                                              Solar Backsheet Industry Market Expansion: Growth Outlook 2025-2033

                                                              The global solar backsheet market is booming, with a CAGR exceeding 15.5% to 2033. Discover key market trends, drivers, restraints, and leading companies in this rapidly expanding sector. Learn about fluoropolymer vs. non-fluoropolymer backsheets and regional market analysis.

                                                              July 2025
                                                              Base Year: 2024
                                                              No Of Pages: 180
                                                              Price: $4750

                                                              Argentina Solar Energy Market to Grow at XX CAGR: Market Size Analysis and Forecasts 2025-2033

                                                              Discover the booming Argentina solar energy market! Explore its impressive 13%+ CAGR, key drivers, leading companies (Central Puerto SA, YPF Luz, etc.), and future projections to 2033. Learn about investment opportunities and market trends in this rapidly expanding sector.

                                                              July 2025
                                                              Base Year: 2024
                                                              No Of Pages: 197
                                                              Price: $3800

                                                              Strategic Trends in US Oil & Gas Upstream Market Market 2025-2033

                                                              Dive into the dynamic US Oil & Gas Upstream market analysis. Explore a projected $500B market in 2025, growing at a CAGR of 2.30% until 2033. Discover key drivers, restraints, regional breakdowns, and the dominant players shaping this crucial energy sector.

                                                              July 2025
                                                              Base Year: 2024
                                                              No Of Pages: 197
                                                              Price: $3800

                                                              Unlocking the Future of Measurement While Drilling Industry: Growth and Trends 2025-2033

                                                              The Measurement While Drilling (MWD) market is booming, projected to exceed a multi-billion dollar valuation by 2033 with a CAGR >7%. This in-depth analysis explores key drivers, trends, restraints, and regional market share, highlighting opportunities for leading companies like Schlumberger and Halliburton. Discover the latest insights on MWD technology and its impact on the oil & gas industry.

                                                              July 2025
                                                              Base Year: 2024
                                                              No Of Pages: 234
                                                              Price: $4750

                                                              France Biomass Energy Industry Industry Analysis and Consumer Behavior

                                                              Discover the booming France biomass energy market! Our analysis reveals a CAGR exceeding 7.40%, driven by strong government support and environmental concerns. Explore market size projections, key players (Andritz Group, Engie SA, Vestas), and future trends in this dynamic sector.

                                                              July 2025
                                                              Base Year: 2024
                                                              No Of Pages: 197
                                                              Price: $3800

                                                              Comprehensive Review of France Tidal Power Market Growth Potential

                                                              Discover the booming France Tidal Power Market forecast to 2033! This in-depth analysis reveals a CAGR of 4.54%, driven by government incentives and technological advancements in tidal stream generation. Explore key players, market segments (tidal barrage, stream generation, converters), and growth challenges.

                                                              July 2025
                                                              Base Year: 2024
                                                              No Of Pages: 197
                                                              Price: $3800

                                                              Exploring Global Power Factor Correction Units Market Market Evolution 2025-2033

                                                              Discover the booming global Power Factor Correction (PFC) Units market, projected to reach [estimated 2033 market size] by 2033, growing at a CAGR of 7.10%. This in-depth analysis explores key drivers, trends, restraints, and leading companies like ABB, Schneider Electric, and Siemens, shaping the future of energy efficiency. Learn more about PFC unit market size, growth, and regional shares.

                                                              July 2025
                                                              Base Year: 2024
                                                              No Of Pages: 234
                                                              Price: $4750

                                                              Lead Acid Battery Scrap Market Market’s Technological Evolution: Trends and Analysis 2025-2033

                                                              The global lead acid battery scrap market is booming, projected to reach \$XX billion by 2033, driven by rising EV adoption and stricter environmental regulations. Learn about market trends, key players (Gravita, Exide, Aqua Metals), and growth opportunities in this comprehensive analysis.

                                                              July 2025
                                                              Base Year: 2024
                                                              No Of Pages: 234
                                                              Price: $4750