
Key Insights
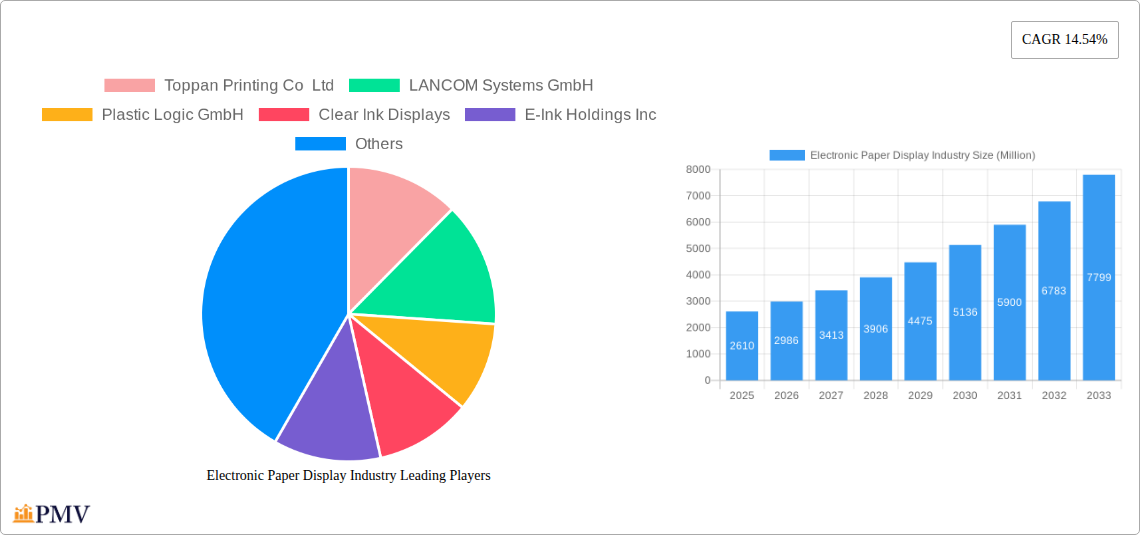
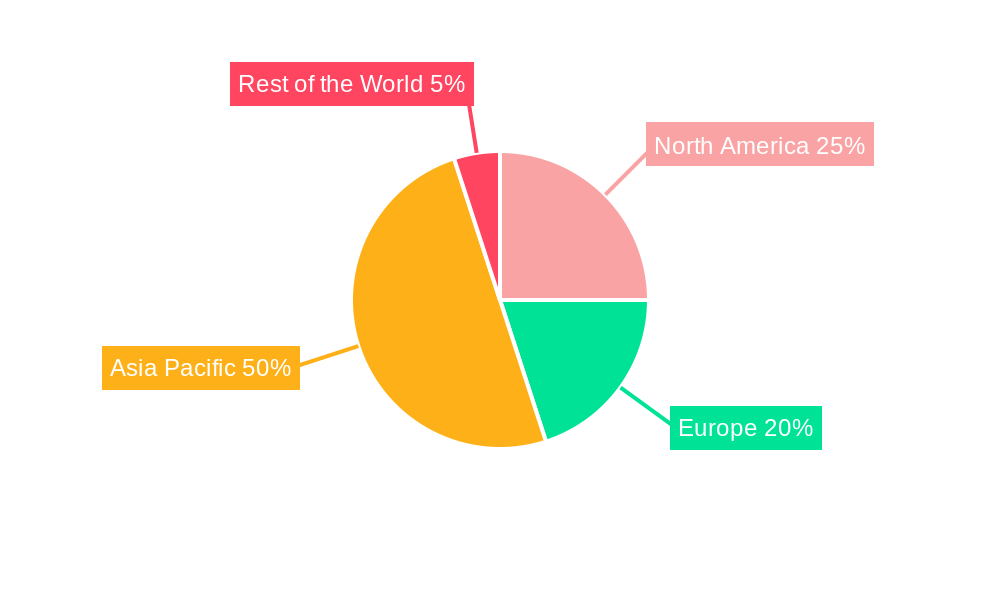
The Electronic Paper Display (EPD) industry is experiencing robust growth, projected to reach a market size of $2.61 billion in 2025, exhibiting a Compound Annual Growth Rate (CAGR) of 14.54% from 2019 to 2033. This expansion is fueled by several key drivers. The increasing demand for energy-efficient displays in consumer electronics like e-readers and wearables is a significant factor. The adoption of EPDs in digital signage and retail applications, including electronic shelf labels (ESLs) and retail dividers, is also contributing significantly to market growth. Furthermore, the growing focus on sustainable technologies and the inherent low-power consumption of EPDs are boosting market appeal. While some challenges exist, such as limitations in color reproduction compared to LCD or OLED technologies and higher initial production costs, these are being mitigated by ongoing technological advancements and economies of scale. The diverse end-user segments, including consumer electronics, institutional, retail, and others like healthcare and industrial applications, contribute to the market's resilience and provide ample opportunities for future expansion. The Asia-Pacific region is expected to dominate the market due to the high concentration of manufacturing facilities and growing consumer electronics market.
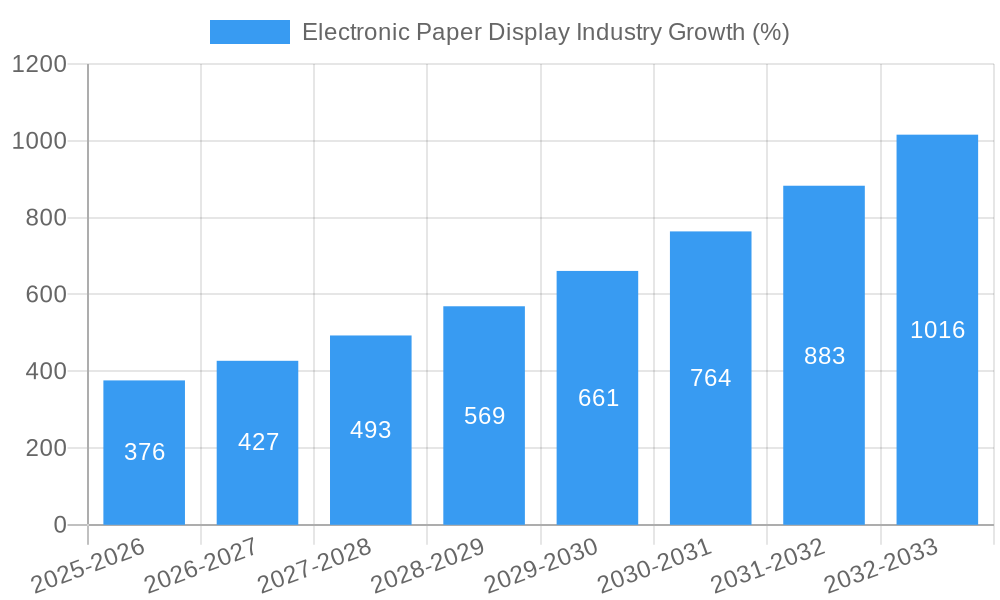
The forecast for the EPD market paints a picture of sustained growth throughout the 2025-2033 period. To maintain this trajectory, manufacturers are focusing on improving color quality, response times, and flexibility of EPDs. Furthermore, strategic partnerships and collaborations between EPD manufacturers and consumer electronics companies are becoming increasingly crucial in driving innovation and expanding market reach. The integration of EPD technology into emerging applications, such as smart packaging and architectural applications, is another key factor contributing to market expansion. Competition is expected to remain intense amongst major players, spurring innovation and potentially leading to price reductions that further fuel adoption. The long-term outlook for the EPD industry remains positive, driven by the persistent demand for energy-efficient, low-power consumption displays in a wide array of applications.
Electronic Paper Display (EPD) Industry Report: 2019-2033
This comprehensive report provides a detailed analysis of the Electronic Paper Display (EPD) industry, covering market dynamics, competitive landscape, technological advancements, and future growth prospects. The study period spans from 2019 to 2033, with 2025 serving as both the base and estimated year. The forecast period is 2025-2033, and the historical period covers 2019-2024. The report's findings are crucial for investors, manufacturers, and industry stakeholders seeking to understand and capitalize on the evolving EPD market. The global market size in 2025 is estimated at $XX Million.
Electronic Paper Display Industry Market Structure & Competitive Dynamics
This section analyzes the Electronic Paper Display (EPD) market's structure and competitive dynamics, considering market concentration, innovation ecosystems, regulatory frameworks, product substitutes, end-user trends, and mergers and acquisitions (M&A) activities. The industry exhibits a moderately concentrated structure with several key players holding significant market share. However, the presence of numerous smaller companies fosters competition and innovation.
- Market Concentration: The top 5 players account for approximately XX% of the global market share in 2025. This indicates a moderately concentrated market with opportunities for both established players and new entrants.
- Innovation Ecosystems: Significant R&D investments are driving innovations in display technologies, materials, and applications, leading to improved product features and lower manufacturing costs. Collaboration between companies and research institutions is enhancing the innovation ecosystem.
- Regulatory Frameworks: Government policies supporting sustainable technologies and digitalization positively impact market growth. However, varying regulatory standards across different regions might present challenges for global players.
- Product Substitutes: LCD and OLED technologies are primary substitutes. However, EPD's unique advantages, such as low power consumption and sunlight readability, ensure its niche and continued growth.
- End-User Trends: The growing demand for energy-efficient displays and the increasing adoption of e-readers, digital signage, and wearable devices are key drivers of market growth.
- M&A Activities: The EPD sector has witnessed several M&A activities in recent years, with deal values totaling approximately $XX Million. These activities primarily focus on expanding product portfolios, gaining access to new technologies, and enhancing market presence.
Electronic Paper Display Industry Industry Trends & Insights
This section delves into the key trends and insights shaping the Electronic Paper Display (EPD) industry. Market growth is driven by several factors including the increasing demand for portable and energy-efficient devices, advancements in display technology, and the expanding applications across various sectors. The industry's Compound Annual Growth Rate (CAGR) during the forecast period (2025-2033) is projected to be XX%. Market penetration in key segments is expected to increase significantly, driven by the cost reduction and improved performance of EPDs.
Technological disruptions, particularly in material science and manufacturing processes, are improving EPD's resolution, color capabilities, and refresh rates, thus broadening its applications. Consumer preferences for sustainable and eco-friendly products are positively influencing the market. Competitive dynamics remain intense, with established players and new entrants focusing on product differentiation, cost optimization, and strategic partnerships.
Dominant Markets & Segments in Electronic Paper Display Industry
This section identifies the leading regions, countries, and segments within the Electronic Paper Display (EPD) market. North America and Asia-Pacific currently hold significant market shares, driven by high consumer electronics adoption and increasing digital signage deployments.
- Consumer Electronics: This segment dominates the EPD market, driven by the widespread adoption of e-readers and the increasing popularity of wearables. Key drivers include the rising disposable income and the preference for energy-efficient devices.
- Institutional (Signage, Posters, etc.): The growing demand for digital signage in public spaces, retail outlets, and educational institutions fuels the growth of this segment. Government initiatives promoting digitalization and smart city initiatives are key drivers.
- Retail (Dividers and Electronic Shelf Displays): The use of EPDs in retail is expanding rapidly due to their ability to showcase dynamic pricing and product information. Technological advancements in display quality and cost reduction are fueling this trend.
- Other End Users: This segment encompasses diverse applications in healthcare (medical devices, patient information displays), transportation (electronic ticketing, public transit information), industrial/smart packaging (product tracking and labeling), and architectural applications. The growing adoption of IoT and Industry 4.0 initiatives is a major driver.
Electronic Paper Display Industry Product Innovations
Recent years have witnessed significant advancements in Electronic Paper Display (EPD) technology, encompassing improved color capabilities, faster refresh rates, and enhanced flexibility. This has broadened the range of applications, from e-readers and digital signage to smart packaging and flexible displays. These innovations have improved the competitive advantages of EPDs by offering unique characteristics like low power consumption and sunlight readability. The integration of new materials and advanced manufacturing techniques continues to drive further enhancements in the future.
Report Segmentation & Scope
The report segments the Electronic Paper Display (EPD) market based on end-user applications: Consumer Electronics (wearables, e-readers, mobile devices); Institutional (signage, posters); Retail (dividers and electronic shelf displays); and Other End Users (media & entertainment, transportation, healthcare, industrial/smart packaging, and architectural applications). Each segment is analyzed based on market size, growth projections, and competitive dynamics. The report also considers regional variations in market performance and growth trajectories, with an estimated market size of $XX Million for the global market in 2025.
Key Drivers of Electronic Paper Display Industry Growth
The Electronic Paper Display (EPD) industry's growth is fueled by several key factors. Firstly, the rising demand for energy-efficient displays is driving the adoption of EPDs in various applications. Secondly, the growing use of digital signage and e-readers is significantly increasing market demand. Thirdly, technological advancements leading to better resolution, color, and refresh rates broaden the range of applications and enhance the competitiveness of EPDs. Finally, government initiatives promoting digitalization and sustainable technologies provide further impetus to market expansion.
Challenges in the Electronic Paper Display Industry Sector
The Electronic Paper Display (EPD) industry faces challenges such as the high initial cost of production compared to LCD and OLED technologies, limiting its wider adoption. Furthermore, the relatively slower refresh rates of some EPDs compared to other display technologies pose a limitation in certain applications. Competition from established display technologies and potential supply chain disruptions can also impact market growth. The overall impact of these challenges is estimated to reduce the market growth rate by approximately XX% during the forecast period.
Leading Players in the Electronic Paper Display Industry Market
- Toppan Printing Co Ltd
- LANCOM Systems GmbH
- Plastic Logic GmbH
- Clear Ink Displays
- E-Ink Holdings Inc
- Guangzhou Oed Technologies Co Ltd
- Pervasive Displays Inc
- Microtips Technolog
- Adafruit Industries
Key Developments in Electronic Paper Display Industry Sector
- June 2022: Boston-based company Modos unveiled its paper laptop concept, utilizing a large electronic paper display to offer advantages like extended battery life, reduced eye strain, and improved sunlight readability. This development could significantly impact the laptop market and further boost EPD adoption.
- March 2023: E Ink Holdings Inc. and Sharp Corporation partnered to launch ePaper posters using E Ink's technology, indicating increased collaboration between leading players and expansion into new market segments like digital signage. This partnership is expected to significantly increase market penetration within the digital signage sector by approximately XX% in the next 5 years.
Strategic Electronic Paper Display Industry Market Outlook
The Electronic Paper Display (EPD) market exhibits significant growth potential driven by technological advancements, expanding applications, and a rising preference for energy-efficient and sustainable products. Strategic opportunities exist in developing high-resolution, full-color EPDs for diverse applications, including flexible displays and smart packaging. Partnerships and collaborations between technology providers and industry players will be crucial for driving innovation and market expansion. The long-term outlook for the EPD market remains promising, with substantial potential for growth and market share expansion in the coming years.
Electronic Paper Display Industry Segmentation
-
1. End User
- 1.1. Consumer
- 1.2. Institutional (Signage, Posters, etc.)
- 1.3. Retail (Dividers and Electronic Shelf Displays)
- 1.4. Other En
Electronic Paper Display Industry Segmentation By Geography
- 1. North America
- 2. Europe
- 3. Asia
- 4. Australia and New Zealand
- 5. Latin America
- 6. Middle East and Africa
Electronic Paper Display Industry REPORT HIGHLIGHTS
| Aspects | Details |
|---|---|
| Study Period | 2019-2033 |
| Base Year | 2024 |
| Estimated Year | 2025 |
| Forecast Period | 2025-2033 |
| Historical Period | 2019-2024 |
| Growth Rate | CAGR of 14.54% from 2019-2033 |
| Segmentation |
|
Table of Contents
- 1. Introduction
- 1.1. Research Scope
- 1.2. Market Segmentation
- 1.3. Research Methodology
- 1.4. Definitions and Assumptions
- 2. Executive Summary
- 2.1. Introduction
- 3. Market Dynamics
- 3.1. Introduction
- 3.2. Market Drivers
- 3.2.1. Technological Innovations in the Field of E-displays; Growing Applications of E-display Across Various End-user Industries
- 3.3. Market Restrains
- 3.3.1. Relatively Low Levels of Awareness and Regulatory Challenges
- 3.4. Market Trends
- 3.4.1. The Consumer Electronics Industry is Expected to Hold Significant Market Share
- 4. Market Factor Analysis
- 4.1. Porters Five Forces
- 4.2. Supply/Value Chain
- 4.3. PESTEL analysis
- 4.4. Market Entropy
- 4.5. Patent/Trademark Analysis
- 5. Global Electronic Paper Display Industry Analysis, Insights and Forecast, 2019-2031
- 5.1. Market Analysis, Insights and Forecast - by End User
- 5.1.1. Consumer
- 5.1.2. Institutional (Signage, Posters, etc.)
- 5.1.3. Retail (Dividers and Electronic Shelf Displays)
- 5.1.4. Other En
- 5.2. Market Analysis, Insights and Forecast - by Region
- 5.2.1. North America
- 5.2.2. Europe
- 5.2.3. Asia
- 5.2.4. Australia and New Zealand
- 5.2.5. Latin America
- 5.2.6. Middle East and Africa
- 5.1. Market Analysis, Insights and Forecast - by End User
- 6. North America Electronic Paper Display Industry Analysis, Insights and Forecast, 2019-2031
- 6.1. Market Analysis, Insights and Forecast - by End User
- 6.1.1. Consumer
- 6.1.2. Institutional (Signage, Posters, etc.)
- 6.1.3. Retail (Dividers and Electronic Shelf Displays)
- 6.1.4. Other En
- 6.1. Market Analysis, Insights and Forecast - by End User
- 7. Europe Electronic Paper Display Industry Analysis, Insights and Forecast, 2019-2031
- 7.1. Market Analysis, Insights and Forecast - by End User
- 7.1.1. Consumer
- 7.1.2. Institutional (Signage, Posters, etc.)
- 7.1.3. Retail (Dividers and Electronic Shelf Displays)
- 7.1.4. Other En
- 7.1. Market Analysis, Insights and Forecast - by End User
- 8. Asia Electronic Paper Display Industry Analysis, Insights and Forecast, 2019-2031
- 8.1. Market Analysis, Insights and Forecast - by End User
- 8.1.1. Consumer
- 8.1.2. Institutional (Signage, Posters, etc.)
- 8.1.3. Retail (Dividers and Electronic Shelf Displays)
- 8.1.4. Other En
- 8.1. Market Analysis, Insights and Forecast - by End User
- 9. Australia and New Zealand Electronic Paper Display Industry Analysis, Insights and Forecast, 2019-2031
- 9.1. Market Analysis, Insights and Forecast - by End User
- 9.1.1. Consumer
- 9.1.2. Institutional (Signage, Posters, etc.)
- 9.1.3. Retail (Dividers and Electronic Shelf Displays)
- 9.1.4. Other En
- 9.1. Market Analysis, Insights and Forecast - by End User
- 10. Latin America Electronic Paper Display Industry Analysis, Insights and Forecast, 2019-2031
- 10.1. Market Analysis, Insights and Forecast - by End User
- 10.1.1. Consumer
- 10.1.2. Institutional (Signage, Posters, etc.)
- 10.1.3. Retail (Dividers and Electronic Shelf Displays)
- 10.1.4. Other En
- 10.1. Market Analysis, Insights and Forecast - by End User
- 11. Middle East and Africa Electronic Paper Display Industry Analysis, Insights and Forecast, 2019-2031
- 11.1. Market Analysis, Insights and Forecast - by End User
- 11.1.1. Consumer
- 11.1.2. Institutional (Signage, Posters, etc.)
- 11.1.3. Retail (Dividers and Electronic Shelf Displays)
- 11.1.4. Other En
- 11.1. Market Analysis, Insights and Forecast - by End User
- 12. North America Electronic Paper Display Industry Analysis, Insights and Forecast, 2019-2031
- 12.1. Market Analysis, Insights and Forecast - By Country/Sub-region
- 12.1.1.
- 13. Europe Electronic Paper Display Industry Analysis, Insights and Forecast, 2019-2031
- 13.1. Market Analysis, Insights and Forecast - By Country/Sub-region
- 13.1.1.
- 14. Asia Pacific Electronic Paper Display Industry Analysis, Insights and Forecast, 2019-2031
- 14.1. Market Analysis, Insights and Forecast - By Country/Sub-region
- 14.1.1.
- 15. Rest of the World Electronic Paper Display Industry Analysis, Insights and Forecast, 2019-2031
- 15.1. Market Analysis, Insights and Forecast - By Country/Sub-region
- 15.1.1.
- 16. Competitive Analysis
- 16.1. Global Market Share Analysis 2024
- 16.2. Company Profiles
- 16.2.1 Toppan Printing Co Ltd
- 16.2.1.1. Overview
- 16.2.1.2. Products
- 16.2.1.3. SWOT Analysis
- 16.2.1.4. Recent Developments
- 16.2.1.5. Financials (Based on Availability)
- 16.2.2 LANCOM Systems GmbH
- 16.2.2.1. Overview
- 16.2.2.2. Products
- 16.2.2.3. SWOT Analysis
- 16.2.2.4. Recent Developments
- 16.2.2.5. Financials (Based on Availability)
- 16.2.3 Plastic Logic GmbH
- 16.2.3.1. Overview
- 16.2.3.2. Products
- 16.2.3.3. SWOT Analysis
- 16.2.3.4. Recent Developments
- 16.2.3.5. Financials (Based on Availability)
- 16.2.4 Clear Ink Displays
- 16.2.4.1. Overview
- 16.2.4.2. Products
- 16.2.4.3. SWOT Analysis
- 16.2.4.4. Recent Developments
- 16.2.4.5. Financials (Based on Availability)
- 16.2.5 E-Ink Holdings Inc
- 16.2.5.1. Overview
- 16.2.5.2. Products
- 16.2.5.3. SWOT Analysis
- 16.2.5.4. Recent Developments
- 16.2.5.5. Financials (Based on Availability)
- 16.2.6 Guangzhou Oed Technologies Co Ltd
- 16.2.6.1. Overview
- 16.2.6.2. Products
- 16.2.6.3. SWOT Analysis
- 16.2.6.4. Recent Developments
- 16.2.6.5. Financials (Based on Availability)
- 16.2.7 Pervasive Displays Inc
- 16.2.7.1. Overview
- 16.2.7.2. Products
- 16.2.7.3. SWOT Analysis
- 16.2.7.4. Recent Developments
- 16.2.7.5. Financials (Based on Availability)
- 16.2.8 Microtips Technolog
- 16.2.8.1. Overview
- 16.2.8.2. Products
- 16.2.8.3. SWOT Analysis
- 16.2.8.4. Recent Developments
- 16.2.8.5. Financials (Based on Availability)
- 16.2.9 Adafruit Industries
- 16.2.9.1. Overview
- 16.2.9.2. Products
- 16.2.9.3. SWOT Analysis
- 16.2.9.4. Recent Developments
- 16.2.9.5. Financials (Based on Availability)
- 16.2.1 Toppan Printing Co Ltd
List of Figures
- Figure 1: Global Electronic Paper Display Industry Revenue Breakdown (Million, %) by Region 2024 & 2032
- Figure 2: North America Electronic Paper Display Industry Revenue (Million), by Country 2024 & 2032
- Figure 3: North America Electronic Paper Display Industry Revenue Share (%), by Country 2024 & 2032
- Figure 4: Europe Electronic Paper Display Industry Revenue (Million), by Country 2024 & 2032
- Figure 5: Europe Electronic Paper Display Industry Revenue Share (%), by Country 2024 & 2032
- Figure 6: Asia Pacific Electronic Paper Display Industry Revenue (Million), by Country 2024 & 2032
- Figure 7: Asia Pacific Electronic Paper Display Industry Revenue Share (%), by Country 2024 & 2032
- Figure 8: Rest of the World Electronic Paper Display Industry Revenue (Million), by Country 2024 & 2032
- Figure 9: Rest of the World Electronic Paper Display Industry Revenue Share (%), by Country 2024 & 2032
- Figure 10: North America Electronic Paper Display Industry Revenue (Million), by End User 2024 & 2032
- Figure 11: North America Electronic Paper Display Industry Revenue Share (%), by End User 2024 & 2032
- Figure 12: North America Electronic Paper Display Industry Revenue (Million), by Country 2024 & 2032
- Figure 13: North America Electronic Paper Display Industry Revenue Share (%), by Country 2024 & 2032
- Figure 14: Europe Electronic Paper Display Industry Revenue (Million), by End User 2024 & 2032
- Figure 15: Europe Electronic Paper Display Industry Revenue Share (%), by End User 2024 & 2032
- Figure 16: Europe Electronic Paper Display Industry Revenue (Million), by Country 2024 & 2032
- Figure 17: Europe Electronic Paper Display Industry Revenue Share (%), by Country 2024 & 2032
- Figure 18: Asia Electronic Paper Display Industry Revenue (Million), by End User 2024 & 2032
- Figure 19: Asia Electronic Paper Display Industry Revenue Share (%), by End User 2024 & 2032
- Figure 20: Asia Electronic Paper Display Industry Revenue (Million), by Country 2024 & 2032
- Figure 21: Asia Electronic Paper Display Industry Revenue Share (%), by Country 2024 & 2032
- Figure 22: Australia and New Zealand Electronic Paper Display Industry Revenue (Million), by End User 2024 & 2032
- Figure 23: Australia and New Zealand Electronic Paper Display Industry Revenue Share (%), by End User 2024 & 2032
- Figure 24: Australia and New Zealand Electronic Paper Display Industry Revenue (Million), by Country 2024 & 2032
- Figure 25: Australia and New Zealand Electronic Paper Display Industry Revenue Share (%), by Country 2024 & 2032
- Figure 26: Latin America Electronic Paper Display Industry Revenue (Million), by End User 2024 & 2032
- Figure 27: Latin America Electronic Paper Display Industry Revenue Share (%), by End User 2024 & 2032
- Figure 28: Latin America Electronic Paper Display Industry Revenue (Million), by Country 2024 & 2032
- Figure 29: Latin America Electronic Paper Display Industry Revenue Share (%), by Country 2024 & 2032
- Figure 30: Middle East and Africa Electronic Paper Display Industry Revenue (Million), by End User 2024 & 2032
- Figure 31: Middle East and Africa Electronic Paper Display Industry Revenue Share (%), by End User 2024 & 2032
- Figure 32: Middle East and Africa Electronic Paper Display Industry Revenue (Million), by Country 2024 & 2032
- Figure 33: Middle East and Africa Electronic Paper Display Industry Revenue Share (%), by Country 2024 & 2032
List of Tables
- Table 1: Global Electronic Paper Display Industry Revenue Million Forecast, by Region 2019 & 2032
- Table 2: Global Electronic Paper Display Industry Revenue Million Forecast, by End User 2019 & 2032
- Table 3: Global Electronic Paper Display Industry Revenue Million Forecast, by Region 2019 & 2032
- Table 4: Global Electronic Paper Display Industry Revenue Million Forecast, by Country 2019 & 2032
- Table 5: Electronic Paper Display Industry Revenue (Million) Forecast, by Application 2019 & 2032
- Table 6: Global Electronic Paper Display Industry Revenue Million Forecast, by Country 2019 & 2032
- Table 7: Electronic Paper Display Industry Revenue (Million) Forecast, by Application 2019 & 2032
- Table 8: Global Electronic Paper Display Industry Revenue Million Forecast, by Country 2019 & 2032
- Table 9: Electronic Paper Display Industry Revenue (Million) Forecast, by Application 2019 & 2032
- Table 10: Global Electronic Paper Display Industry Revenue Million Forecast, by Country 2019 & 2032
- Table 11: Electronic Paper Display Industry Revenue (Million) Forecast, by Application 2019 & 2032
- Table 12: Global Electronic Paper Display Industry Revenue Million Forecast, by End User 2019 & 2032
- Table 13: Global Electronic Paper Display Industry Revenue Million Forecast, by Country 2019 & 2032
- Table 14: Global Electronic Paper Display Industry Revenue Million Forecast, by End User 2019 & 2032
- Table 15: Global Electronic Paper Display Industry Revenue Million Forecast, by Country 2019 & 2032
- Table 16: Global Electronic Paper Display Industry Revenue Million Forecast, by End User 2019 & 2032
- Table 17: Global Electronic Paper Display Industry Revenue Million Forecast, by Country 2019 & 2032
- Table 18: Global Electronic Paper Display Industry Revenue Million Forecast, by End User 2019 & 2032
- Table 19: Global Electronic Paper Display Industry Revenue Million Forecast, by Country 2019 & 2032
- Table 20: Global Electronic Paper Display Industry Revenue Million Forecast, by End User 2019 & 2032
- Table 21: Global Electronic Paper Display Industry Revenue Million Forecast, by Country 2019 & 2032
- Table 22: Global Electronic Paper Display Industry Revenue Million Forecast, by End User 2019 & 2032
- Table 23: Global Electronic Paper Display Industry Revenue Million Forecast, by Country 2019 & 2032
Frequently Asked Questions
1. What is the projected Compound Annual Growth Rate (CAGR) of the Electronic Paper Display Industry?
The projected CAGR is approximately 14.54%.
2. Which companies are prominent players in the Electronic Paper Display Industry?
Key companies in the market include Toppan Printing Co Ltd, LANCOM Systems GmbH, Plastic Logic GmbH, Clear Ink Displays, E-Ink Holdings Inc, Guangzhou Oed Technologies Co Ltd, Pervasive Displays Inc, Microtips Technolog, Adafruit Industries.
3. What are the main segments of the Electronic Paper Display Industry?
The market segments include End User.
4. Can you provide details about the market size?
The market size is estimated to be USD 2.61 Million as of 2022.
5. What are some drivers contributing to market growth?
Technological Innovations in the Field of E-displays; Growing Applications of E-display Across Various End-user Industries.
6. What are the notable trends driving market growth?
The Consumer Electronics Industry is Expected to Hold Significant Market Share.
7. Are there any restraints impacting market growth?
Relatively Low Levels of Awareness and Regulatory Challenges.
8. Can you provide examples of recent developments in the market?
March 2023: E Ink Holdings Inc., the creator, pioneer, and one of the global commercial leaders in ePaper technology, and Sharp Corporation, one of the leading global companies in the digital signage sector, announced a partnership to bring ePaper posters employing E Ink's technology to market.
9. What pricing options are available for accessing the report?
Pricing options include single-user, multi-user, and enterprise licenses priced at USD 4750, USD 5250, and USD 8750 respectively.
10. Is the market size provided in terms of value or volume?
The market size is provided in terms of value, measured in Million.
11. Are there any specific market keywords associated with the report?
Yes, the market keyword associated with the report is "Electronic Paper Display Industry," which aids in identifying and referencing the specific market segment covered.
12. How do I determine which pricing option suits my needs best?
The pricing options vary based on user requirements and access needs. Individual users may opt for single-user licenses, while businesses requiring broader access may choose multi-user or enterprise licenses for cost-effective access to the report.
13. Are there any additional resources or data provided in the Electronic Paper Display Industry report?
While the report offers comprehensive insights, it's advisable to review the specific contents or supplementary materials provided to ascertain if additional resources or data are available.
14. How can I stay updated on further developments or reports in the Electronic Paper Display Industry?
To stay informed about further developments, trends, and reports in the Electronic Paper Display Industry, consider subscribing to industry newsletters, following relevant companies and organizations, or regularly checking reputable industry news sources and publications.
Methodology
Step 1 - Identification of Relevant Samples Size from Population Database


Step 2 - Approaches for Defining Global Market Size (Value, Volume* & Price*)

Note*: In applicable scenarios
Step 3 - Data Sources
Primary Research
- Web Analytics
- Survey Reports
- Research Institute
- Latest Research Reports
- Opinion Leaders
Secondary Research
- Annual Reports
- White Paper
- Latest Press Release
- Industry Association
- Paid Database
- Investor Presentations

Step 4 - Data Triangulation
Involves using different sources of information in order to increase the validity of a study
These sources are likely to be stakeholders in a program - participants, other researchers, program staff, other community members, and so on.
Then we put all data in single framework & apply various statistical tools to find out the dynamic on the market.
During the analysis stage, feedback from the stakeholder groups would be compared to determine areas of agreement as well as areas of divergence


