


Key Insights
The global Elastography Imaging market is projected to reach approximately $12.13 billion by 2025, exhibiting a Compound Annual Growth Rate (CAGR) of 9.05% through 2033. This growth is driven by the increasing adoption of minimally invasive diagnostics and the superior diagnostic capabilities of elastography over conventional methods. Its ability to assess tissue stiffness is crucial for disease progression monitoring and treatment response evaluation, leading to its integration across medical specialties. Key drivers include the rising prevalence of chronic diseases such as liver fibrosis and cancer, where tissue stiffness is a critical diagnostic marker, coupled with advancements in ultrasound and MRI technologies that enhance elastography's resolution and accuracy. Government initiatives promoting early disease detection and the demand for advanced medical imaging solutions also significantly contribute to market expansion.
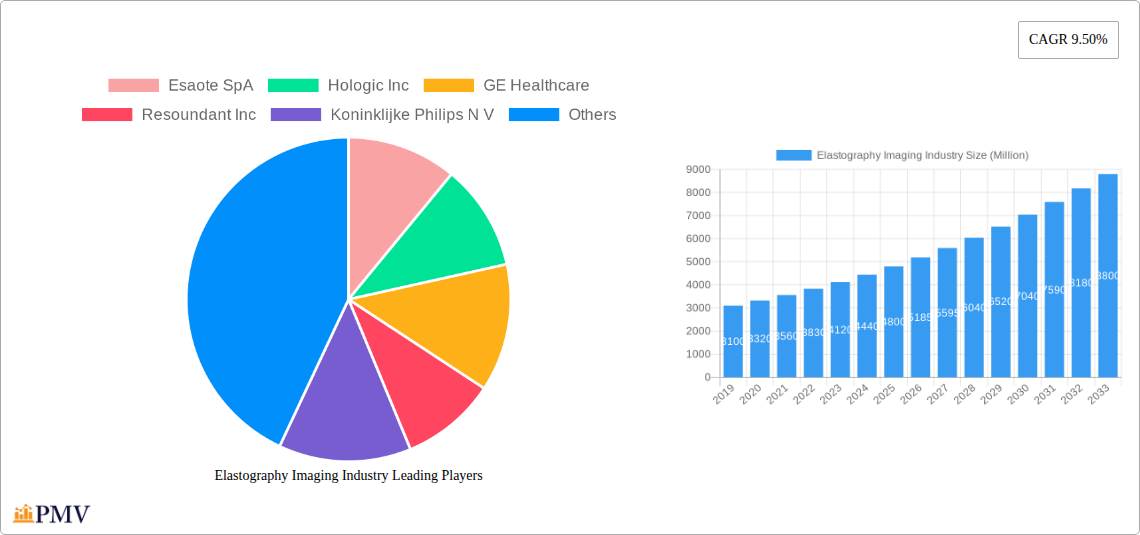
Elastography Imaging Industry Market Size (In Billion)

Market segmentation reveals that Ultrasound Elastography leads in adoption due to its cost-effectiveness and accessibility, while Magnetic Resonance Elastography offers superior precision for deeper tissue assessment. Radiology and Cardiology are expected to dominate applications, driven by elastography's role in diagnosing liver diseases, cardiac conditions, and oncological applications. Urology and Obstetrics/Gynecology also present significant growth opportunities. Hospitals are the primary end-users, followed by ambulatory surgical centers and specialized diagnostic centers. Geographically, North America is anticipated to maintain its leading position due to high healthcare expenditure and rapid technological adoption, while the Asia Pacific region is projected for the fastest growth, supported by developing healthcare infrastructure, increasing medical tourism, and a large patient pool.

Elastography Imaging Industry Company Market Share
This comprehensive report provides critical insights into the global Elastography Imaging Industry. Covering the historical period of 2019-2024, with a base year of 2025 and a forecast period extending to 2033, this study offers actionable intelligence on market structure, key trends, dominant segments, product innovations, growth drivers, challenges, and leading players. The report details technological advancements and market dynamics shaping the future of elastography, aiding stakeholders in driving business strategy and investment decisions.
Elastography Imaging Industry Market Structure & Competitive Dynamics
The Elastography Imaging Industry exhibits a moderately concentrated market structure, characterized by the presence of a few dominant global players alongside a growing number of specialized innovators. The innovation ecosystem is robust, fueled by continuous research and development in advanced imaging techniques and software algorithms. Regulatory frameworks, primarily governed by bodies like the FDA and EMA, play a crucial role in product approval and market access, influencing product lifecycles and market entry strategies. Product substitutes, such as traditional biopsy methods, are gradually being displaced by less invasive elastography techniques, particularly for liver fibrosis assessment and breast lesion characterization. End-user trends are shifting towards greater adoption of non-invasive diagnostic tools, driven by patient comfort, reduced procedure time, and cost-effectiveness. Merger and acquisition (M&A) activities have been strategic, with larger companies acquiring niche players to expand their product portfolios and technological capabilities. For instance, recent M&A deals in the broader medical imaging sector indicate a trend towards consolidation to achieve economies of scale and enhance R&D prowess, with deal values often in the range of several hundred million to over a billion dollars.
- Market Concentration: Moderate, with key players holding significant market share.
- Innovation Ecosystem: Driven by AI integration, advanced signal processing, and novel probe designs.
- Regulatory Frameworks: Essential for market access and ensuring diagnostic accuracy and patient safety.
- Product Substitutes: Traditional biopsies are increasingly replaced by elastography for non-invasive assessments.
- End-User Trends: Growing demand for minimally invasive, accurate, and cost-effective diagnostic solutions.
- M&A Activities: Strategic acquisitions to bolster product offerings and technological advancements.
Elastography Imaging Industry Industry Trends & Insights
The Elastography Imaging Industry is poised for significant expansion, driven by a confluence of technological advancements, increasing healthcare expenditure, and a growing awareness of the benefits of non-invasive diagnostic techniques. The market is experiencing a robust Compound Annual Growth Rate (CAGR), projected to be in the double digits over the forecast period. Technological disruptions, including the integration of artificial intelligence (AI) for automated lesion detection and quantification, and the development of higher frequency ultrasound probes, are revolutionizing diagnostic capabilities. Consumer preferences are increasingly leaning towards methods that minimize patient discomfort and recovery time, making elastography an attractive alternative to invasive procedures. Competitive dynamics are intensifying, with companies differentiating themselves through superior image quality, advanced quantification features, workflow integration, and comprehensive clinical support. The growing prevalence of chronic diseases, particularly liver conditions and cardiovascular diseases, where stiffness assessment is crucial, serves as a major market growth driver. Furthermore, expanding applications in radiology, cardiology, and oncology are further propelling market penetration. The global market size for elastography imaging is estimated to reach several billion dollars by the end of the forecast period, with continuous innovation and increasing clinical adoption paving the way for sustained growth.
Dominant Markets & Segments in Elastography Imaging Industry
The Ultrasound Elastography modality is currently dominating the Elastography Imaging Industry, largely due to its widespread availability, relatively lower cost compared to MRI, and established clinical utility across various applications. Within this modality, Radiology represents the leading application segment, driven by the critical role of tissue stiffness assessment in diagnosing and monitoring a wide range of conditions, including liver fibrosis, breast lesions, and thyroid nodules.
Dominant Modality: Ultrasound Elastography
- Key Drivers: Cost-effectiveness, broad accessibility in clinical settings, and established diagnostic protocols.
- Market Penetration: High across diverse healthcare facilities globally.
- Technological Advancements: Continuous improvements in shear wave elastography (SWE) and real-time tissue elastography (RTE) are enhancing accuracy and clinical confidence.
- Economic Policies: Government initiatives promoting early disease detection and preventative healthcare indirectly support the adoption of ultrasound elastography.
- Infrastructure: Existing ultrasound infrastructure within hospitals and clinics facilitates rapid integration.
Dominant Application: Radiology
- Key Drivers: High prevalence of target diseases (e.g., Non-alcoholic Fatty Liver Disease (NAFLD), breast cancer), need for non-invasive alternatives to biopsy, and evolving clinical guidelines recommending elastography.
- Market Size: Significant portion of the elastography market revenue is attributed to radiological applications.
- Sub-segments:
- Hepatology: Crucial for staging liver fibrosis and cirrhosis non-invasively, impacting treatment decisions and patient management.
- Breast Imaging: Used for characterizing breast lesions, improving diagnostic accuracy, and reducing unnecessary biopsies.
- Thyroid and Musculoskeletal Imaging: Growing applications in assessing stiffness of thyroid nodules and muscles/tendons.
Dominant End-User: Hospitals
- Key Drivers: Comprehensive diagnostic and treatment facilities, higher patient volumes, and access to a broad range of medical specialties.
- Infrastructure: Hospitals are equipped with advanced imaging departments and multidisciplinary teams necessary for effective elastography utilization.
- Technological Adoption: Hospitals are often early adopters of cutting-edge medical technologies, including advanced elastography systems.
- Reimbursement Policies: Established reimbursement pathways for diagnostic imaging procedures in hospitals support sustained demand.
The Radiology application segment is expected to maintain its dominance due to the persistent need for accurate and non-invasive assessment of organ stiffness, particularly in managing chronic liver diseases and characterizing suspicious lesions. The Hospitals end-user segment will continue to be the largest consumer of elastography imaging solutions owing to their comprehensive healthcare offerings and higher patient throughput.
Elastography Imaging Industry Product Innovations
Product innovations in the Elastography Imaging Industry are primarily focused on enhancing image resolution, improving quantification accuracy, and integrating advanced analytical tools. Companies are developing next-generation ultrasound systems with higher processing power and AI algorithms for real-time elastographic analysis, leading to more precise tissue stiffness measurements. Innovations include improved shear wave generation and detection techniques, leading to more reliable assessments of various pathologies, particularly in areas like hepatic fibrosis and vascular assessment. The development of advanced software platforms that provide comprehensive reporting and workflow integration further enhances the clinical utility of these devices. These innovations are crucial for maintaining a competitive edge and addressing the evolving clinical needs for non-invasive diagnostic imaging.
Report Segmentation & Scope
This comprehensive report segments the Elastography Imaging Industry across key parameters to provide granular market insights. The Modality segmentation includes Ultrasound Elastography and Magnetic Resonance Elastography, with Ultrasound Elastography projected to hold a larger market share due to its widespread adoption and cost-effectiveness. The Application segmentation encompasses Cardiology, Radiology, Urology, Vascular, Obstetrics/Gynecology, and Other Applications. Radiology is anticipated to lead this segment, followed by Cardiology and Vascular, driven by the critical need for stiffness assessment in these fields. The End-User segmentation covers Hospitals, Ambulatory Surgical Centers, and Surgical & Diagnostic Centers. Hospitals are expected to remain the dominant end-user segment, owing to their extensive infrastructure and patient volumes.
Key Drivers of Elastography Imaging Industry Growth
The Elastography Imaging Industry is propelled by several key growth drivers. Technologically, advancements in AI and machine learning for automated analysis and quantification of tissue stiffness are enhancing diagnostic accuracy and efficiency. Economically, increasing healthcare expenditure globally, coupled with a growing preference for minimally invasive procedures over traditional biopsies, fuels demand. Regulatory bodies are increasingly recognizing the value of elastography in clinical guidelines, thereby encouraging its adoption. The rising global burden of chronic diseases such as liver fibrosis, cardiovascular disease, and certain cancers, where elastography plays a pivotal diagnostic role, is another significant driver. Furthermore, the expansion of imaging infrastructure in emerging economies and the continuous innovation by market leaders are contributing to robust market growth.
Challenges in the Elastography Imaging Industry Sector
Despite its promising growth, the Elastography Imaging Industry faces several challenges. Stringent regulatory approval processes for new technologies and expanded indications can lead to prolonged market entry timelines. The high initial cost of advanced elastography systems can be a barrier to adoption, especially for smaller healthcare facilities or those in resource-constrained regions. Ensuring consistent image quality and accurate quantification across different operators and patient populations remains an ongoing technical challenge. Furthermore, the need for specialized training and education for healthcare professionals to effectively utilize elastography techniques requires continuous investment in training programs. Competitive pressures among established players and emerging technologies also necessitate ongoing innovation and strategic market positioning.
Leading Players in the Elastography Imaging Industry Market
- Esaote SpA
- Hologic Inc
- GE Healthcare
- Resoundant Inc
- Koninklijke Philips N V
- Mindray Medical International Limited
- Siemens AG
- Canon Medical Systems Corporation
- Samsung Medison
- Supersonic Imagine
- Fujifilm Holdings Corporation
Key Developments in Elastography Imaging Industry Sector
- November 2022: PENTAX Medical launched its new Performance Endoscopic Ultrasound (EUS) system in Canada. The system comprises the ARIETTA 65 PX ultrasound scanner and J10 Series Ultrasound Gastroscopes, offering high image quality, real-time tissue elastography, and improved therapeutic access. This development enhances capabilities in gastrointestinal diagnostics.
- May 2022: Mindray launched Resona I9 Advanced Technologies, featuring HiFR Sound Touch Elastography. This innovation allows for smoother transition times and faster refresh rates, ensuring more consistent acquisition and assessment during live 2D shear wave imaging, particularly beneficial for critical care and advanced imaging scenarios.
- March 2022: Fujifilm Healthcare Europe introduced the new Arietta ultrasound series, including Arietta 850 DeepInsight and Arietta 650 DeepInsight. These systems support comprehensive diagnoses of hepatic diseases like hepatitis, fibrosis, and cirrhosis, utilizing Real-time Tissue Elastography (RTE) and Shear Wave Measurement (SWM) for precise tissue stiffness assessment and quantification.
Strategic Elastography Imaging Industry Market Outlook
The strategic outlook for the Elastography Imaging Industry remains highly positive, driven by the increasing clinical demand for non-invasive diagnostic solutions. Growth accelerators include the continued integration of AI and machine learning to further refine diagnostic accuracy and workflow efficiency, making elastography an indispensable tool in routine clinical practice. Expansion into emerging markets, coupled with favorable reimbursement policies, will unlock significant growth opportunities. Strategic partnerships and collaborations between technology providers and healthcare institutions will foster innovation and accelerate the adoption of advanced elastography techniques. The development of more portable and cost-effective elastography devices will broaden access, particularly in remote or underserved areas, further solidifying the industry's growth trajectory. Continued focus on clinical validation and education will ensure sustained market penetration and the realization of elastography's full diagnostic potential.
Elastography Imaging Industry Segmentation
-
1. Modality
- 1.1. Utrasound Elastography
- 1.2. Magnetic Resonance Elastography
-
2. Application
- 2.1. Cardiology
- 2.2. Radiology
- 2.3. Urology
- 2.4. Vascular
- 2.5. Obstetrics/Gynecology
- 2.6. Other Ap
-
3. End-User
- 3.1. Hospitals
- 3.2. Ambulatory Surgical Centers
- 3.3. Surgical & Diagnostic centers
Elastography Imaging Industry Segmentation By Geography
-
1. North America
- 1.1. United States
- 1.2. Canada
- 1.3. Mexico
-
2. Europe
- 2.1. Germany
- 2.2. United Kingdom
- 2.3. France
- 2.4. Italy
- 2.5. Spain
- 2.6. Rest of Europe
-
3. Asia Pacific
- 3.1. China
- 3.2. Japan
- 3.3. India
- 3.4. Australia
- 3.5. South Korea
- 3.6. Rest of Asia Pacific
-
4. Middle East and Africa
- 4.1. GCC
- 4.2. South Africa
- 4.3. Rest of Middle East and Africa
-
5. South America
- 5.1. Brazil
- 5.2. Argentina
- 5.3. Rest of South America

Elastography Imaging Industry Regional Market Share
Geographic Coverage of Elastography Imaging Industry
Elastography Imaging Industry REPORT HIGHLIGHTS
| Aspects | Details |
|---|---|
| Study Period | 2020-2034 |
| Base Year | 2025 |
| Estimated Year | 2026 |
| Forecast Period | 2026-2034 |
| Historical Period | 2020-2025 |
| Growth Rate | CAGR of 9.05% from 2020-2034 |
| Segmentation |
|
Table of Contents
- 1. Introduction
- 1.1. Research Scope
- 1.2. Market Segmentation
- 1.3. Research Methodology
- 1.4. Definitions and Assumptions
- 2. Executive Summary
- 2.1. Introduction
- 3. Market Dynamics
- 3.1. Introduction
- 3.2. Market Drivers
- 3.2.1. Rising Incidence of Chronic Ailments and Breast Cancer; Growing Demand for Minimally Invasive Surgeries
- 3.3. Market Restrains
- 3.3.1. Adverse Scenario of Reimbursement; High Price of Imaging Devices for Elastography
- 3.4. Market Trends
- 3.4.1. Ultrasound Modality Segment Expects to Register a High CAGR in the Forecast Period
- 4. Market Factor Analysis
- 4.1. Porters Five Forces
- 4.2. Supply/Value Chain
- 4.3. PESTEL analysis
- 4.4. Market Entropy
- 4.5. Patent/Trademark Analysis
- 5. Global Elastography Imaging Industry Analysis, Insights and Forecast, 2020-2032
- 5.1. Market Analysis, Insights and Forecast - by Modality
- 5.1.1. Utrasound Elastography
- 5.1.2. Magnetic Resonance Elastography
- 5.2. Market Analysis, Insights and Forecast - by Application
- 5.2.1. Cardiology
- 5.2.2. Radiology
- 5.2.3. Urology
- 5.2.4. Vascular
- 5.2.5. Obstetrics/Gynecology
- 5.2.6. Other Ap
- 5.3. Market Analysis, Insights and Forecast - by End-User
- 5.3.1. Hospitals
- 5.3.2. Ambulatory Surgical Centers
- 5.3.3. Surgical & Diagnostic centers
- 5.4. Market Analysis, Insights and Forecast - by Region
- 5.4.1. North America
- 5.4.2. Europe
- 5.4.3. Asia Pacific
- 5.4.4. Middle East and Africa
- 5.4.5. South America
- 5.1. Market Analysis, Insights and Forecast - by Modality
- 6. North America Elastography Imaging Industry Analysis, Insights and Forecast, 2020-2032
- 6.1. Market Analysis, Insights and Forecast - by Modality
- 6.1.1. Utrasound Elastography
- 6.1.2. Magnetic Resonance Elastography
- 6.2. Market Analysis, Insights and Forecast - by Application
- 6.2.1. Cardiology
- 6.2.2. Radiology
- 6.2.3. Urology
- 6.2.4. Vascular
- 6.2.5. Obstetrics/Gynecology
- 6.2.6. Other Ap
- 6.3. Market Analysis, Insights and Forecast - by End-User
- 6.3.1. Hospitals
- 6.3.2. Ambulatory Surgical Centers
- 6.3.3. Surgical & Diagnostic centers
- 6.1. Market Analysis, Insights and Forecast - by Modality
- 7. Europe Elastography Imaging Industry Analysis, Insights and Forecast, 2020-2032
- 7.1. Market Analysis, Insights and Forecast - by Modality
- 7.1.1. Utrasound Elastography
- 7.1.2. Magnetic Resonance Elastography
- 7.2. Market Analysis, Insights and Forecast - by Application
- 7.2.1. Cardiology
- 7.2.2. Radiology
- 7.2.3. Urology
- 7.2.4. Vascular
- 7.2.5. Obstetrics/Gynecology
- 7.2.6. Other Ap
- 7.3. Market Analysis, Insights and Forecast - by End-User
- 7.3.1. Hospitals
- 7.3.2. Ambulatory Surgical Centers
- 7.3.3. Surgical & Diagnostic centers
- 7.1. Market Analysis, Insights and Forecast - by Modality
- 8. Asia Pacific Elastography Imaging Industry Analysis, Insights and Forecast, 2020-2032
- 8.1. Market Analysis, Insights and Forecast - by Modality
- 8.1.1. Utrasound Elastography
- 8.1.2. Magnetic Resonance Elastography
- 8.2. Market Analysis, Insights and Forecast - by Application
- 8.2.1. Cardiology
- 8.2.2. Radiology
- 8.2.3. Urology
- 8.2.4. Vascular
- 8.2.5. Obstetrics/Gynecology
- 8.2.6. Other Ap
- 8.3. Market Analysis, Insights and Forecast - by End-User
- 8.3.1. Hospitals
- 8.3.2. Ambulatory Surgical Centers
- 8.3.3. Surgical & Diagnostic centers
- 8.1. Market Analysis, Insights and Forecast - by Modality
- 9. Middle East and Africa Elastography Imaging Industry Analysis, Insights and Forecast, 2020-2032
- 9.1. Market Analysis, Insights and Forecast - by Modality
- 9.1.1. Utrasound Elastography
- 9.1.2. Magnetic Resonance Elastography
- 9.2. Market Analysis, Insights and Forecast - by Application
- 9.2.1. Cardiology
- 9.2.2. Radiology
- 9.2.3. Urology
- 9.2.4. Vascular
- 9.2.5. Obstetrics/Gynecology
- 9.2.6. Other Ap
- 9.3. Market Analysis, Insights and Forecast - by End-User
- 9.3.1. Hospitals
- 9.3.2. Ambulatory Surgical Centers
- 9.3.3. Surgical & Diagnostic centers
- 9.1. Market Analysis, Insights and Forecast - by Modality
- 10. South America Elastography Imaging Industry Analysis, Insights and Forecast, 2020-2032
- 10.1. Market Analysis, Insights and Forecast - by Modality
- 10.1.1. Utrasound Elastography
- 10.1.2. Magnetic Resonance Elastography
- 10.2. Market Analysis, Insights and Forecast - by Application
- 10.2.1. Cardiology
- 10.2.2. Radiology
- 10.2.3. Urology
- 10.2.4. Vascular
- 10.2.5. Obstetrics/Gynecology
- 10.2.6. Other Ap
- 10.3. Market Analysis, Insights and Forecast - by End-User
- 10.3.1. Hospitals
- 10.3.2. Ambulatory Surgical Centers
- 10.3.3. Surgical & Diagnostic centers
- 10.1. Market Analysis, Insights and Forecast - by Modality
- 11. Competitive Analysis
- 11.1. Global Market Share Analysis 2025
- 11.2. Company Profiles
- 11.2.1 Esaote SpA
- 11.2.1.1. Overview
- 11.2.1.2. Products
- 11.2.1.3. SWOT Analysis
- 11.2.1.4. Recent Developments
- 11.2.1.5. Financials (Based on Availability)
- 11.2.2 Hologic Inc
- 11.2.2.1. Overview
- 11.2.2.2. Products
- 11.2.2.3. SWOT Analysis
- 11.2.2.4. Recent Developments
- 11.2.2.5. Financials (Based on Availability)
- 11.2.3 GE Healthcare
- 11.2.3.1. Overview
- 11.2.3.2. Products
- 11.2.3.3. SWOT Analysis
- 11.2.3.4. Recent Developments
- 11.2.3.5. Financials (Based on Availability)
- 11.2.4 Resoundant Inc
- 11.2.4.1. Overview
- 11.2.4.2. Products
- 11.2.4.3. SWOT Analysis
- 11.2.4.4. Recent Developments
- 11.2.4.5. Financials (Based on Availability)
- 11.2.5 Koninklijke Philips N V
- 11.2.5.1. Overview
- 11.2.5.2. Products
- 11.2.5.3. SWOT Analysis
- 11.2.5.4. Recent Developments
- 11.2.5.5. Financials (Based on Availability)
- 11.2.6 Mindray Medical International Limited
- 11.2.6.1. Overview
- 11.2.6.2. Products
- 11.2.6.3. SWOT Analysis
- 11.2.6.4. Recent Developments
- 11.2.6.5. Financials (Based on Availability)
- 11.2.7 Siemens AG*List Not Exhaustive
- 11.2.7.1. Overview
- 11.2.7.2. Products
- 11.2.7.3. SWOT Analysis
- 11.2.7.4. Recent Developments
- 11.2.7.5. Financials (Based on Availability)
- 11.2.8 Canon Medical Systems Corporation
- 11.2.8.1. Overview
- 11.2.8.2. Products
- 11.2.8.3. SWOT Analysis
- 11.2.8.4. Recent Developments
- 11.2.8.5. Financials (Based on Availability)
- 11.2.9 Samsung Medison
- 11.2.9.1. Overview
- 11.2.9.2. Products
- 11.2.9.3. SWOT Analysis
- 11.2.9.4. Recent Developments
- 11.2.9.5. Financials (Based on Availability)
- 11.2.10 Supersonic Imagine
- 11.2.10.1. Overview
- 11.2.10.2. Products
- 11.2.10.3. SWOT Analysis
- 11.2.10.4. Recent Developments
- 11.2.10.5. Financials (Based on Availability)
- 11.2.11 Fujifilm Holdings Corporation
- 11.2.11.1. Overview
- 11.2.11.2. Products
- 11.2.11.3. SWOT Analysis
- 11.2.11.4. Recent Developments
- 11.2.11.5. Financials (Based on Availability)
- 11.2.1 Esaote SpA
List of Figures
- Figure 1: Global Elastography Imaging Industry Revenue Breakdown (billion, %) by Region 2025 & 2033
- Figure 2: North America Elastography Imaging Industry Revenue (billion), by Modality 2025 & 2033
- Figure 3: North America Elastography Imaging Industry Revenue Share (%), by Modality 2025 & 2033
- Figure 4: North America Elastography Imaging Industry Revenue (billion), by Application 2025 & 2033
- Figure 5: North America Elastography Imaging Industry Revenue Share (%), by Application 2025 & 2033
- Figure 6: North America Elastography Imaging Industry Revenue (billion), by End-User 2025 & 2033
- Figure 7: North America Elastography Imaging Industry Revenue Share (%), by End-User 2025 & 2033
- Figure 8: North America Elastography Imaging Industry Revenue (billion), by Country 2025 & 2033
- Figure 9: North America Elastography Imaging Industry Revenue Share (%), by Country 2025 & 2033
- Figure 10: Europe Elastography Imaging Industry Revenue (billion), by Modality 2025 & 2033
- Figure 11: Europe Elastography Imaging Industry Revenue Share (%), by Modality 2025 & 2033
- Figure 12: Europe Elastography Imaging Industry Revenue (billion), by Application 2025 & 2033
- Figure 13: Europe Elastography Imaging Industry Revenue Share (%), by Application 2025 & 2033
- Figure 14: Europe Elastography Imaging Industry Revenue (billion), by End-User 2025 & 2033
- Figure 15: Europe Elastography Imaging Industry Revenue Share (%), by End-User 2025 & 2033
- Figure 16: Europe Elastography Imaging Industry Revenue (billion), by Country 2025 & 2033
- Figure 17: Europe Elastography Imaging Industry Revenue Share (%), by Country 2025 & 2033
- Figure 18: Asia Pacific Elastography Imaging Industry Revenue (billion), by Modality 2025 & 2033
- Figure 19: Asia Pacific Elastography Imaging Industry Revenue Share (%), by Modality 2025 & 2033
- Figure 20: Asia Pacific Elastography Imaging Industry Revenue (billion), by Application 2025 & 2033
- Figure 21: Asia Pacific Elastography Imaging Industry Revenue Share (%), by Application 2025 & 2033
- Figure 22: Asia Pacific Elastography Imaging Industry Revenue (billion), by End-User 2025 & 2033
- Figure 23: Asia Pacific Elastography Imaging Industry Revenue Share (%), by End-User 2025 & 2033
- Figure 24: Asia Pacific Elastography Imaging Industry Revenue (billion), by Country 2025 & 2033
- Figure 25: Asia Pacific Elastography Imaging Industry Revenue Share (%), by Country 2025 & 2033
- Figure 26: Middle East and Africa Elastography Imaging Industry Revenue (billion), by Modality 2025 & 2033
- Figure 27: Middle East and Africa Elastography Imaging Industry Revenue Share (%), by Modality 2025 & 2033
- Figure 28: Middle East and Africa Elastography Imaging Industry Revenue (billion), by Application 2025 & 2033
- Figure 29: Middle East and Africa Elastography Imaging Industry Revenue Share (%), by Application 2025 & 2033
- Figure 30: Middle East and Africa Elastography Imaging Industry Revenue (billion), by End-User 2025 & 2033
- Figure 31: Middle East and Africa Elastography Imaging Industry Revenue Share (%), by End-User 2025 & 2033
- Figure 32: Middle East and Africa Elastography Imaging Industry Revenue (billion), by Country 2025 & 2033
- Figure 33: Middle East and Africa Elastography Imaging Industry Revenue Share (%), by Country 2025 & 2033
- Figure 34: South America Elastography Imaging Industry Revenue (billion), by Modality 2025 & 2033
- Figure 35: South America Elastography Imaging Industry Revenue Share (%), by Modality 2025 & 2033
- Figure 36: South America Elastography Imaging Industry Revenue (billion), by Application 2025 & 2033
- Figure 37: South America Elastography Imaging Industry Revenue Share (%), by Application 2025 & 2033
- Figure 38: South America Elastography Imaging Industry Revenue (billion), by End-User 2025 & 2033
- Figure 39: South America Elastography Imaging Industry Revenue Share (%), by End-User 2025 & 2033
- Figure 40: South America Elastography Imaging Industry Revenue (billion), by Country 2025 & 2033
- Figure 41: South America Elastography Imaging Industry Revenue Share (%), by Country 2025 & 2033
List of Tables
- Table 1: Global Elastography Imaging Industry Revenue billion Forecast, by Modality 2020 & 2033
- Table 2: Global Elastography Imaging Industry Revenue billion Forecast, by Application 2020 & 2033
- Table 3: Global Elastography Imaging Industry Revenue billion Forecast, by End-User 2020 & 2033
- Table 4: Global Elastography Imaging Industry Revenue billion Forecast, by Region 2020 & 2033
- Table 5: Global Elastography Imaging Industry Revenue billion Forecast, by Modality 2020 & 2033
- Table 6: Global Elastography Imaging Industry Revenue billion Forecast, by Application 2020 & 2033
- Table 7: Global Elastography Imaging Industry Revenue billion Forecast, by End-User 2020 & 2033
- Table 8: Global Elastography Imaging Industry Revenue billion Forecast, by Country 2020 & 2033
- Table 9: United States Elastography Imaging Industry Revenue (billion) Forecast, by Application 2020 & 2033
- Table 10: Canada Elastography Imaging Industry Revenue (billion) Forecast, by Application 2020 & 2033
- Table 11: Mexico Elastography Imaging Industry Revenue (billion) Forecast, by Application 2020 & 2033
- Table 12: Global Elastography Imaging Industry Revenue billion Forecast, by Modality 2020 & 2033
- Table 13: Global Elastography Imaging Industry Revenue billion Forecast, by Application 2020 & 2033
- Table 14: Global Elastography Imaging Industry Revenue billion Forecast, by End-User 2020 & 2033
- Table 15: Global Elastography Imaging Industry Revenue billion Forecast, by Country 2020 & 2033
- Table 16: Germany Elastography Imaging Industry Revenue (billion) Forecast, by Application 2020 & 2033
- Table 17: United Kingdom Elastography Imaging Industry Revenue (billion) Forecast, by Application 2020 & 2033
- Table 18: France Elastography Imaging Industry Revenue (billion) Forecast, by Application 2020 & 2033
- Table 19: Italy Elastography Imaging Industry Revenue (billion) Forecast, by Application 2020 & 2033
- Table 20: Spain Elastography Imaging Industry Revenue (billion) Forecast, by Application 2020 & 2033
- Table 21: Rest of Europe Elastography Imaging Industry Revenue (billion) Forecast, by Application 2020 & 2033
- Table 22: Global Elastography Imaging Industry Revenue billion Forecast, by Modality 2020 & 2033
- Table 23: Global Elastography Imaging Industry Revenue billion Forecast, by Application 2020 & 2033
- Table 24: Global Elastography Imaging Industry Revenue billion Forecast, by End-User 2020 & 2033
- Table 25: Global Elastography Imaging Industry Revenue billion Forecast, by Country 2020 & 2033
- Table 26: China Elastography Imaging Industry Revenue (billion) Forecast, by Application 2020 & 2033
- Table 27: Japan Elastography Imaging Industry Revenue (billion) Forecast, by Application 2020 & 2033
- Table 28: India Elastography Imaging Industry Revenue (billion) Forecast, by Application 2020 & 2033
- Table 29: Australia Elastography Imaging Industry Revenue (billion) Forecast, by Application 2020 & 2033
- Table 30: South Korea Elastography Imaging Industry Revenue (billion) Forecast, by Application 2020 & 2033
- Table 31: Rest of Asia Pacific Elastography Imaging Industry Revenue (billion) Forecast, by Application 2020 & 2033
- Table 32: Global Elastography Imaging Industry Revenue billion Forecast, by Modality 2020 & 2033
- Table 33: Global Elastography Imaging Industry Revenue billion Forecast, by Application 2020 & 2033
- Table 34: Global Elastography Imaging Industry Revenue billion Forecast, by End-User 2020 & 2033
- Table 35: Global Elastography Imaging Industry Revenue billion Forecast, by Country 2020 & 2033
- Table 36: GCC Elastography Imaging Industry Revenue (billion) Forecast, by Application 2020 & 2033
- Table 37: South Africa Elastography Imaging Industry Revenue (billion) Forecast, by Application 2020 & 2033
- Table 38: Rest of Middle East and Africa Elastography Imaging Industry Revenue (billion) Forecast, by Application 2020 & 2033
- Table 39: Global Elastography Imaging Industry Revenue billion Forecast, by Modality 2020 & 2033
- Table 40: Global Elastography Imaging Industry Revenue billion Forecast, by Application 2020 & 2033
- Table 41: Global Elastography Imaging Industry Revenue billion Forecast, by End-User 2020 & 2033
- Table 42: Global Elastography Imaging Industry Revenue billion Forecast, by Country 2020 & 2033
- Table 43: Brazil Elastography Imaging Industry Revenue (billion) Forecast, by Application 2020 & 2033
- Table 44: Argentina Elastography Imaging Industry Revenue (billion) Forecast, by Application 2020 & 2033
- Table 45: Rest of South America Elastography Imaging Industry Revenue (billion) Forecast, by Application 2020 & 2033
Frequently Asked Questions
1. What is the projected Compound Annual Growth Rate (CAGR) of the Elastography Imaging Industry?
The projected CAGR is approximately 9.05%.
2. Which companies are prominent players in the Elastography Imaging Industry?
Key companies in the market include Esaote SpA, Hologic Inc, GE Healthcare, Resoundant Inc, Koninklijke Philips N V, Mindray Medical International Limited, Siemens AG*List Not Exhaustive, Canon Medical Systems Corporation, Samsung Medison, Supersonic Imagine, Fujifilm Holdings Corporation.
3. What are the main segments of the Elastography Imaging Industry?
The market segments include Modality, Application, End-User.
4. Can you provide details about the market size?
The market size is estimated to be USD 12.13 billion as of 2022.
5. What are some drivers contributing to market growth?
Rising Incidence of Chronic Ailments and Breast Cancer; Growing Demand for Minimally Invasive Surgeries.
6. What are the notable trends driving market growth?
Ultrasound Modality Segment Expects to Register a High CAGR in the Forecast Period.
7. Are there any restraints impacting market growth?
Adverse Scenario of Reimbursement; High Price of Imaging Devices for Elastography.
8. Can you provide examples of recent developments in the market?
November 2022: PENTAX Medical launched its new Performance Endoscopic Ultrasound (EUS) system in Canada. The system consists of a combination of its new ARIETTA 65 PX ultrasound scanner and its best-in-class J10 Series Ultrasound Gastroscopes. The J10 Series Ultrasound Gastroscope and ARIETTA 65 PX offer high image quality, real-time tissue elastography, and better therapeutic access.
9. What pricing options are available for accessing the report?
Pricing options include single-user, multi-user, and enterprise licenses priced at USD 4750, USD 5250, and USD 8750 respectively.
10. Is the market size provided in terms of value or volume?
The market size is provided in terms of value, measured in billion.
11. Are there any specific market keywords associated with the report?
Yes, the market keyword associated with the report is "Elastography Imaging Industry," which aids in identifying and referencing the specific market segment covered.
12. How do I determine which pricing option suits my needs best?
The pricing options vary based on user requirements and access needs. Individual users may opt for single-user licenses, while businesses requiring broader access may choose multi-user or enterprise licenses for cost-effective access to the report.
13. Are there any additional resources or data provided in the Elastography Imaging Industry report?
While the report offers comprehensive insights, it's advisable to review the specific contents or supplementary materials provided to ascertain if additional resources or data are available.
14. How can I stay updated on further developments or reports in the Elastography Imaging Industry?
To stay informed about further developments, trends, and reports in the Elastography Imaging Industry, consider subscribing to industry newsletters, following relevant companies and organizations, or regularly checking reputable industry news sources and publications.
Methodology
Step 1 - Identification of Relevant Samples Size from Population Database


Step 2 - Approaches for Defining Global Market Size (Value, Volume* & Price*)

Note*: In applicable scenarios
Step 3 - Data Sources
Primary Research
- Web Analytics
- Survey Reports
- Research Institute
- Latest Research Reports
- Opinion Leaders
Secondary Research
- Annual Reports
- White Paper
- Latest Press Release
- Industry Association
- Paid Database
- Investor Presentations

Step 4 - Data Triangulation
Involves using different sources of information in order to increase the validity of a study
These sources are likely to be stakeholders in a program - participants, other researchers, program staff, other community members, and so on.
Then we put all data in single framework & apply various statistical tools to find out the dynamic on the market.
During the analysis stage, feedback from the stakeholder groups would be compared to determine areas of agreement as well as areas of divergence