
Key Insights
The Earth and Space Mining Sensors market is experiencing robust growth, projected to maintain a Compound Annual Growth Rate (CAGR) exceeding 18% from 2025 to 2033. This expansion is driven by several key factors. Firstly, the increasing demand for critical minerals and resources, fueled by the burgeoning electric vehicle and renewable energy sectors, is significantly boosting exploration and mining activities, both on Earth and in space. Advancements in sensor technology, offering higher precision, reliability, and efficiency in mineral detection and analysis, are further accelerating market growth. The development of smaller, more energy-efficient sensors, particularly for space applications, is also a significant contributor. Furthermore, government initiatives promoting space exploration and resource utilization are creating a favorable regulatory environment and attracting significant investment in the sector. The integration of advanced data analytics and AI capabilities with sensor data is enhancing operational efficiency and reducing exploration costs, further driving market expansion.
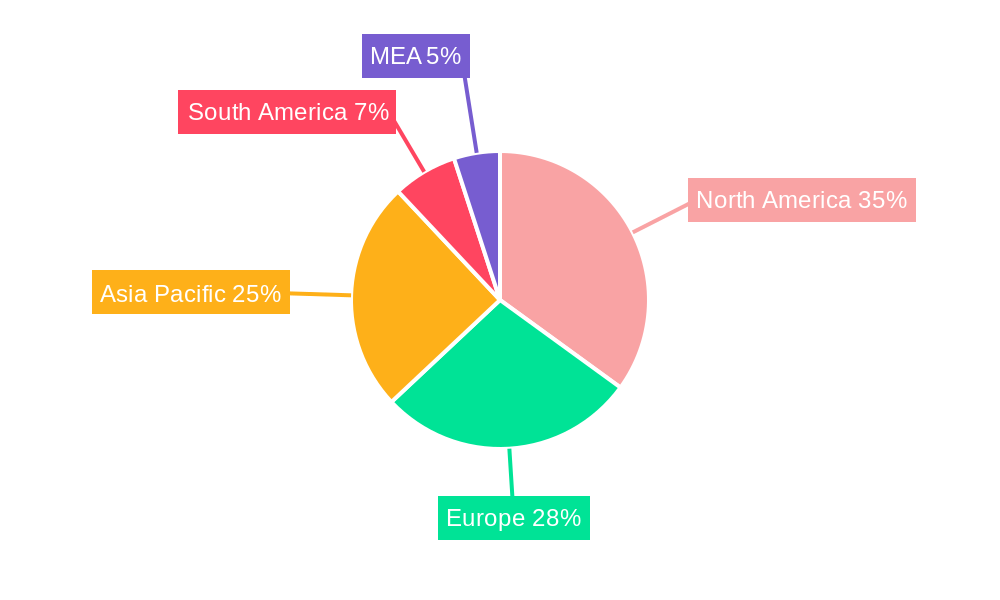
Market segmentation reveals strong growth across both Earth and space mining applications. In Earth mining, magnetometers, SONAR, and gas sensors are widely employed for mineral exploration and resource mapping. The space mining segment is rapidly developing, with laser sensors (for mineral spectrometry), gas sensors (for element analysis), and gyroscopes playing crucial roles in asteroid and planetary resource identification and extraction. While North America and Europe currently hold significant market share, the Asia-Pacific region is expected to witness substantial growth driven by rapid industrialization and increasing investments in mining and space exploration initiatives. Competitive landscape analysis indicates a strong presence of established players like Rockwell Automation, Texas Instruments, and Honeywell International, alongside emerging innovative companies focusing on specialized sensor technologies. Challenges include the high initial investment costs associated with advanced sensor technologies and the complexities inherent in space mining operations. However, the long-term prospects for this market remain exceptionally positive, fueled by the continuous demand for raw materials and the expanding frontiers of space exploration.

Earth and Space Mining Sensors Market: A Comprehensive Analysis (2019-2033)
This in-depth report provides a comprehensive analysis of the Earth and Space Mining Sensors Market, offering crucial insights for businesses, investors, and researchers seeking to navigate this dynamic sector. The study period spans from 2019 to 2033, with 2025 serving as the base and estimated year. The report covers key market segments, competitive landscapes, technological advancements, and future growth projections, empowering informed decision-making. The market is valued at xx Million in 2025 and is projected to reach xx Million by 2033, exhibiting a CAGR of xx% during the forecast period (2025-2033).
Earth and Space Mining Sensors Market Market Structure & Competitive Dynamics
The Earth and Space Mining Sensors market exhibits a moderately consolidated structure, with several key players holding significant market share. Market concentration is influenced by factors such as technological advancements, economies of scale, and strategic mergers and acquisitions (M&A). The market is characterized by an active innovation ecosystem, with companies investing heavily in R&D to develop advanced sensor technologies for improved accuracy, durability, and efficiency in both terrestrial and extraterrestrial mining operations.
Regulatory frameworks, particularly concerning safety and environmental standards, play a significant role in shaping market dynamics. Stringent regulations drive the adoption of advanced sensors that minimize environmental impact and improve worker safety. Product substitutes, such as advanced imaging techniques and data analytics, are emerging, creating competitive pressures. End-user trends, such as increasing demand for automation and data-driven decision-making in mining operations, are driving the adoption of sophisticated sensor technologies.
M&A activity has been notable, with several large players acquiring smaller companies to expand their product portfolios and market reach. Deal values have ranged from xx Million to xx Million in recent years, reflecting the strategic importance of this sector. Key metrics such as market share are analyzed for the major players, indicating a competitive landscape marked by both cooperation and competition.
- Market Concentration: Moderately Consolidated
- Innovation Ecosystem: Highly Active
- Regulatory Framework: Stringent (Safety & Environmental)
- M&A Activity: Significant, with deal values ranging from xx Million to xx Million.
- Market Share: [Detailed breakdown of market share for key players will be provided in the full report]
Earth and Space Mining Sensors Market Industry Trends & Insights
The Earth and Space Mining Sensors market is experiencing robust growth, driven by several key factors. Increased demand for minerals and metals, coupled with the growing exploration of space resources, is significantly boosting market demand. Technological disruptions, such as the development of miniaturized sensors, improved sensor fusion techniques, and the rise of AI-powered data analytics, are revolutionizing the industry. Consumer preferences are shifting towards more efficient, reliable, and environmentally friendly mining practices, further accelerating the adoption of advanced sensors.
The competitive dynamics are characterized by intense innovation, product differentiation, and strategic partnerships. Companies are continuously striving to improve sensor performance, reduce costs, and enhance data processing capabilities. This trend is reflected in the increasing market penetration of advanced sensor technologies across various mining applications. The market is expected to continue its growth trajectory, driven by technological advancements and the expansion of both terrestrial and space mining activities.
The market’s growth is further enhanced by government initiatives promoting sustainable mining practices and space exploration. Market penetration of advanced sensor technologies is increasing, with a significant adoption rate predicted in the upcoming years.
- Market Growth Drivers: Increased demand for minerals, space resource exploration, technological advancements, and government initiatives.
- Technological Disruptions: Miniaturization, sensor fusion, AI-powered data analytics.
- CAGR (2025-2033): xx%
- Market Penetration: [Detailed data on market penetration will be included in the full report].

Dominant Markets & Segments in Earth and Space Mining Sensors Market
The dominant markets and segments within the Earth and Space Mining Sensors market are geographically diverse and application-specific. While detailed regional analysis is provided in the full report, early indications suggest strong growth in North America and Asia-Pacific regions, driven by robust mining activities and investments in space exploration.
By Space Mining:
- Laser Sensors (Mineral Spectrometry): This segment shows significant growth potential due to its ability to provide precise mineral composition analysis. Key drivers include the increasing focus on asteroid mining and the demand for rare earth elements.
- Gas Sensors (Element Analysis): Essential for analyzing the atmospheric composition of celestial bodies, this segment is experiencing growth due to the rising demand for accurate data in space exploration and resource extraction.
- Gyroscope Sensors: Critical for navigation and orientation in space, this segment is seeing growth driven by increased investment in space exploration technology.
By Earth Mining:
- Magnetometer: Widely used in mineral exploration and mapping, this segment continues to be a significant part of the market, supported by ongoing exploration efforts and the increasing demand for metals and minerals.
- SONAR: Used in underwater mining and exploration, this segment’s growth is tied to deep-sea mining and exploration activities.
- Gas Sensor: Essential for monitoring gas levels in underground mines, ensuring worker safety and preventing accidents, this segment benefits from stringent safety regulations.
Key Drivers (Examples):
- Economic Policies: Government incentives for mineral exploration and mining.
- Infrastructure: Development of mining infrastructure in key regions.
Earth and Space Mining Sensors Market Product Innovations
Recent years have witnessed significant advancements in Earth and Space Mining sensors. Miniaturization of sensor technologies has led to smaller, lighter, and more energy-efficient devices suitable for deployment in various environments. The integration of advanced materials and improved manufacturing processes has significantly enhanced sensor durability and performance, leading to more reliable and accurate data acquisition. Furthermore, the incorporation of AI and machine learning algorithms has improved data processing and analysis, enabling automated decision-making and predictive maintenance. These innovations enhance operational efficiency, reduce costs, and improve the safety of mining operations.
Report Segmentation & Scope
This report provides a comprehensive segmentation of the Earth and Space Mining Sensors market across various aspects.
By Space Mining: The space mining segment is further broken down into Laser Sensors (Mineral Spectrometry), Gas Sensors (Element Analysis), and Gyroscope Sensors. Each sub-segment analysis includes market size, growth projections, and competitive dynamics.
By Earth Mining: The earth mining segment is segmented into Magnetometer, SONAR, and Gas Sensor, with each sub-segment's analysis including market size, growth projections, and competitive dynamics.
By Region: Detailed regional breakdowns covering major mining regions are included, providing insights into regional market variations and growth patterns.
Growth projections for each segment are detailed within the complete report, providing a granular understanding of market dynamics across different application areas.
Key Drivers of Earth and Space Mining Sensors Market Growth
Several factors are driving the growth of the Earth and Space Mining Sensors market. Technological advancements such as the development of more sensitive, reliable, and energy-efficient sensors are key. Growing demand for minerals and metals, fueled by the global economy and technological advancements, contributes significantly. Furthermore, increasing government support for sustainable mining practices and space exploration programs adds impetus. The expanding adoption of automation and data analytics in the mining sector further propels market growth.
Challenges in the Earth and Space Mining Sensors Market Sector
The Earth and Space Mining Sensors market faces certain challenges. Stringent safety and environmental regulations necessitate high compliance costs. Supply chain disruptions can impact sensor availability and pricing. Intense competition among sensor manufacturers and the need for continuous innovation to stay ahead create pressure. These factors impact profitability and market expansion.
Leading Players in the Earth and Space Mining Sensors Market Market
- Rockwell Automation
- Texas Instruments
- Siemens
- STMicroelectronics
- Amphenol Corporation
- Honeywell International
- Deltion Innovation
- Robert Bosch GmbH
- InnaLabs
- DENSO Corporation
Key Developments in Earth and Space Mining Sensors Market Sector
- January 2023: Honeywell International launched a new range of gas sensors optimized for mining applications.
- March 2022: Texas Instruments announced a partnership with a mining company to develop AI-powered sensor solutions.
- [Further key developments with dates will be included in the complete report.]
Strategic Earth and Space Mining Sensors Market Market Outlook
The Earth and Space Mining Sensors market presents significant growth opportunities. Continued technological innovation, rising demand for minerals, and increased space exploration activities are key accelerators. Strategic partnerships, expansion into new markets, and focusing on developing sustainable and efficient sensor solutions are crucial for capturing market share. The market is poised for substantial growth in the coming years, offering attractive investment and expansion prospects.
Earth and Space Mining Sensors Market Segmentation
-
1. Earth mining
- 1.1. Magnetometer
- 1.2. SONAR
- 1.3. Gas Sensor
-
2. space mining
- 2.1. Laser Sensors (Mineral Spectrometry)
- 2.2. Gas Sensors (Element Analysis)
- 2.3. Gyroscope Sensors
Earth and Space Mining Sensors Market Segmentation By Geography
-
1. North America
- 1.1. US
- 1.2. Canada
- 1.3. Mexico
- 1.4. Rest of NA
-
2. Europe
- 2.1. Germany
- 2.2. UK
- 2.3. France
- 2.4. Russia
- 2.5. Spain
- 2.6. Rest of NA
-
3. Asia Pacific
- 3.1. India
- 3.2. China
- 3.3. Japan
- 3.4. Rest of AP
- 4. Rest of the world
Earth and Space Mining Sensors Market REPORT HIGHLIGHTS
| Aspects | Details |
|---|---|
| Study Period | 2019-2033 |
| Base Year | 2024 |
| Estimated Year | 2025 |
| Forecast Period | 2025-2033 |
| Historical Period | 2019-2024 |
| Growth Rate | CAGR of > 18.00% from 2019-2033 |
| Segmentation |
|
Table of Contents
- 1. Introduction
- 1.1. Research Scope
- 1.2. Market Segmentation
- 1.3. Research Methodology
- 1.4. Definitions and Assumptions
- 2. Executive Summary
- 2.1. Introduction
- 3. Market Dynamics
- 3.1. Introduction
- 3.2. Market Drivers
- 3.2.1. Increasing demand from consumer electronics; Rising adoption of IoT
- 3.3. Market Restrains
- 3.3.1. Intense Competition in the Market
- 3.4. Market Trends
- 3.4.1. Various Government Initiatives Aimed Toward Space Mining
- 4. Market Factor Analysis
- 4.1. Porters Five Forces
- 4.2. Supply/Value Chain
- 4.3. PESTEL analysis
- 4.4. Market Entropy
- 4.5. Patent/Trademark Analysis
- 5. Global Earth and Space Mining Sensors Market Analysis, Insights and Forecast, 2019-2031
- 5.1. Market Analysis, Insights and Forecast - by Earth mining
- 5.1.1. Magnetometer
- 5.1.2. SONAR
- 5.1.3. Gas Sensor
- 5.2. Market Analysis, Insights and Forecast - by space mining
- 5.2.1. Laser Sensors (Mineral Spectrometry)
- 5.2.2. Gas Sensors (Element Analysis)
- 5.2.3. Gyroscope Sensors
- 5.3. Market Analysis, Insights and Forecast - by Region
- 5.3.1. North America
- 5.3.2. Europe
- 5.3.3. Asia Pacific
- 5.3.4. Rest of the world
- 5.1. Market Analysis, Insights and Forecast - by Earth mining
- 6. North America Earth and Space Mining Sensors Market Analysis, Insights and Forecast, 2019-2031
- 6.1. Market Analysis, Insights and Forecast - by Earth mining
- 6.1.1. Magnetometer
- 6.1.2. SONAR
- 6.1.3. Gas Sensor
- 6.2. Market Analysis, Insights and Forecast - by space mining
- 6.2.1. Laser Sensors (Mineral Spectrometry)
- 6.2.2. Gas Sensors (Element Analysis)
- 6.2.3. Gyroscope Sensors
- 6.1. Market Analysis, Insights and Forecast - by Earth mining
- 7. Europe Earth and Space Mining Sensors Market Analysis, Insights and Forecast, 2019-2031
- 7.1. Market Analysis, Insights and Forecast - by Earth mining
- 7.1.1. Magnetometer
- 7.1.2. SONAR
- 7.1.3. Gas Sensor
- 7.2. Market Analysis, Insights and Forecast - by space mining
- 7.2.1. Laser Sensors (Mineral Spectrometry)
- 7.2.2. Gas Sensors (Element Analysis)
- 7.2.3. Gyroscope Sensors
- 7.1. Market Analysis, Insights and Forecast - by Earth mining
- 8. Asia Pacific Earth and Space Mining Sensors Market Analysis, Insights and Forecast, 2019-2031
- 8.1. Market Analysis, Insights and Forecast - by Earth mining
- 8.1.1. Magnetometer
- 8.1.2. SONAR
- 8.1.3. Gas Sensor
- 8.2. Market Analysis, Insights and Forecast - by space mining
- 8.2.1. Laser Sensors (Mineral Spectrometry)
- 8.2.2. Gas Sensors (Element Analysis)
- 8.2.3. Gyroscope Sensors
- 8.1. Market Analysis, Insights and Forecast - by Earth mining
- 9. Rest of the world Earth and Space Mining Sensors Market Analysis, Insights and Forecast, 2019-2031
- 9.1. Market Analysis, Insights and Forecast - by Earth mining
- 9.1.1. Magnetometer
- 9.1.2. SONAR
- 9.1.3. Gas Sensor
- 9.2. Market Analysis, Insights and Forecast - by space mining
- 9.2.1. Laser Sensors (Mineral Spectrometry)
- 9.2.2. Gas Sensors (Element Analysis)
- 9.2.3. Gyroscope Sensors
- 9.1. Market Analysis, Insights and Forecast - by Earth mining
- 10. North America Earth and Space Mining Sensors Market Analysis, Insights and Forecast, 2019-2031
- 10.1. Market Analysis, Insights and Forecast - By Country/Sub-region
- 10.1.1 United States
- 10.1.2 Canada
- 10.1.3 Mexico
- 11. Europe Earth and Space Mining Sensors Market Analysis, Insights and Forecast, 2019-2031
- 11.1. Market Analysis, Insights and Forecast - By Country/Sub-region
- 11.1.1 Germany
- 11.1.2 United Kingdom
- 11.1.3 France
- 11.1.4 Spain
- 11.1.5 Italy
- 11.1.6 Spain
- 11.1.7 Belgium
- 11.1.8 Netherland
- 11.1.9 Nordics
- 11.1.10 Rest of Europe
- 12. Asia Pacific Earth and Space Mining Sensors Market Analysis, Insights and Forecast, 2019-2031
- 12.1. Market Analysis, Insights and Forecast - By Country/Sub-region
- 12.1.1 China
- 12.1.2 Japan
- 12.1.3 India
- 12.1.4 South Korea
- 12.1.5 Southeast Asia
- 12.1.6 Australia
- 12.1.7 Indonesia
- 12.1.8 Phillipes
- 12.1.9 Singapore
- 12.1.10 Thailandc
- 12.1.11 Rest of Asia Pacific
- 13. South America Earth and Space Mining Sensors Market Analysis, Insights and Forecast, 2019-2031
- 13.1. Market Analysis, Insights and Forecast - By Country/Sub-region
- 13.1.1 Brazil
- 13.1.2 Argentina
- 13.1.3 Peru
- 13.1.4 Chile
- 13.1.5 Colombia
- 13.1.6 Ecuador
- 13.1.7 Venezuela
- 13.1.8 Rest of South America
- 14. North America Earth and Space Mining Sensors Market Analysis, Insights and Forecast, 2019-2031
- 14.1. Market Analysis, Insights and Forecast - By Country/Sub-region
- 14.1.1 United States
- 14.1.2 Canada
- 14.1.3 Mexico
- 15. MEA Earth and Space Mining Sensors Market Analysis, Insights and Forecast, 2019-2031
- 15.1. Market Analysis, Insights and Forecast - By Country/Sub-region
- 15.1.1 United Arab Emirates
- 15.1.2 Saudi Arabia
- 15.1.3 South Africa
- 15.1.4 Rest of Middle East and Africa
- 16. Competitive Analysis
- 16.1. Global Market Share Analysis 2024
- 16.2. Company Profiles
- 16.2.1 Rockwell Automation
- 16.2.1.1. Overview
- 16.2.1.2. Products
- 16.2.1.3. SWOT Analysis
- 16.2.1.4. Recent Developments
- 16.2.1.5. Financials (Based on Availability)
- 16.2.2 Texas Instruments
- 16.2.2.1. Overview
- 16.2.2.2. Products
- 16.2.2.3. SWOT Analysis
- 16.2.2.4. Recent Developments
- 16.2.2.5. Financials (Based on Availability)
- 16.2.3 Siemens
- 16.2.3.1. Overview
- 16.2.3.2. Products
- 16.2.3.3. SWOT Analysis
- 16.2.3.4. Recent Developments
- 16.2.3.5. Financials (Based on Availability)
- 16.2.4 STMicroelectronics
- 16.2.4.1. Overview
- 16.2.4.2. Products
- 16.2.4.3. SWOT Analysis
- 16.2.4.4. Recent Developments
- 16.2.4.5. Financials (Based on Availability)
- 16.2.5 Amphenol Corporation
- 16.2.5.1. Overview
- 16.2.5.2. Products
- 16.2.5.3. SWOT Analysis
- 16.2.5.4. Recent Developments
- 16.2.5.5. Financials (Based on Availability)
- 16.2.6 Honeywell International
- 16.2.6.1. Overview
- 16.2.6.2. Products
- 16.2.6.3. SWOT Analysis
- 16.2.6.4. Recent Developments
- 16.2.6.5. Financials (Based on Availability)
- 16.2.7 Deltion Innovation
- 16.2.7.1. Overview
- 16.2.7.2. Products
- 16.2.7.3. SWOT Analysis
- 16.2.7.4. Recent Developments
- 16.2.7.5. Financials (Based on Availability)
- 16.2.8 Robert Bosch GmbH
- 16.2.8.1. Overview
- 16.2.8.2. Products
- 16.2.8.3. SWOT Analysis
- 16.2.8.4. Recent Developments
- 16.2.8.5. Financials (Based on Availability)
- 16.2.9 InnaLabs
- 16.2.9.1. Overview
- 16.2.9.2. Products
- 16.2.9.3. SWOT Analysis
- 16.2.9.4. Recent Developments
- 16.2.9.5. Financials (Based on Availability)
- 16.2.10 DENSO Corporation
- 16.2.10.1. Overview
- 16.2.10.2. Products
- 16.2.10.3. SWOT Analysis
- 16.2.10.4. Recent Developments
- 16.2.10.5. Financials (Based on Availability)
- 16.2.1 Rockwell Automation
List of Figures
- Figure 1: Global Earth and Space Mining Sensors Market Revenue Breakdown (Million, %) by Region 2024 & 2032
- Figure 2: North America Earth and Space Mining Sensors Market Revenue (Million), by Country 2024 & 2032
- Figure 3: North America Earth and Space Mining Sensors Market Revenue Share (%), by Country 2024 & 2032
- Figure 4: Europe Earth and Space Mining Sensors Market Revenue (Million), by Country 2024 & 2032
- Figure 5: Europe Earth and Space Mining Sensors Market Revenue Share (%), by Country 2024 & 2032
- Figure 6: Asia Pacific Earth and Space Mining Sensors Market Revenue (Million), by Country 2024 & 2032
- Figure 7: Asia Pacific Earth and Space Mining Sensors Market Revenue Share (%), by Country 2024 & 2032
- Figure 8: South America Earth and Space Mining Sensors Market Revenue (Million), by Country 2024 & 2032
- Figure 9: South America Earth and Space Mining Sensors Market Revenue Share (%), by Country 2024 & 2032
- Figure 10: North America Earth and Space Mining Sensors Market Revenue (Million), by Country 2024 & 2032
- Figure 11: North America Earth and Space Mining Sensors Market Revenue Share (%), by Country 2024 & 2032
- Figure 12: MEA Earth and Space Mining Sensors Market Revenue (Million), by Country 2024 & 2032
- Figure 13: MEA Earth and Space Mining Sensors Market Revenue Share (%), by Country 2024 & 2032
- Figure 14: North America Earth and Space Mining Sensors Market Revenue (Million), by Earth mining 2024 & 2032
- Figure 15: North America Earth and Space Mining Sensors Market Revenue Share (%), by Earth mining 2024 & 2032
- Figure 16: North America Earth and Space Mining Sensors Market Revenue (Million), by space mining 2024 & 2032
- Figure 17: North America Earth and Space Mining Sensors Market Revenue Share (%), by space mining 2024 & 2032
- Figure 18: North America Earth and Space Mining Sensors Market Revenue (Million), by Country 2024 & 2032
- Figure 19: North America Earth and Space Mining Sensors Market Revenue Share (%), by Country 2024 & 2032
- Figure 20: Europe Earth and Space Mining Sensors Market Revenue (Million), by Earth mining 2024 & 2032
- Figure 21: Europe Earth and Space Mining Sensors Market Revenue Share (%), by Earth mining 2024 & 2032
- Figure 22: Europe Earth and Space Mining Sensors Market Revenue (Million), by space mining 2024 & 2032
- Figure 23: Europe Earth and Space Mining Sensors Market Revenue Share (%), by space mining 2024 & 2032
- Figure 24: Europe Earth and Space Mining Sensors Market Revenue (Million), by Country 2024 & 2032
- Figure 25: Europe Earth and Space Mining Sensors Market Revenue Share (%), by Country 2024 & 2032
- Figure 26: Asia Pacific Earth and Space Mining Sensors Market Revenue (Million), by Earth mining 2024 & 2032
- Figure 27: Asia Pacific Earth and Space Mining Sensors Market Revenue Share (%), by Earth mining 2024 & 2032
- Figure 28: Asia Pacific Earth and Space Mining Sensors Market Revenue (Million), by space mining 2024 & 2032
- Figure 29: Asia Pacific Earth and Space Mining Sensors Market Revenue Share (%), by space mining 2024 & 2032
- Figure 30: Asia Pacific Earth and Space Mining Sensors Market Revenue (Million), by Country 2024 & 2032
- Figure 31: Asia Pacific Earth and Space Mining Sensors Market Revenue Share (%), by Country 2024 & 2032
- Figure 32: Rest of the world Earth and Space Mining Sensors Market Revenue (Million), by Earth mining 2024 & 2032
- Figure 33: Rest of the world Earth and Space Mining Sensors Market Revenue Share (%), by Earth mining 2024 & 2032
- Figure 34: Rest of the world Earth and Space Mining Sensors Market Revenue (Million), by space mining 2024 & 2032
- Figure 35: Rest of the world Earth and Space Mining Sensors Market Revenue Share (%), by space mining 2024 & 2032
- Figure 36: Rest of the world Earth and Space Mining Sensors Market Revenue (Million), by Country 2024 & 2032
- Figure 37: Rest of the world Earth and Space Mining Sensors Market Revenue Share (%), by Country 2024 & 2032
List of Tables
- Table 1: Global Earth and Space Mining Sensors Market Revenue Million Forecast, by Region 2019 & 2032
- Table 2: Global Earth and Space Mining Sensors Market Revenue Million Forecast, by Earth mining 2019 & 2032
- Table 3: Global Earth and Space Mining Sensors Market Revenue Million Forecast, by space mining 2019 & 2032
- Table 4: Global Earth and Space Mining Sensors Market Revenue Million Forecast, by Region 2019 & 2032
- Table 5: Global Earth and Space Mining Sensors Market Revenue Million Forecast, by Country 2019 & 2032
- Table 6: United States Earth and Space Mining Sensors Market Revenue (Million) Forecast, by Application 2019 & 2032
- Table 7: Canada Earth and Space Mining Sensors Market Revenue (Million) Forecast, by Application 2019 & 2032
- Table 8: Mexico Earth and Space Mining Sensors Market Revenue (Million) Forecast, by Application 2019 & 2032
- Table 9: Global Earth and Space Mining Sensors Market Revenue Million Forecast, by Country 2019 & 2032
- Table 10: Germany Earth and Space Mining Sensors Market Revenue (Million) Forecast, by Application 2019 & 2032
- Table 11: United Kingdom Earth and Space Mining Sensors Market Revenue (Million) Forecast, by Application 2019 & 2032
- Table 12: France Earth and Space Mining Sensors Market Revenue (Million) Forecast, by Application 2019 & 2032
- Table 13: Spain Earth and Space Mining Sensors Market Revenue (Million) Forecast, by Application 2019 & 2032
- Table 14: Italy Earth and Space Mining Sensors Market Revenue (Million) Forecast, by Application 2019 & 2032
- Table 15: Spain Earth and Space Mining Sensors Market Revenue (Million) Forecast, by Application 2019 & 2032
- Table 16: Belgium Earth and Space Mining Sensors Market Revenue (Million) Forecast, by Application 2019 & 2032
- Table 17: Netherland Earth and Space Mining Sensors Market Revenue (Million) Forecast, by Application 2019 & 2032
- Table 18: Nordics Earth and Space Mining Sensors Market Revenue (Million) Forecast, by Application 2019 & 2032
- Table 19: Rest of Europe Earth and Space Mining Sensors Market Revenue (Million) Forecast, by Application 2019 & 2032
- Table 20: Global Earth and Space Mining Sensors Market Revenue Million Forecast, by Country 2019 & 2032
- Table 21: China Earth and Space Mining Sensors Market Revenue (Million) Forecast, by Application 2019 & 2032
- Table 22: Japan Earth and Space Mining Sensors Market Revenue (Million) Forecast, by Application 2019 & 2032
- Table 23: India Earth and Space Mining Sensors Market Revenue (Million) Forecast, by Application 2019 & 2032
- Table 24: South Korea Earth and Space Mining Sensors Market Revenue (Million) Forecast, by Application 2019 & 2032
- Table 25: Southeast Asia Earth and Space Mining Sensors Market Revenue (Million) Forecast, by Application 2019 & 2032
- Table 26: Australia Earth and Space Mining Sensors Market Revenue (Million) Forecast, by Application 2019 & 2032
- Table 27: Indonesia Earth and Space Mining Sensors Market Revenue (Million) Forecast, by Application 2019 & 2032
- Table 28: Phillipes Earth and Space Mining Sensors Market Revenue (Million) Forecast, by Application 2019 & 2032
- Table 29: Singapore Earth and Space Mining Sensors Market Revenue (Million) Forecast, by Application 2019 & 2032
- Table 30: Thailandc Earth and Space Mining Sensors Market Revenue (Million) Forecast, by Application 2019 & 2032
- Table 31: Rest of Asia Pacific Earth and Space Mining Sensors Market Revenue (Million) Forecast, by Application 2019 & 2032
- Table 32: Global Earth and Space Mining Sensors Market Revenue Million Forecast, by Country 2019 & 2032
- Table 33: Brazil Earth and Space Mining Sensors Market Revenue (Million) Forecast, by Application 2019 & 2032
- Table 34: Argentina Earth and Space Mining Sensors Market Revenue (Million) Forecast, by Application 2019 & 2032
- Table 35: Peru Earth and Space Mining Sensors Market Revenue (Million) Forecast, by Application 2019 & 2032
- Table 36: Chile Earth and Space Mining Sensors Market Revenue (Million) Forecast, by Application 2019 & 2032
- Table 37: Colombia Earth and Space Mining Sensors Market Revenue (Million) Forecast, by Application 2019 & 2032
- Table 38: Ecuador Earth and Space Mining Sensors Market Revenue (Million) Forecast, by Application 2019 & 2032
- Table 39: Venezuela Earth and Space Mining Sensors Market Revenue (Million) Forecast, by Application 2019 & 2032
- Table 40: Rest of South America Earth and Space Mining Sensors Market Revenue (Million) Forecast, by Application 2019 & 2032
- Table 41: Global Earth and Space Mining Sensors Market Revenue Million Forecast, by Country 2019 & 2032
- Table 42: United States Earth and Space Mining Sensors Market Revenue (Million) Forecast, by Application 2019 & 2032
- Table 43: Canada Earth and Space Mining Sensors Market Revenue (Million) Forecast, by Application 2019 & 2032
- Table 44: Mexico Earth and Space Mining Sensors Market Revenue (Million) Forecast, by Application 2019 & 2032
- Table 45: Global Earth and Space Mining Sensors Market Revenue Million Forecast, by Country 2019 & 2032
- Table 46: United Arab Emirates Earth and Space Mining Sensors Market Revenue (Million) Forecast, by Application 2019 & 2032
- Table 47: Saudi Arabia Earth and Space Mining Sensors Market Revenue (Million) Forecast, by Application 2019 & 2032
- Table 48: South Africa Earth and Space Mining Sensors Market Revenue (Million) Forecast, by Application 2019 & 2032
- Table 49: Rest of Middle East and Africa Earth and Space Mining Sensors Market Revenue (Million) Forecast, by Application 2019 & 2032
- Table 50: Global Earth and Space Mining Sensors Market Revenue Million Forecast, by Earth mining 2019 & 2032
- Table 51: Global Earth and Space Mining Sensors Market Revenue Million Forecast, by space mining 2019 & 2032
- Table 52: Global Earth and Space Mining Sensors Market Revenue Million Forecast, by Country 2019 & 2032
- Table 53: US Earth and Space Mining Sensors Market Revenue (Million) Forecast, by Application 2019 & 2032
- Table 54: Canada Earth and Space Mining Sensors Market Revenue (Million) Forecast, by Application 2019 & 2032
- Table 55: Mexico Earth and Space Mining Sensors Market Revenue (Million) Forecast, by Application 2019 & 2032
- Table 56: Rest of NA Earth and Space Mining Sensors Market Revenue (Million) Forecast, by Application 2019 & 2032
- Table 57: Global Earth and Space Mining Sensors Market Revenue Million Forecast, by Earth mining 2019 & 2032
- Table 58: Global Earth and Space Mining Sensors Market Revenue Million Forecast, by space mining 2019 & 2032
- Table 59: Global Earth and Space Mining Sensors Market Revenue Million Forecast, by Country 2019 & 2032
- Table 60: Germany Earth and Space Mining Sensors Market Revenue (Million) Forecast, by Application 2019 & 2032
- Table 61: UK Earth and Space Mining Sensors Market Revenue (Million) Forecast, by Application 2019 & 2032
- Table 62: France Earth and Space Mining Sensors Market Revenue (Million) Forecast, by Application 2019 & 2032
- Table 63: Russia Earth and Space Mining Sensors Market Revenue (Million) Forecast, by Application 2019 & 2032
- Table 64: Spain Earth and Space Mining Sensors Market Revenue (Million) Forecast, by Application 2019 & 2032
- Table 65: Rest of NA Earth and Space Mining Sensors Market Revenue (Million) Forecast, by Application 2019 & 2032
- Table 66: Global Earth and Space Mining Sensors Market Revenue Million Forecast, by Earth mining 2019 & 2032
- Table 67: Global Earth and Space Mining Sensors Market Revenue Million Forecast, by space mining 2019 & 2032
- Table 68: Global Earth and Space Mining Sensors Market Revenue Million Forecast, by Country 2019 & 2032
- Table 69: India Earth and Space Mining Sensors Market Revenue (Million) Forecast, by Application 2019 & 2032
- Table 70: China Earth and Space Mining Sensors Market Revenue (Million) Forecast, by Application 2019 & 2032
- Table 71: Japan Earth and Space Mining Sensors Market Revenue (Million) Forecast, by Application 2019 & 2032
- Table 72: Rest of AP Earth and Space Mining Sensors Market Revenue (Million) Forecast, by Application 2019 & 2032
- Table 73: Global Earth and Space Mining Sensors Market Revenue Million Forecast, by Earth mining 2019 & 2032
- Table 74: Global Earth and Space Mining Sensors Market Revenue Million Forecast, by space mining 2019 & 2032
- Table 75: Global Earth and Space Mining Sensors Market Revenue Million Forecast, by Country 2019 & 2032
Frequently Asked Questions
1. What is the projected Compound Annual Growth Rate (CAGR) of the Earth and Space Mining Sensors Market?
The projected CAGR is approximately > 18.00%.
2. Which companies are prominent players in the Earth and Space Mining Sensors Market?
Key companies in the market include Rockwell Automation, Texas Instruments, Siemens, STMicroelectronics, Amphenol Corporation, Honeywell International, Deltion Innovation, Robert Bosch GmbH, InnaLabs, DENSO Corporation.
3. What are the main segments of the Earth and Space Mining Sensors Market?
The market segments include Earth mining, space mining.
4. Can you provide details about the market size?
The market size is estimated to be USD XX Million as of 2022.
5. What are some drivers contributing to market growth?
Increasing demand from consumer electronics; Rising adoption of IoT.
6. What are the notable trends driving market growth?
Various Government Initiatives Aimed Toward Space Mining.
7. Are there any restraints impacting market growth?
Intense Competition in the Market.
8. Can you provide examples of recent developments in the market?
N/A
9. What pricing options are available for accessing the report?
Pricing options include single-user, multi-user, and enterprise licenses priced at USD 4750, USD 5250, and USD 8750 respectively.
10. Is the market size provided in terms of value or volume?
The market size is provided in terms of value, measured in Million.
11. Are there any specific market keywords associated with the report?
Yes, the market keyword associated with the report is "Earth and Space Mining Sensors Market," which aids in identifying and referencing the specific market segment covered.
12. How do I determine which pricing option suits my needs best?
The pricing options vary based on user requirements and access needs. Individual users may opt for single-user licenses, while businesses requiring broader access may choose multi-user or enterprise licenses for cost-effective access to the report.
13. Are there any additional resources or data provided in the Earth and Space Mining Sensors Market report?
While the report offers comprehensive insights, it's advisable to review the specific contents or supplementary materials provided to ascertain if additional resources or data are available.
14. How can I stay updated on further developments or reports in the Earth and Space Mining Sensors Market?
To stay informed about further developments, trends, and reports in the Earth and Space Mining Sensors Market, consider subscribing to industry newsletters, following relevant companies and organizations, or regularly checking reputable industry news sources and publications.
Methodology
Step 1 - Identification of Relevant Samples Size from Population Database


Step 2 - Approaches for Defining Global Market Size (Value, Volume* & Price*)

Note*: In applicable scenarios
Step 3 - Data Sources
Primary Research
- Web Analytics
- Survey Reports
- Research Institute
- Latest Research Reports
- Opinion Leaders
Secondary Research
- Annual Reports
- White Paper
- Latest Press Release
- Industry Association
- Paid Database
- Investor Presentations

Step 4 - Data Triangulation
Involves using different sources of information in order to increase the validity of a study
These sources are likely to be stakeholders in a program - participants, other researchers, program staff, other community members, and so on.
Then we put all data in single framework & apply various statistical tools to find out the dynamic on the market.
During the analysis stage, feedback from the stakeholder groups would be compared to determine areas of agreement as well as areas of divergence


