
Key Insights
The Indian e-commerce market is experiencing explosive growth, projected to reach a substantial size, driven by increasing internet and smartphone penetration, rising disposable incomes, and a burgeoning young population embracing online shopping. The 21.50% CAGR from 2019-2024 indicates a robust expansion trajectory, a trend expected to continue throughout the forecast period (2025-2033). Key drivers include the expansion of logistics infrastructure, improved payment gateway options (including digital wallets and UPI), and the increasing adoption of e-commerce by businesses of all sizes, leading to wider product selection and competitive pricing. The market is segmented by application (e.g., fashion, groceries, electronics), with significant competition among major players like Amazon, Flipkart, Nykaa, and Ajio, vying for market share across diverse product categories. Regional variations exist, with the North and West regions possibly leading in terms of market size due to higher internet penetration and purchasing power, although this requires further data analysis to confirm. Despite the robust growth, challenges remain, including concerns around cybersecurity, logistics bottlenecks in certain regions, and the need for further investment in digital literacy, particularly in rural areas, to fully unlock the market's potential.
The success of major players like Flipkart and Amazon demonstrates the market's maturity and consumer trust, while the growth of specialized players such as Nykaa (beauty and personal care) highlights niche opportunities. The forecast period (2025-2033) presents significant opportunities for both established companies and new entrants seeking to capitalize on India’s expanding digital economy. Strategies focusing on localized services, targeted marketing to specific demographics, and robust customer service will be crucial for navigating the competitive landscape and achieving sustained growth. Sustaining this high growth will require ongoing investment in technological infrastructure, improving last-mile delivery capabilities, and effectively addressing consumer concerns regarding data security and authenticity of products. A diversified approach, targeting both urban and rural markets with tailored solutions, is vital for future success.
E-commerce Industry in India: A Comprehensive Market Report (2019-2033)
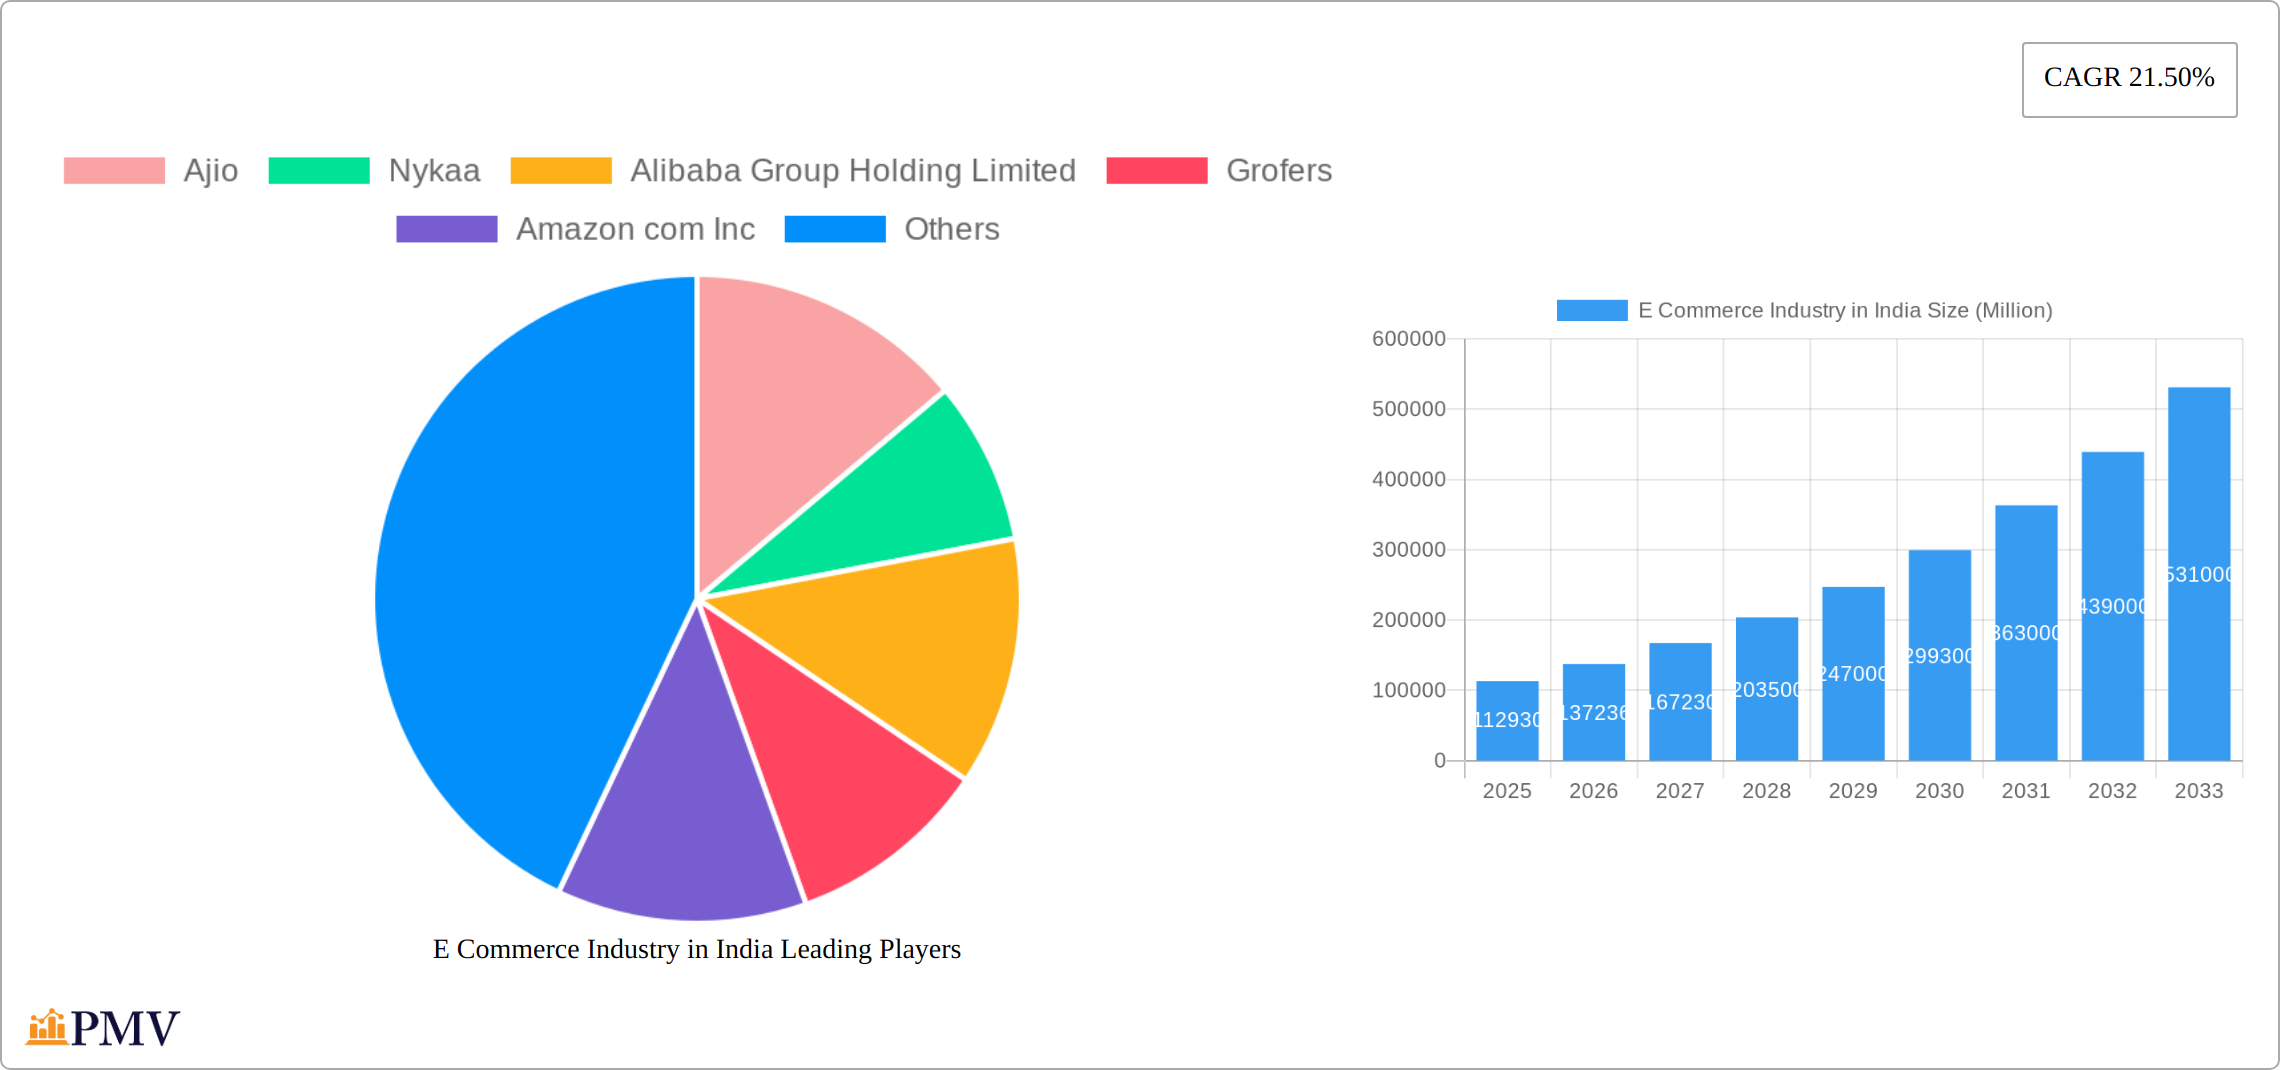
This detailed report provides a comprehensive analysis of the Indian e-commerce industry, covering market structure, competitive dynamics, growth drivers, challenges, and future outlook. The study period spans from 2019 to 2033, with 2025 as the base and estimated year. The forecast period is 2025-2033, and the historical period is 2019-2024. The report offers actionable insights for businesses operating in or considering entry into this rapidly evolving market. Key players analyzed include Ajio, Nykaa, Alibaba Group Holding Limited, Grofers, Amazon com Inc, Flipkart Private Limited, Purplle, eBay Inc, Snapdeal, and Apple Inc.
E Commerce Industry in India Market Structure & Competitive Dynamics
The Indian e-commerce market is characterized by intense competition, with a few dominant players and a large number of smaller companies. Market concentration is high in certain segments, particularly online retail, with Flipkart and Amazon commanding significant market share (estimated at xx Million USD and xx Million USD respectively in 2025). The regulatory framework, while evolving, plays a crucial role in shaping competition, impacting areas like data privacy and cross-border transactions. Innovation ecosystems are vibrant, with significant investment in technology and logistics driving improvements in delivery times and customer experience. Product substitution is prevalent, with consumers easily switching between platforms based on pricing, promotions, and product availability. The M&A landscape is active, with significant deals shaping the competitive landscape. For instance, recent M&A activity has involved investments totaling xx Million USD in 2024 alone, signifying consolidation within the sector. End-user trends indicate a shift towards mobile commerce and personalized shopping experiences.
E Commerce Industry in India Industry Trends & Insights
The Indian e-commerce market is experiencing robust growth, driven by increasing internet and smartphone penetration, rising disposable incomes, and a preference for convenient online shopping. The Compound Annual Growth Rate (CAGR) for the period 2025-2033 is projected to be xx%, indicating significant market expansion. Market penetration is also increasing steadily, with a significant portion of the population now actively engaged in online shopping. Technological disruptions, including the adoption of artificial intelligence (AI), big data analytics, and blockchain technology, are transforming the industry, improving operational efficiency and personalizing customer experiences. Consumer preferences are evolving, with increasing demand for personalized recommendations, seamless payment gateways, and fast and reliable delivery services. Competitive dynamics remain intense, with companies investing heavily in logistics, technology, and marketing to gain a competitive edge. This translates to an estimated market size of xx Million USD by 2033.

Dominant Markets & Segments in E Commerce Industry in India
The Indian e-commerce market is geographically diverse, with significant variations in growth rates and market penetration across different regions. While urban areas currently dominate, the growth potential in rural areas is significant, presenting substantial opportunities for expansion. The leading segments in the market are likely to remain fashion and apparel, electronics, and groceries, due to:
- High demand: Driven by increasing consumer spending and changing lifestyles.
- Favorable regulatory environment: Supportive policies for e-commerce and digital payments.
- Technological advancements: Improving logistics and supply chains, enhancing customer experience.
- Infrastructure development: Expanding internet and mobile connectivity, reaching wider consumer bases.
A deeper analysis reveals that the fashion and apparel segment is projected to hold the largest market share by 2033 (xx Million USD), fueled by factors such as increasing fashion consciousness, especially among younger demographics, and growing availability of affordable and stylish products online.
E Commerce Industry in India Product Innovations
Recent product innovations in the Indian e-commerce sector focus on improving the customer experience through personalized recommendations, enhanced search functionalities, and seamless checkout processes. Technological advancements in areas such as AI-powered chatbots, augmented reality (AR) applications for virtual try-ons, and drone delivery are enhancing convenience and engagement. These innovations are improving market fit by catering to specific consumer preferences and solving pain points, thus driving market growth.
Report Segmentation & Scope
This report segments the Indian e-commerce market by application, providing detailed analysis for each segment. This segmentation includes but is not limited to categories like fashion and apparel, electronics, groceries, beauty and personal care, and others. Each segment's growth projections, market sizes, and competitive dynamics are analyzed separately, providing a granular understanding of the market landscape. The report encompasses both B2C and B2B e-commerce activities, offering insights into the entire ecosystem. Each segment presents distinct opportunities and challenges, contributing to the overall growth of the Indian e-commerce market.
Key Drivers of E Commerce Industry in India Growth
Several factors are driving the growth of the Indian e-commerce sector. These include:
- Increasing smartphone and internet penetration: Expanding the potential customer base.
- Rising disposable incomes: Enabling higher consumer spending on online purchases.
- Government initiatives: Promoting digitalization and e-commerce adoption.
- Improved logistics infrastructure: Facilitating faster and more reliable deliveries.
- Technological advancements: Enhancing the customer experience and operational efficiency.
These factors collectively fuel rapid market expansion and create lucrative opportunities for businesses.
Challenges in the E Commerce Industry in India Sector
Despite significant growth, the Indian e-commerce industry faces several challenges. These include:
- Complex regulatory landscape: Navigating changing rules and regulations related to data privacy, cross-border transactions, and taxation.
- Logistical hurdles: Addressing infrastructure gaps and ensuring efficient delivery in diverse geographical conditions.
- Intense competition: Managing competitive pressures from both domestic and international players.
- Cybersecurity threats: Protecting consumer data and preventing fraud.
- Payment gateway challenges: Ensuring reliable and secure payment processing for a diverse customer base.
These factors impact profitability and require continuous adaptation by businesses.
Leading Players in the E Commerce Industry in India Market
- Ajio
- Nykaa
- Alibaba Group Holding Limited
- Grofers
- Amazon com Inc
- Flipkart Private Limited
- Purplle
- eBay Inc
- Snapdeal
- Apple Inc
Key Developments in E Commerce Industry in India Sector
- June 2023: Amazon commits to investing an additional USD 15 billion in India, taking its total investment to USD 26 billion, with plans to digitize 10 million small businesses, enable USD 20 billion in exports, and create two million jobs by 2025. This significantly boosts its market position and strengthens its commitment to the Indian market.
- January 2023: Flipkart's Singapore-based parent invests INR 722 Cr (USD 90 Million) in its Indian marketplace arm. This injection of capital strengthens Flipkart's competitive position and facilitates further expansion.
Strategic E Commerce Industry in India Market Outlook
The Indian e-commerce market holds immense future potential, driven by continued growth in internet and smartphone penetration, increasing disposable incomes, and evolving consumer preferences. Strategic opportunities exist for companies that can effectively leverage technology, optimize logistics, and tailor their offerings to the diverse needs of the Indian consumer. The focus on personalized experiences, seamless payment gateways, and efficient delivery systems will be crucial for success in this dynamic market. The long-term growth trajectory remains positive, offering significant returns for businesses that can navigate the challenges and capitalize on the opportunities.
E Commerce Industry in India Segmentation
-
1. B2C E-commerce
- 1.1. Beauty and Personal Care
- 1.2. Consumer Electronics
- 1.3. Fashion and Apparel
- 1.4. Food and Beverage
- 1.5. Furniture and Home
- 1.6. Other Applications (Toys, DIY, Media, Etc.)
-
2. Business models
- 2.1. B2C E-commerce
- 2.2. B2B E-commerce
-
3. Geography
- 3.1. Tier-I cities
- 3.2. Tier-II and tier-III cities
E Commerce Industry in India Segmentation By Geography
-
1. North America
- 1.1. United States
- 1.2. Canada
- 1.3. Mexico
-
2. South America
- 2.1. Brazil
- 2.2. Argentina
- 2.3. Rest of South America
-
3. Europe
- 3.1. United Kingdom
- 3.2. Germany
- 3.3. France
- 3.4. Italy
- 3.5. Spain
- 3.6. Russia
- 3.7. Benelux
- 3.8. Nordics
- 3.9. Rest of Europe
-
4. Middle East & Africa
- 4.1. Turkey
- 4.2. Israel
- 4.3. GCC
- 4.4. North Africa
- 4.5. South Africa
- 4.6. Rest of Middle East & Africa
-
5. Asia Pacific
- 5.1. China
- 5.2. India
- 5.3. Japan
- 5.4. South Korea
- 5.5. ASEAN
- 5.6. Oceania
- 5.7. Rest of Asia Pacific

E Commerce Industry in India REPORT HIGHLIGHTS
| Aspects | Details |
|---|---|
| Study Period | 2019-2033 |
| Base Year | 2024 |
| Estimated Year | 2025 |
| Forecast Period | 2025-2033 |
| Historical Period | 2019-2024 |
| Growth Rate | CAGR of 21.50% from 2019-2033 |
| Segmentation |
|
Table of Contents
- 1. Introduction
- 1.1. Research Scope
- 1.2. Market Segmentation
- 1.3. Research Methodology
- 1.4. Definitions and Assumptions
- 2. Executive Summary
- 2.1. Introduction
- 3. Market Dynamics
- 3.1. Introduction
- 3.2. Market Drivers
- 3.2.1. Increased Internet Penetration Across the Country; Supportive Government Policies and Regulatory Framework
- 3.3. Market Restrains
- 3.3.1. Privacy and security concerns
- 3.4. Market Trends
- 3.4.1. Internet Plays a Significant Role in Market Growth
- 4. Market Factor Analysis
- 4.1. Porters Five Forces
- 4.2. Supply/Value Chain
- 4.3. PESTEL analysis
- 4.4. Market Entropy
- 4.5. Patent/Trademark Analysis
- 5. Global E Commerce Industry in India Analysis, Insights and Forecast, 2019-2031
- 5.1. Market Analysis, Insights and Forecast - by B2C E-commerce
- 5.1.1. Beauty and Personal Care
- 5.1.2. Consumer Electronics
- 5.1.3. Fashion and Apparel
- 5.1.4. Food and Beverage
- 5.1.5. Furniture and Home
- 5.1.6. Other Applications (Toys, DIY, Media, Etc.)
- 5.2. Market Analysis, Insights and Forecast - by Business models
- 5.2.1. B2C E-commerce
- 5.2.2. B2B E-commerce
- 5.3. Market Analysis, Insights and Forecast - by Geography
- 5.3.1. Tier-I cities
- 5.3.2. Tier-II and tier-III cities
- 5.4. Market Analysis, Insights and Forecast - by Region
- 5.4.1. North America
- 5.4.2. South America
- 5.4.3. Europe
- 5.4.4. Middle East & Africa
- 5.4.5. Asia Pacific
- 5.1. Market Analysis, Insights and Forecast - by B2C E-commerce
- 6. North America E Commerce Industry in India Analysis, Insights and Forecast, 2019-2031
- 6.1. Market Analysis, Insights and Forecast - by B2C E-commerce
- 6.1.1. Beauty and Personal Care
- 6.1.2. Consumer Electronics
- 6.1.3. Fashion and Apparel
- 6.1.4. Food and Beverage
- 6.1.5. Furniture and Home
- 6.1.6. Other Applications (Toys, DIY, Media, Etc.)
- 6.2. Market Analysis, Insights and Forecast - by Business models
- 6.2.1. B2C E-commerce
- 6.2.2. B2B E-commerce
- 6.3. Market Analysis, Insights and Forecast - by Geography
- 6.3.1. Tier-I cities
- 6.3.2. Tier-II and tier-III cities
- 6.1. Market Analysis, Insights and Forecast - by B2C E-commerce
- 7. South America E Commerce Industry in India Analysis, Insights and Forecast, 2019-2031
- 7.1. Market Analysis, Insights and Forecast - by B2C E-commerce
- 7.1.1. Beauty and Personal Care
- 7.1.2. Consumer Electronics
- 7.1.3. Fashion and Apparel
- 7.1.4. Food and Beverage
- 7.1.5. Furniture and Home
- 7.1.6. Other Applications (Toys, DIY, Media, Etc.)
- 7.2. Market Analysis, Insights and Forecast - by Business models
- 7.2.1. B2C E-commerce
- 7.2.2. B2B E-commerce
- 7.3. Market Analysis, Insights and Forecast - by Geography
- 7.3.1. Tier-I cities
- 7.3.2. Tier-II and tier-III cities
- 7.1. Market Analysis, Insights and Forecast - by B2C E-commerce
- 8. Europe E Commerce Industry in India Analysis, Insights and Forecast, 2019-2031
- 8.1. Market Analysis, Insights and Forecast - by B2C E-commerce
- 8.1.1. Beauty and Personal Care
- 8.1.2. Consumer Electronics
- 8.1.3. Fashion and Apparel
- 8.1.4. Food and Beverage
- 8.1.5. Furniture and Home
- 8.1.6. Other Applications (Toys, DIY, Media, Etc.)
- 8.2. Market Analysis, Insights and Forecast - by Business models
- 8.2.1. B2C E-commerce
- 8.2.2. B2B E-commerce
- 8.3. Market Analysis, Insights and Forecast - by Geography
- 8.3.1. Tier-I cities
- 8.3.2. Tier-II and tier-III cities
- 8.1. Market Analysis, Insights and Forecast - by B2C E-commerce
- 9. Middle East & Africa E Commerce Industry in India Analysis, Insights and Forecast, 2019-2031
- 9.1. Market Analysis, Insights and Forecast - by B2C E-commerce
- 9.1.1. Beauty and Personal Care
- 9.1.2. Consumer Electronics
- 9.1.3. Fashion and Apparel
- 9.1.4. Food and Beverage
- 9.1.5. Furniture and Home
- 9.1.6. Other Applications (Toys, DIY, Media, Etc.)
- 9.2. Market Analysis, Insights and Forecast - by Business models
- 9.2.1. B2C E-commerce
- 9.2.2. B2B E-commerce
- 9.3. Market Analysis, Insights and Forecast - by Geography
- 9.3.1. Tier-I cities
- 9.3.2. Tier-II and tier-III cities
- 9.1. Market Analysis, Insights and Forecast - by B2C E-commerce
- 10. Asia Pacific E Commerce Industry in India Analysis, Insights and Forecast, 2019-2031
- 10.1. Market Analysis, Insights and Forecast - by B2C E-commerce
- 10.1.1. Beauty and Personal Care
- 10.1.2. Consumer Electronics
- 10.1.3. Fashion and Apparel
- 10.1.4. Food and Beverage
- 10.1.5. Furniture and Home
- 10.1.6. Other Applications (Toys, DIY, Media, Etc.)
- 10.2. Market Analysis, Insights and Forecast - by Business models
- 10.2.1. B2C E-commerce
- 10.2.2. B2B E-commerce
- 10.3. Market Analysis, Insights and Forecast - by Geography
- 10.3.1. Tier-I cities
- 10.3.2. Tier-II and tier-III cities
- 10.1. Market Analysis, Insights and Forecast - by B2C E-commerce
- 11. North India E Commerce Industry in India Analysis, Insights and Forecast, 2019-2031
- 12. South India E Commerce Industry in India Analysis, Insights and Forecast, 2019-2031
- 13. East India E Commerce Industry in India Analysis, Insights and Forecast, 2019-2031
- 14. West India E Commerce Industry in India Analysis, Insights and Forecast, 2019-2031
- 15. Competitive Analysis
- 15.1. Global Market Share Analysis 2024
- 15.2. Company Profiles
- 15.2.1 Ajio
- 15.2.1.1. Overview
- 15.2.1.2. Products
- 15.2.1.3. SWOT Analysis
- 15.2.1.4. Recent Developments
- 15.2.1.5. Financials (Based on Availability)
- 15.2.2 Nykaa
- 15.2.2.1. Overview
- 15.2.2.2. Products
- 15.2.2.3. SWOT Analysis
- 15.2.2.4. Recent Developments
- 15.2.2.5. Financials (Based on Availability)
- 15.2.3 Alibaba Group Holding Limited
- 15.2.3.1. Overview
- 15.2.3.2. Products
- 15.2.3.3. SWOT Analysis
- 15.2.3.4. Recent Developments
- 15.2.3.5. Financials (Based on Availability)
- 15.2.4 Grofers
- 15.2.4.1. Overview
- 15.2.4.2. Products
- 15.2.4.3. SWOT Analysis
- 15.2.4.4. Recent Developments
- 15.2.4.5. Financials (Based on Availability)
- 15.2.5 Amazon com Inc
- 15.2.5.1. Overview
- 15.2.5.2. Products
- 15.2.5.3. SWOT Analysis
- 15.2.5.4. Recent Developments
- 15.2.5.5. Financials (Based on Availability)
- 15.2.6 Flipkart Private Limited
- 15.2.6.1. Overview
- 15.2.6.2. Products
- 15.2.6.3. SWOT Analysis
- 15.2.6.4. Recent Developments
- 15.2.6.5. Financials (Based on Availability)
- 15.2.7 Purplle
- 15.2.7.1. Overview
- 15.2.7.2. Products
- 15.2.7.3. SWOT Analysis
- 15.2.7.4. Recent Developments
- 15.2.7.5. Financials (Based on Availability)
- 15.2.8 eBay Inc
- 15.2.8.1. Overview
- 15.2.8.2. Products
- 15.2.8.3. SWOT Analysis
- 15.2.8.4. Recent Developments
- 15.2.8.5. Financials (Based on Availability)
- 15.2.9 Snapdeal
- 15.2.9.1. Overview
- 15.2.9.2. Products
- 15.2.9.3. SWOT Analysis
- 15.2.9.4. Recent Developments
- 15.2.9.5. Financials (Based on Availability)
- 15.2.10 Apple Inc
- 15.2.10.1. Overview
- 15.2.10.2. Products
- 15.2.10.3. SWOT Analysis
- 15.2.10.4. Recent Developments
- 15.2.10.5. Financials (Based on Availability)
- 15.2.1 Ajio
List of Figures
- Figure 1: Global E Commerce Industry in India Revenue Breakdown (Million, %) by Region 2024 & 2032
- Figure 2: Global E Commerce Industry in India Volume Breakdown (K Unit, %) by Region 2024 & 2032
- Figure 3: India E Commerce Industry in India Revenue (Million), by Country 2024 & 2032
- Figure 4: India E Commerce Industry in India Volume (K Unit), by Country 2024 & 2032
- Figure 5: India E Commerce Industry in India Revenue Share (%), by Country 2024 & 2032
- Figure 6: India E Commerce Industry in India Volume Share (%), by Country 2024 & 2032
- Figure 7: North America E Commerce Industry in India Revenue (Million), by B2C E-commerce 2024 & 2032
- Figure 8: North America E Commerce Industry in India Volume (K Unit), by B2C E-commerce 2024 & 2032
- Figure 9: North America E Commerce Industry in India Revenue Share (%), by B2C E-commerce 2024 & 2032
- Figure 10: North America E Commerce Industry in India Volume Share (%), by B2C E-commerce 2024 & 2032
- Figure 11: North America E Commerce Industry in India Revenue (Million), by Business models 2024 & 2032
- Figure 12: North America E Commerce Industry in India Volume (K Unit), by Business models 2024 & 2032
- Figure 13: North America E Commerce Industry in India Revenue Share (%), by Business models 2024 & 2032
- Figure 14: North America E Commerce Industry in India Volume Share (%), by Business models 2024 & 2032
- Figure 15: North America E Commerce Industry in India Revenue (Million), by Geography 2024 & 2032
- Figure 16: North America E Commerce Industry in India Volume (K Unit), by Geography 2024 & 2032
- Figure 17: North America E Commerce Industry in India Revenue Share (%), by Geography 2024 & 2032
- Figure 18: North America E Commerce Industry in India Volume Share (%), by Geography 2024 & 2032
- Figure 19: North America E Commerce Industry in India Revenue (Million), by Country 2024 & 2032
- Figure 20: North America E Commerce Industry in India Volume (K Unit), by Country 2024 & 2032
- Figure 21: North America E Commerce Industry in India Revenue Share (%), by Country 2024 & 2032
- Figure 22: North America E Commerce Industry in India Volume Share (%), by Country 2024 & 2032
- Figure 23: South America E Commerce Industry in India Revenue (Million), by B2C E-commerce 2024 & 2032
- Figure 24: South America E Commerce Industry in India Volume (K Unit), by B2C E-commerce 2024 & 2032
- Figure 25: South America E Commerce Industry in India Revenue Share (%), by B2C E-commerce 2024 & 2032
- Figure 26: South America E Commerce Industry in India Volume Share (%), by B2C E-commerce 2024 & 2032
- Figure 27: South America E Commerce Industry in India Revenue (Million), by Business models 2024 & 2032
- Figure 28: South America E Commerce Industry in India Volume (K Unit), by Business models 2024 & 2032
- Figure 29: South America E Commerce Industry in India Revenue Share (%), by Business models 2024 & 2032
- Figure 30: South America E Commerce Industry in India Volume Share (%), by Business models 2024 & 2032
- Figure 31: South America E Commerce Industry in India Revenue (Million), by Geography 2024 & 2032
- Figure 32: South America E Commerce Industry in India Volume (K Unit), by Geography 2024 & 2032
- Figure 33: South America E Commerce Industry in India Revenue Share (%), by Geography 2024 & 2032
- Figure 34: South America E Commerce Industry in India Volume Share (%), by Geography 2024 & 2032
- Figure 35: South America E Commerce Industry in India Revenue (Million), by Country 2024 & 2032
- Figure 36: South America E Commerce Industry in India Volume (K Unit), by Country 2024 & 2032
- Figure 37: South America E Commerce Industry in India Revenue Share (%), by Country 2024 & 2032
- Figure 38: South America E Commerce Industry in India Volume Share (%), by Country 2024 & 2032
- Figure 39: Europe E Commerce Industry in India Revenue (Million), by B2C E-commerce 2024 & 2032
- Figure 40: Europe E Commerce Industry in India Volume (K Unit), by B2C E-commerce 2024 & 2032
- Figure 41: Europe E Commerce Industry in India Revenue Share (%), by B2C E-commerce 2024 & 2032
- Figure 42: Europe E Commerce Industry in India Volume Share (%), by B2C E-commerce 2024 & 2032
- Figure 43: Europe E Commerce Industry in India Revenue (Million), by Business models 2024 & 2032
- Figure 44: Europe E Commerce Industry in India Volume (K Unit), by Business models 2024 & 2032
- Figure 45: Europe E Commerce Industry in India Revenue Share (%), by Business models 2024 & 2032
- Figure 46: Europe E Commerce Industry in India Volume Share (%), by Business models 2024 & 2032
- Figure 47: Europe E Commerce Industry in India Revenue (Million), by Geography 2024 & 2032
- Figure 48: Europe E Commerce Industry in India Volume (K Unit), by Geography 2024 & 2032
- Figure 49: Europe E Commerce Industry in India Revenue Share (%), by Geography 2024 & 2032
- Figure 50: Europe E Commerce Industry in India Volume Share (%), by Geography 2024 & 2032
- Figure 51: Europe E Commerce Industry in India Revenue (Million), by Country 2024 & 2032
- Figure 52: Europe E Commerce Industry in India Volume (K Unit), by Country 2024 & 2032
- Figure 53: Europe E Commerce Industry in India Revenue Share (%), by Country 2024 & 2032
- Figure 54: Europe E Commerce Industry in India Volume Share (%), by Country 2024 & 2032
- Figure 55: Middle East & Africa E Commerce Industry in India Revenue (Million), by B2C E-commerce 2024 & 2032
- Figure 56: Middle East & Africa E Commerce Industry in India Volume (K Unit), by B2C E-commerce 2024 & 2032
- Figure 57: Middle East & Africa E Commerce Industry in India Revenue Share (%), by B2C E-commerce 2024 & 2032
- Figure 58: Middle East & Africa E Commerce Industry in India Volume Share (%), by B2C E-commerce 2024 & 2032
- Figure 59: Middle East & Africa E Commerce Industry in India Revenue (Million), by Business models 2024 & 2032
- Figure 60: Middle East & Africa E Commerce Industry in India Volume (K Unit), by Business models 2024 & 2032
- Figure 61: Middle East & Africa E Commerce Industry in India Revenue Share (%), by Business models 2024 & 2032
- Figure 62: Middle East & Africa E Commerce Industry in India Volume Share (%), by Business models 2024 & 2032
- Figure 63: Middle East & Africa E Commerce Industry in India Revenue (Million), by Geography 2024 & 2032
- Figure 64: Middle East & Africa E Commerce Industry in India Volume (K Unit), by Geography 2024 & 2032
- Figure 65: Middle East & Africa E Commerce Industry in India Revenue Share (%), by Geography 2024 & 2032
- Figure 66: Middle East & Africa E Commerce Industry in India Volume Share (%), by Geography 2024 & 2032
- Figure 67: Middle East & Africa E Commerce Industry in India Revenue (Million), by Country 2024 & 2032
- Figure 68: Middle East & Africa E Commerce Industry in India Volume (K Unit), by Country 2024 & 2032
- Figure 69: Middle East & Africa E Commerce Industry in India Revenue Share (%), by Country 2024 & 2032
- Figure 70: Middle East & Africa E Commerce Industry in India Volume Share (%), by Country 2024 & 2032
- Figure 71: Asia Pacific E Commerce Industry in India Revenue (Million), by B2C E-commerce 2024 & 2032
- Figure 72: Asia Pacific E Commerce Industry in India Volume (K Unit), by B2C E-commerce 2024 & 2032
- Figure 73: Asia Pacific E Commerce Industry in India Revenue Share (%), by B2C E-commerce 2024 & 2032
- Figure 74: Asia Pacific E Commerce Industry in India Volume Share (%), by B2C E-commerce 2024 & 2032
- Figure 75: Asia Pacific E Commerce Industry in India Revenue (Million), by Business models 2024 & 2032
- Figure 76: Asia Pacific E Commerce Industry in India Volume (K Unit), by Business models 2024 & 2032
- Figure 77: Asia Pacific E Commerce Industry in India Revenue Share (%), by Business models 2024 & 2032
- Figure 78: Asia Pacific E Commerce Industry in India Volume Share (%), by Business models 2024 & 2032
- Figure 79: Asia Pacific E Commerce Industry in India Revenue (Million), by Geography 2024 & 2032
- Figure 80: Asia Pacific E Commerce Industry in India Volume (K Unit), by Geography 2024 & 2032
- Figure 81: Asia Pacific E Commerce Industry in India Revenue Share (%), by Geography 2024 & 2032
- Figure 82: Asia Pacific E Commerce Industry in India Volume Share (%), by Geography 2024 & 2032
- Figure 83: Asia Pacific E Commerce Industry in India Revenue (Million), by Country 2024 & 2032
- Figure 84: Asia Pacific E Commerce Industry in India Volume (K Unit), by Country 2024 & 2032
- Figure 85: Asia Pacific E Commerce Industry in India Revenue Share (%), by Country 2024 & 2032
- Figure 86: Asia Pacific E Commerce Industry in India Volume Share (%), by Country 2024 & 2032
List of Tables
- Table 1: Global E Commerce Industry in India Revenue Million Forecast, by Region 2019 & 2032
- Table 2: Global E Commerce Industry in India Volume K Unit Forecast, by Region 2019 & 2032
- Table 3: Global E Commerce Industry in India Revenue Million Forecast, by B2C E-commerce 2019 & 2032
- Table 4: Global E Commerce Industry in India Volume K Unit Forecast, by B2C E-commerce 2019 & 2032
- Table 5: Global E Commerce Industry in India Revenue Million Forecast, by Business models 2019 & 2032
- Table 6: Global E Commerce Industry in India Volume K Unit Forecast, by Business models 2019 & 2032
- Table 7: Global E Commerce Industry in India Revenue Million Forecast, by Geography 2019 & 2032
- Table 8: Global E Commerce Industry in India Volume K Unit Forecast, by Geography 2019 & 2032
- Table 9: Global E Commerce Industry in India Revenue Million Forecast, by Region 2019 & 2032
- Table 10: Global E Commerce Industry in India Volume K Unit Forecast, by Region 2019 & 2032
- Table 11: Global E Commerce Industry in India Revenue Million Forecast, by Country 2019 & 2032
- Table 12: Global E Commerce Industry in India Volume K Unit Forecast, by Country 2019 & 2032
- Table 13: North India E Commerce Industry in India Revenue (Million) Forecast, by Application 2019 & 2032
- Table 14: North India E Commerce Industry in India Volume (K Unit) Forecast, by Application 2019 & 2032
- Table 15: South India E Commerce Industry in India Revenue (Million) Forecast, by Application 2019 & 2032
- Table 16: South India E Commerce Industry in India Volume (K Unit) Forecast, by Application 2019 & 2032
- Table 17: East India E Commerce Industry in India Revenue (Million) Forecast, by Application 2019 & 2032
- Table 18: East India E Commerce Industry in India Volume (K Unit) Forecast, by Application 2019 & 2032
- Table 19: West India E Commerce Industry in India Revenue (Million) Forecast, by Application 2019 & 2032
- Table 20: West India E Commerce Industry in India Volume (K Unit) Forecast, by Application 2019 & 2032
- Table 21: Global E Commerce Industry in India Revenue Million Forecast, by B2C E-commerce 2019 & 2032
- Table 22: Global E Commerce Industry in India Volume K Unit Forecast, by B2C E-commerce 2019 & 2032
- Table 23: Global E Commerce Industry in India Revenue Million Forecast, by Business models 2019 & 2032
- Table 24: Global E Commerce Industry in India Volume K Unit Forecast, by Business models 2019 & 2032
- Table 25: Global E Commerce Industry in India Revenue Million Forecast, by Geography 2019 & 2032
- Table 26: Global E Commerce Industry in India Volume K Unit Forecast, by Geography 2019 & 2032
- Table 27: Global E Commerce Industry in India Revenue Million Forecast, by Country 2019 & 2032
- Table 28: Global E Commerce Industry in India Volume K Unit Forecast, by Country 2019 & 2032
- Table 29: United States E Commerce Industry in India Revenue (Million) Forecast, by Application 2019 & 2032
- Table 30: United States E Commerce Industry in India Volume (K Unit) Forecast, by Application 2019 & 2032
- Table 31: Canada E Commerce Industry in India Revenue (Million) Forecast, by Application 2019 & 2032
- Table 32: Canada E Commerce Industry in India Volume (K Unit) Forecast, by Application 2019 & 2032
- Table 33: Mexico E Commerce Industry in India Revenue (Million) Forecast, by Application 2019 & 2032
- Table 34: Mexico E Commerce Industry in India Volume (K Unit) Forecast, by Application 2019 & 2032
- Table 35: Global E Commerce Industry in India Revenue Million Forecast, by B2C E-commerce 2019 & 2032
- Table 36: Global E Commerce Industry in India Volume K Unit Forecast, by B2C E-commerce 2019 & 2032
- Table 37: Global E Commerce Industry in India Revenue Million Forecast, by Business models 2019 & 2032
- Table 38: Global E Commerce Industry in India Volume K Unit Forecast, by Business models 2019 & 2032
- Table 39: Global E Commerce Industry in India Revenue Million Forecast, by Geography 2019 & 2032
- Table 40: Global E Commerce Industry in India Volume K Unit Forecast, by Geography 2019 & 2032
- Table 41: Global E Commerce Industry in India Revenue Million Forecast, by Country 2019 & 2032
- Table 42: Global E Commerce Industry in India Volume K Unit Forecast, by Country 2019 & 2032
- Table 43: Brazil E Commerce Industry in India Revenue (Million) Forecast, by Application 2019 & 2032
- Table 44: Brazil E Commerce Industry in India Volume (K Unit) Forecast, by Application 2019 & 2032
- Table 45: Argentina E Commerce Industry in India Revenue (Million) Forecast, by Application 2019 & 2032
- Table 46: Argentina E Commerce Industry in India Volume (K Unit) Forecast, by Application 2019 & 2032
- Table 47: Rest of South America E Commerce Industry in India Revenue (Million) Forecast, by Application 2019 & 2032
- Table 48: Rest of South America E Commerce Industry in India Volume (K Unit) Forecast, by Application 2019 & 2032
- Table 49: Global E Commerce Industry in India Revenue Million Forecast, by B2C E-commerce 2019 & 2032
- Table 50: Global E Commerce Industry in India Volume K Unit Forecast, by B2C E-commerce 2019 & 2032
- Table 51: Global E Commerce Industry in India Revenue Million Forecast, by Business models 2019 & 2032
- Table 52: Global E Commerce Industry in India Volume K Unit Forecast, by Business models 2019 & 2032
- Table 53: Global E Commerce Industry in India Revenue Million Forecast, by Geography 2019 & 2032
- Table 54: Global E Commerce Industry in India Volume K Unit Forecast, by Geography 2019 & 2032
- Table 55: Global E Commerce Industry in India Revenue Million Forecast, by Country 2019 & 2032
- Table 56: Global E Commerce Industry in India Volume K Unit Forecast, by Country 2019 & 2032
- Table 57: United Kingdom E Commerce Industry in India Revenue (Million) Forecast, by Application 2019 & 2032
- Table 58: United Kingdom E Commerce Industry in India Volume (K Unit) Forecast, by Application 2019 & 2032
- Table 59: Germany E Commerce Industry in India Revenue (Million) Forecast, by Application 2019 & 2032
- Table 60: Germany E Commerce Industry in India Volume (K Unit) Forecast, by Application 2019 & 2032
- Table 61: France E Commerce Industry in India Revenue (Million) Forecast, by Application 2019 & 2032
- Table 62: France E Commerce Industry in India Volume (K Unit) Forecast, by Application 2019 & 2032
- Table 63: Italy E Commerce Industry in India Revenue (Million) Forecast, by Application 2019 & 2032
- Table 64: Italy E Commerce Industry in India Volume (K Unit) Forecast, by Application 2019 & 2032
- Table 65: Spain E Commerce Industry in India Revenue (Million) Forecast, by Application 2019 & 2032
- Table 66: Spain E Commerce Industry in India Volume (K Unit) Forecast, by Application 2019 & 2032
- Table 67: Russia E Commerce Industry in India Revenue (Million) Forecast, by Application 2019 & 2032
- Table 68: Russia E Commerce Industry in India Volume (K Unit) Forecast, by Application 2019 & 2032
- Table 69: Benelux E Commerce Industry in India Revenue (Million) Forecast, by Application 2019 & 2032
- Table 70: Benelux E Commerce Industry in India Volume (K Unit) Forecast, by Application 2019 & 2032
- Table 71: Nordics E Commerce Industry in India Revenue (Million) Forecast, by Application 2019 & 2032
- Table 72: Nordics E Commerce Industry in India Volume (K Unit) Forecast, by Application 2019 & 2032
- Table 73: Rest of Europe E Commerce Industry in India Revenue (Million) Forecast, by Application 2019 & 2032
- Table 74: Rest of Europe E Commerce Industry in India Volume (K Unit) Forecast, by Application 2019 & 2032
- Table 75: Global E Commerce Industry in India Revenue Million Forecast, by B2C E-commerce 2019 & 2032
- Table 76: Global E Commerce Industry in India Volume K Unit Forecast, by B2C E-commerce 2019 & 2032
- Table 77: Global E Commerce Industry in India Revenue Million Forecast, by Business models 2019 & 2032
- Table 78: Global E Commerce Industry in India Volume K Unit Forecast, by Business models 2019 & 2032
- Table 79: Global E Commerce Industry in India Revenue Million Forecast, by Geography 2019 & 2032
- Table 80: Global E Commerce Industry in India Volume K Unit Forecast, by Geography 2019 & 2032
- Table 81: Global E Commerce Industry in India Revenue Million Forecast, by Country 2019 & 2032
- Table 82: Global E Commerce Industry in India Volume K Unit Forecast, by Country 2019 & 2032
- Table 83: Turkey E Commerce Industry in India Revenue (Million) Forecast, by Application 2019 & 2032
- Table 84: Turkey E Commerce Industry in India Volume (K Unit) Forecast, by Application 2019 & 2032
- Table 85: Israel E Commerce Industry in India Revenue (Million) Forecast, by Application 2019 & 2032
- Table 86: Israel E Commerce Industry in India Volume (K Unit) Forecast, by Application 2019 & 2032
- Table 87: GCC E Commerce Industry in India Revenue (Million) Forecast, by Application 2019 & 2032
- Table 88: GCC E Commerce Industry in India Volume (K Unit) Forecast, by Application 2019 & 2032
- Table 89: North Africa E Commerce Industry in India Revenue (Million) Forecast, by Application 2019 & 2032
- Table 90: North Africa E Commerce Industry in India Volume (K Unit) Forecast, by Application 2019 & 2032
- Table 91: South Africa E Commerce Industry in India Revenue (Million) Forecast, by Application 2019 & 2032
- Table 92: South Africa E Commerce Industry in India Volume (K Unit) Forecast, by Application 2019 & 2032
- Table 93: Rest of Middle East & Africa E Commerce Industry in India Revenue (Million) Forecast, by Application 2019 & 2032
- Table 94: Rest of Middle East & Africa E Commerce Industry in India Volume (K Unit) Forecast, by Application 2019 & 2032
- Table 95: Global E Commerce Industry in India Revenue Million Forecast, by B2C E-commerce 2019 & 2032
- Table 96: Global E Commerce Industry in India Volume K Unit Forecast, by B2C E-commerce 2019 & 2032
- Table 97: Global E Commerce Industry in India Revenue Million Forecast, by Business models 2019 & 2032
- Table 98: Global E Commerce Industry in India Volume K Unit Forecast, by Business models 2019 & 2032
- Table 99: Global E Commerce Industry in India Revenue Million Forecast, by Geography 2019 & 2032
- Table 100: Global E Commerce Industry in India Volume K Unit Forecast, by Geography 2019 & 2032
- Table 101: Global E Commerce Industry in India Revenue Million Forecast, by Country 2019 & 2032
- Table 102: Global E Commerce Industry in India Volume K Unit Forecast, by Country 2019 & 2032
- Table 103: China E Commerce Industry in India Revenue (Million) Forecast, by Application 2019 & 2032
- Table 104: China E Commerce Industry in India Volume (K Unit) Forecast, by Application 2019 & 2032
- Table 105: India E Commerce Industry in India Revenue (Million) Forecast, by Application 2019 & 2032
- Table 106: India E Commerce Industry in India Volume (K Unit) Forecast, by Application 2019 & 2032
- Table 107: Japan E Commerce Industry in India Revenue (Million) Forecast, by Application 2019 & 2032
- Table 108: Japan E Commerce Industry in India Volume (K Unit) Forecast, by Application 2019 & 2032
- Table 109: South Korea E Commerce Industry in India Revenue (Million) Forecast, by Application 2019 & 2032
- Table 110: South Korea E Commerce Industry in India Volume (K Unit) Forecast, by Application 2019 & 2032
- Table 111: ASEAN E Commerce Industry in India Revenue (Million) Forecast, by Application 2019 & 2032
- Table 112: ASEAN E Commerce Industry in India Volume (K Unit) Forecast, by Application 2019 & 2032
- Table 113: Oceania E Commerce Industry in India Revenue (Million) Forecast, by Application 2019 & 2032
- Table 114: Oceania E Commerce Industry in India Volume (K Unit) Forecast, by Application 2019 & 2032
- Table 115: Rest of Asia Pacific E Commerce Industry in India Revenue (Million) Forecast, by Application 2019 & 2032
- Table 116: Rest of Asia Pacific E Commerce Industry in India Volume (K Unit) Forecast, by Application 2019 & 2032
Frequently Asked Questions
1. What is the projected Compound Annual Growth Rate (CAGR) of the E Commerce Industry in India?
The projected CAGR is approximately 21.50%.
2. Which companies are prominent players in the E Commerce Industry in India?
Key companies in the market include Ajio, Nykaa, Alibaba Group Holding Limited, Grofers, Amazon com Inc, Flipkart Private Limited, Purplle, eBay Inc, Snapdeal, Apple Inc.
3. What are the main segments of the E Commerce Industry in India?
The market segments include B2C E-commerce, Business models , Geography.
4. Can you provide details about the market size?
The market size is estimated to be USD 112.93 Million as of 2022.
5. What are some drivers contributing to market growth?
Increased Internet Penetration Across the Country; Supportive Government Policies and Regulatory Framework.
6. What are the notable trends driving market growth?
Internet Plays a Significant Role in Market Growth.
7. Are there any restraints impacting market growth?
Privacy and security concerns.
8. Can you provide examples of recent developments in the market?
June 2023 - American tech giant Amazon has committed to investing an additional USD 15 billion in India over the next seven years. This will take the company’s total India investment across all businesses to USD 26 billion. Amazon has already invested USD 11 billion in India. The company has pledged to digitize 10 million small businesses, enable USD 20 billion in exports, and create two million jobs in India by 2025.
9. What pricing options are available for accessing the report?
Pricing options include single-user, multi-user, and enterprise licenses priced at USD 3800, USD 4500, and USD 5800 respectively.
10. Is the market size provided in terms of value or volume?
The market size is provided in terms of value, measured in Million and volume, measured in K Unit.
11. Are there any specific market keywords associated with the report?
Yes, the market keyword associated with the report is "E Commerce Industry in India," which aids in identifying and referencing the specific market segment covered.
12. How do I determine which pricing option suits my needs best?
The pricing options vary based on user requirements and access needs. Individual users may opt for single-user licenses, while businesses requiring broader access may choose multi-user or enterprise licenses for cost-effective access to the report.
13. Are there any additional resources or data provided in the E Commerce Industry in India report?
While the report offers comprehensive insights, it's advisable to review the specific contents or supplementary materials provided to ascertain if additional resources or data are available.
14. How can I stay updated on further developments or reports in the E Commerce Industry in India?
To stay informed about further developments, trends, and reports in the E Commerce Industry in India, consider subscribing to industry newsletters, following relevant companies and organizations, or regularly checking reputable industry news sources and publications.
Methodology
Step 1 - Identification of Relevant Samples Size from Population Database


Step 2 - Approaches for Defining Global Market Size (Value, Volume* & Price*)

Note*: In applicable scenarios
Step 3 - Data Sources
Primary Research
- Web Analytics
- Survey Reports
- Research Institute
- Latest Research Reports
- Opinion Leaders
Secondary Research
- Annual Reports
- White Paper
- Latest Press Release
- Industry Association
- Paid Database
- Investor Presentations

Step 4 - Data Triangulation
Involves using different sources of information in order to increase the validity of a study
These sources are likely to be stakeholders in a program - participants, other researchers, program staff, other community members, and so on.
Then we put all data in single framework & apply various statistical tools to find out the dynamic on the market.
During the analysis stage, feedback from the stakeholder groups would be compared to determine areas of agreement as well as areas of divergence


