
Key Insights
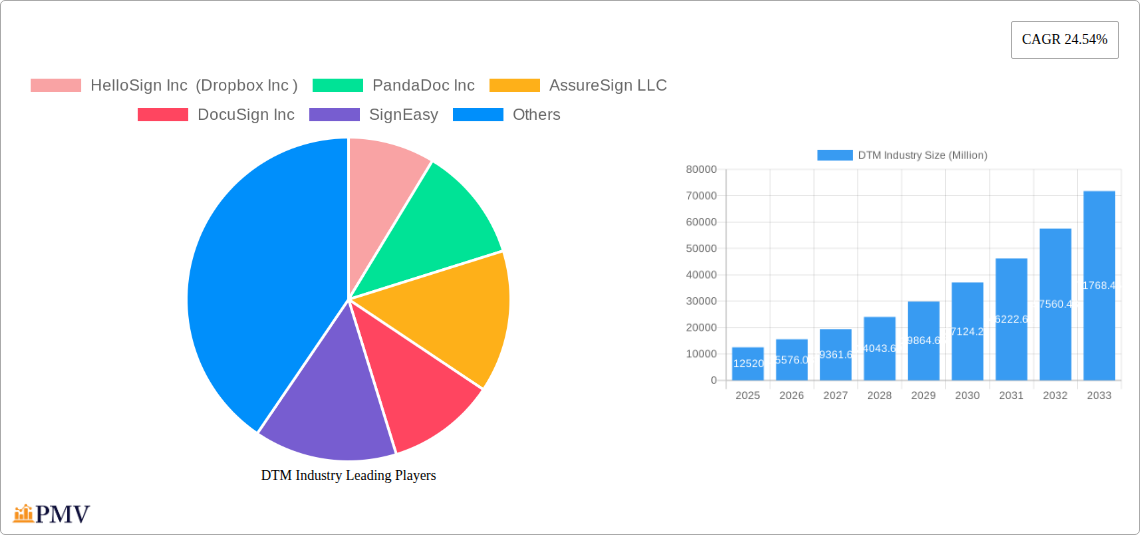
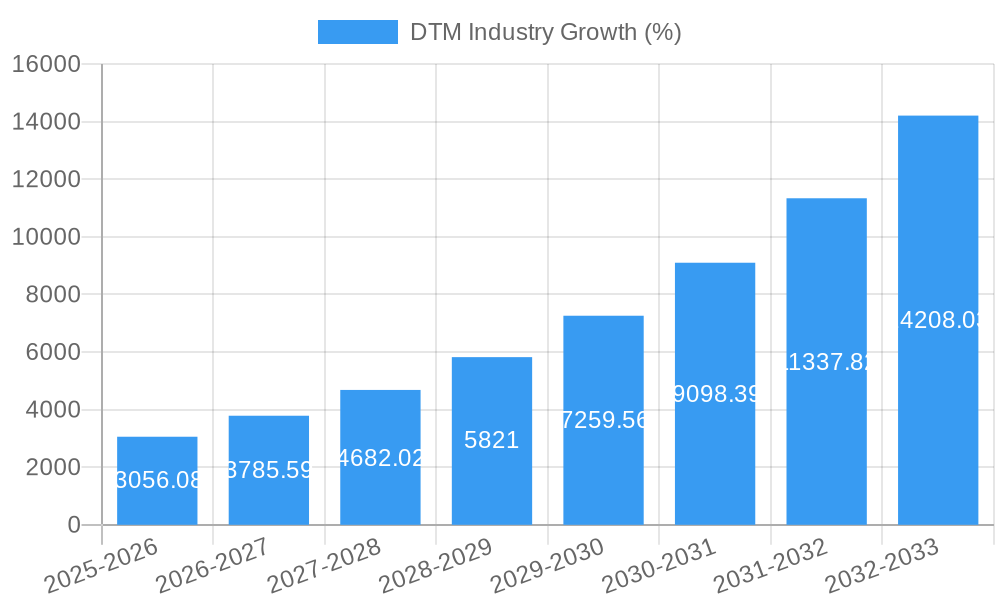
The Digital Transaction Management (DTM) market is experiencing robust growth, projected to reach $12.52 billion in 2025 and maintain a Compound Annual Growth Rate (CAGR) of 24.54% from 2025 to 2033. This expansion is fueled by several key drivers. The increasing adoption of cloud-based solutions and the growing need for secure and efficient document workflows across various industries are primary factors. Businesses, particularly in BFSI (Banking, Financial Services, and Insurance), healthcare, and retail, are increasingly seeking DTM solutions to streamline operations, reduce costs associated with paper-based processes, and enhance compliance with regulatory standards. Furthermore, the rising demand for e-signatures and the global shift towards digitalization are accelerating market growth. The market segmentation reveals a strong presence of both large enterprises and SMEs, with solutions and services comprising the major components. Geographic analysis indicates significant market potential across North America, Europe, and the Asia-Pacific region, reflecting the global nature of digital transformation initiatives. While competitive pressures exist among established players like DocuSign and Adobe, alongside emerging niche providers, the overall market landscape remains highly favorable for continued expansion due to the inherent advantages of DTM in improving operational efficiency and security.
The sustained growth of the DTM market is anticipated to be driven by continuous technological advancements, including improved AI-powered functionalities such as automated document routing and advanced analytics. Expansion into new verticals and geographic regions will also contribute significantly. However, challenges such as data security concerns, integration complexities with existing systems, and the need for user training and adoption could potentially restrain market growth to some extent. Nevertheless, the long-term outlook remains positive, driven by the increasing reliance on digital technologies for business processes and the inherent advantages of DTM in enhancing efficiency, compliance, and security. The market is likely to witness further consolidation through mergers and acquisitions, as companies strive to expand their market share and offer comprehensive DTM solutions.
This comprehensive report provides a detailed analysis of the Digital Transaction Management (DTM) industry, offering invaluable insights for businesses, investors, and stakeholders. The report covers the period from 2019 to 2033, with a focus on the forecast period from 2025 to 2033. The base year for this analysis is 2025. The global DTM market is projected to reach xx Million by 2033, exhibiting a Compound Annual Growth Rate (CAGR) of xx% during the forecast period.
DTM Industry Market Structure & Competitive Dynamics
The DTM industry is characterized by a dynamic competitive landscape with a mix of established players and emerging startups. Market concentration is moderate, with a few dominant players holding significant market share, while numerous smaller companies compete in niche segments. DocuSign Inc holds a leading position, followed by Adobe Inc and others. The market share for these players is estimated at xx Million, xx Million, and xx Million respectively in 2025. Innovation ecosystems are thriving, driven by advancements in cloud computing, artificial intelligence (AI), and blockchain technology. Regulatory frameworks, particularly concerning data privacy and security, significantly influence market operations. Product substitutes, such as traditional paper-based processes, are gradually being replaced due to increasing efficiency and cost-effectiveness of DTM solutions. End-user trends show a growing preference for digital solutions that streamline workflows and enhance security. Mergers and acquisitions (M&A) activity has been significant, with deal values exceeding xx Million in the past five years. Examples include the acquisition of HelloSign by Dropbox Inc, reflecting industry consolidation trends.
- Market Concentration: Moderately concentrated, with a few dominant players.
- Innovation Ecosystems: Strong, fueled by advancements in cloud, AI, and blockchain.
- Regulatory Frameworks: Significant impact, focusing on data privacy and security.
- M&A Activity: High, with deals exceeding xx Million in recent years.
- Key Players' Market Share (2025): DocuSign Inc (xx Million), Adobe Inc (xx Million), others (xx Million).
DTM Industry Industry Trends & Insights
The DTM market is experiencing robust growth, driven by several key factors. The increasing adoption of digital technologies across various industries is a major catalyst, boosting demand for efficient and secure transaction management solutions. Technological disruptions, particularly the rise of cloud-based DTM platforms and the integration of AI for enhanced automation, are reshaping the industry landscape. Consumer preferences are shifting towards user-friendly interfaces and seamless integration with existing workflows. Intense competitive dynamics, with companies constantly innovating to gain market share, further contribute to the market's expansion. The global DTM market is projected to reach xx Million by 2033, driven by a CAGR of xx%. Market penetration is expected to increase from xx% in 2025 to xx% in 2033. The increasing adoption of digital signature solutions, particularly within the BFSI sector, is also a key driver. The shift towards remote work and digital transformation initiatives is expected to fuel further growth in the coming years.
Dominant Markets & Segments in DTM Industry
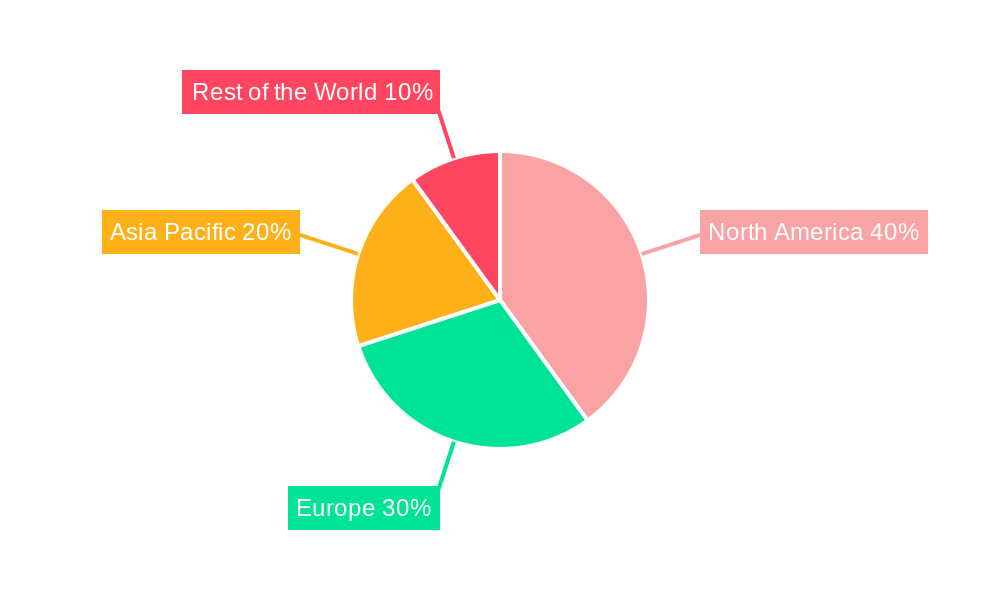
The North American region currently dominates the DTM market, followed by Europe. Within North America, the United States holds the largest market share due to high technological adoption and the presence of major DTM solution providers.
By Organization Size:
- Large Enterprises: This segment holds the largest market share due to high spending capacity and a greater need for sophisticated DTM solutions. Key drivers include increased automation needs and stringent compliance regulations.
- Small and Medium Enterprises (SMEs): This segment is experiencing rapid growth due to rising awareness of DTM benefits and the availability of affordable solutions. Key drivers include increased efficiency and reduced operational costs.
By End-user Industry:
- BFSI (Banking, Financial Services, and Insurance): This is the dominant end-user industry, driven by stringent regulatory compliance needs and the high volume of digital transactions.
- Healthcare: This segment is growing rapidly due to increasing demand for secure and efficient electronic health record management.
- Retail: This segment is witnessing steady growth as retailers adopt DTM solutions to improve customer experience and streamline operations.
- IT and Telecommunication: This segment is a key adopter of DTM solutions for contract management and other business processes.
- Other End-user Industries: This segment includes various sectors, each with its own specific DTM requirements.
By Component:
- Solution: This segment accounts for the largest market share, driven by the demand for comprehensive DTM platforms.
- Service: This segment is growing rapidly as businesses increasingly outsource DTM functions to specialized service providers.
DTM Industry Product Innovations
Recent innovations in the DTM space focus on enhancing security, improving user experience, and integrating with other business applications. This includes advanced features like AI-powered document automation, biometric authentication, and blockchain-based tamper-proof records. These innovations align with market trends toward greater efficiency, enhanced security, and seamless integration.
Report Segmentation & Scope
This report segments the DTM market by organization size (Small and Medium Enterprises, Large Enterprises), end-user industry (BFSI, Healthcare, Retail, IT and Telecommunication, Other End-user Industries), and component (Solution, Service). Each segment's growth projections, market size, and competitive dynamics are analyzed in detail. The forecast period is 2025-2033, projecting significant growth across all segments, with the BFSI and Large Enterprise segments leading the way.
Key Drivers of DTM Industry Growth
Several factors fuel DTM industry growth, including increased digitization across industries, rising demand for secure and efficient transaction management, and advancements in cloud computing and AI. Government initiatives promoting digital transformation and stricter regulatory compliance requirements further accelerate market expansion. The increasing adoption of digital signatures and e-signatures is also a major driver.
Challenges in the DTM Industry Sector
The DTM industry faces challenges including ensuring data security and privacy, complying with evolving regulatory frameworks, and managing the complexities of integrating different systems. Competition from both established players and new entrants adds to the pressure. The cost of implementing and maintaining DTM systems can also be a barrier to entry for some businesses.
Leading Players in the DTM Industry Market
- HelloSign Inc (Dropbox Inc)
- PandaDoc Inc
- AssureSign LLC
- DocuSign Inc
- SignEasy
- ZorroSign Inc
- Adobe Inc
- Nintex Group Pty Ltd
- InfoCert
- Mitratech Holdings Inc
- OneSpan Inc
- PactSafe Inc
- Topaz Systems Inc
- Namirial SpA
- eOriginal Inc
Key Developments in DTM Industry Sector
- December 2022: Skyslope partners with Weichert, Realtors, expanding its reach to thousands of agents in the USA and Canada. This strengthens Skyslope's market position and highlights the increasing demand for integrated digital signature solutions in the real estate sector.
- September 2022: DocuSign integrates with Zavvie's MoxiEngage CRM, enhancing its digital transaction management program with seamless workflow management capabilities. This strengthens DocuSign's position in the market by offering a more integrated solution for real estate professionals.
Strategic DTM Industry Market Outlook
The future of the DTM industry is bright, driven by continued technological advancements, increasing demand for digital solutions, and expanding regulatory support for e-signatures. Strategic opportunities exist in developing innovative solutions that address specific industry needs, leveraging AI and blockchain for enhanced security and automation. Companies focusing on seamless integration with existing business systems and user-friendly interfaces are expected to gain a significant competitive edge. The market is poised for substantial growth, presenting lucrative opportunities for both established players and emerging companies.
DTM Industry Segmentation
-
1. Component
- 1.1. Solution
- 1.2. Service
-
2. Organization Size
- 2.1. Small and Medium Enterprise
- 2.2. Large Enterprise
-
3. End-user Industry
- 3.1. BFSI
- 3.2. Healthcare
- 3.3. Retail
- 3.4. IT and Telecommunication
- 3.5. Other End-user Industries
DTM Industry Segmentation By Geography
- 1. North America
- 2. Europe
- 3. Asia Pacific
- 4. Rest of the World
DTM Industry REPORT HIGHLIGHTS
| Aspects | Details |
|---|---|
| Study Period | 2019-2033 |
| Base Year | 2024 |
| Estimated Year | 2025 |
| Forecast Period | 2025-2033 |
| Historical Period | 2019-2024 |
| Growth Rate | CAGR of 24.54% from 2019-2033 |
| Segmentation |
|
Table of Contents
- 1. Introduction
- 1.1. Research Scope
- 1.2. Market Segmentation
- 1.3. Research Methodology
- 1.4. Definitions and Assumptions
- 2. Executive Summary
- 2.1. Introduction
- 3. Market Dynamics
- 3.1. Introduction
- 3.2. Market Drivers
- 3.2.1. Rise in E-signatures and Adoption of Cloud Services; Focus on Business Automation; BFSI Industry is Expected to Hold a Significant Market Share
- 3.3. Market Restrains
- 3.3.1. Geopolitical Situation and Ongoing Changes in Macro-environment
- 3.4. Market Trends
- 3.4.1. BFSI Industry is Expected to Hold a Significant Market Share
- 4. Market Factor Analysis
- 4.1. Porters Five Forces
- 4.2. Supply/Value Chain
- 4.3. PESTEL analysis
- 4.4. Market Entropy
- 4.5. Patent/Trademark Analysis
- 5. Global DTM Industry Analysis, Insights and Forecast, 2019-2031
- 5.1. Market Analysis, Insights and Forecast - by Component
- 5.1.1. Solution
- 5.1.2. Service
- 5.2. Market Analysis, Insights and Forecast - by Organization Size
- 5.2.1. Small and Medium Enterprise
- 5.2.2. Large Enterprise
- 5.3. Market Analysis, Insights and Forecast - by End-user Industry
- 5.3.1. BFSI
- 5.3.2. Healthcare
- 5.3.3. Retail
- 5.3.4. IT and Telecommunication
- 5.3.5. Other End-user Industries
- 5.4. Market Analysis, Insights and Forecast - by Region
- 5.4.1. North America
- 5.4.2. Europe
- 5.4.3. Asia Pacific
- 5.4.4. Rest of the World
- 5.1. Market Analysis, Insights and Forecast - by Component
- 6. North America DTM Industry Analysis, Insights and Forecast, 2019-2031
- 6.1. Market Analysis, Insights and Forecast - by Component
- 6.1.1. Solution
- 6.1.2. Service
- 6.2. Market Analysis, Insights and Forecast - by Organization Size
- 6.2.1. Small and Medium Enterprise
- 6.2.2. Large Enterprise
- 6.3. Market Analysis, Insights and Forecast - by End-user Industry
- 6.3.1. BFSI
- 6.3.2. Healthcare
- 6.3.3. Retail
- 6.3.4. IT and Telecommunication
- 6.3.5. Other End-user Industries
- 6.1. Market Analysis, Insights and Forecast - by Component
- 7. Europe DTM Industry Analysis, Insights and Forecast, 2019-2031
- 7.1. Market Analysis, Insights and Forecast - by Component
- 7.1.1. Solution
- 7.1.2. Service
- 7.2. Market Analysis, Insights and Forecast - by Organization Size
- 7.2.1. Small and Medium Enterprise
- 7.2.2. Large Enterprise
- 7.3. Market Analysis, Insights and Forecast - by End-user Industry
- 7.3.1. BFSI
- 7.3.2. Healthcare
- 7.3.3. Retail
- 7.3.4. IT and Telecommunication
- 7.3.5. Other End-user Industries
- 7.1. Market Analysis, Insights and Forecast - by Component
- 8. Asia Pacific DTM Industry Analysis, Insights and Forecast, 2019-2031
- 8.1. Market Analysis, Insights and Forecast - by Component
- 8.1.1. Solution
- 8.1.2. Service
- 8.2. Market Analysis, Insights and Forecast - by Organization Size
- 8.2.1. Small and Medium Enterprise
- 8.2.2. Large Enterprise
- 8.3. Market Analysis, Insights and Forecast - by End-user Industry
- 8.3.1. BFSI
- 8.3.2. Healthcare
- 8.3.3. Retail
- 8.3.4. IT and Telecommunication
- 8.3.5. Other End-user Industries
- 8.1. Market Analysis, Insights and Forecast - by Component
- 9. Rest of the World DTM Industry Analysis, Insights and Forecast, 2019-2031
- 9.1. Market Analysis, Insights and Forecast - by Component
- 9.1.1. Solution
- 9.1.2. Service
- 9.2. Market Analysis, Insights and Forecast - by Organization Size
- 9.2.1. Small and Medium Enterprise
- 9.2.2. Large Enterprise
- 9.3. Market Analysis, Insights and Forecast - by End-user Industry
- 9.3.1. BFSI
- 9.3.2. Healthcare
- 9.3.3. Retail
- 9.3.4. IT and Telecommunication
- 9.3.5. Other End-user Industries
- 9.1. Market Analysis, Insights and Forecast - by Component
- 10. North America DTM Industry Analysis, Insights and Forecast, 2019-2031
- 10.1. Market Analysis, Insights and Forecast - By Country/Sub-region
- 10.1.1.
- 11. Europe DTM Industry Analysis, Insights and Forecast, 2019-2031
- 11.1. Market Analysis, Insights and Forecast - By Country/Sub-region
- 11.1.1.
- 12. Asia Pacific DTM Industry Analysis, Insights and Forecast, 2019-2031
- 12.1. Market Analysis, Insights and Forecast - By Country/Sub-region
- 12.1.1.
- 13. Rest of the World DTM Industry Analysis, Insights and Forecast, 2019-2031
- 13.1. Market Analysis, Insights and Forecast - By Country/Sub-region
- 13.1.1.
- 14. Competitive Analysis
- 14.1. Global Market Share Analysis 2024
- 14.2. Company Profiles
- 14.2.1 HelloSign Inc (Dropbox Inc )
- 14.2.1.1. Overview
- 14.2.1.2. Products
- 14.2.1.3. SWOT Analysis
- 14.2.1.4. Recent Developments
- 14.2.1.5. Financials (Based on Availability)
- 14.2.2 PandaDoc Inc
- 14.2.2.1. Overview
- 14.2.2.2. Products
- 14.2.2.3. SWOT Analysis
- 14.2.2.4. Recent Developments
- 14.2.2.5. Financials (Based on Availability)
- 14.2.3 AssureSign LLC
- 14.2.3.1. Overview
- 14.2.3.2. Products
- 14.2.3.3. SWOT Analysis
- 14.2.3.4. Recent Developments
- 14.2.3.5. Financials (Based on Availability)
- 14.2.4 DocuSign Inc
- 14.2.4.1. Overview
- 14.2.4.2. Products
- 14.2.4.3. SWOT Analysis
- 14.2.4.4. Recent Developments
- 14.2.4.5. Financials (Based on Availability)
- 14.2.5 SignEasy
- 14.2.5.1. Overview
- 14.2.5.2. Products
- 14.2.5.3. SWOT Analysis
- 14.2.5.4. Recent Developments
- 14.2.5.5. Financials (Based on Availability)
- 14.2.6 ZorroSign Inc
- 14.2.6.1. Overview
- 14.2.6.2. Products
- 14.2.6.3. SWOT Analysis
- 14.2.6.4. Recent Developments
- 14.2.6.5. Financials (Based on Availability)
- 14.2.7 Adobe Inc
- 14.2.7.1. Overview
- 14.2.7.2. Products
- 14.2.7.3. SWOT Analysis
- 14.2.7.4. Recent Developments
- 14.2.7.5. Financials (Based on Availability)
- 14.2.8 Nintex Group Pty Ltd
- 14.2.8.1. Overview
- 14.2.8.2. Products
- 14.2.8.3. SWOT Analysis
- 14.2.8.4. Recent Developments
- 14.2.8.5. Financials (Based on Availability)
- 14.2.9 InfoCert
- 14.2.9.1. Overview
- 14.2.9.2. Products
- 14.2.9.3. SWOT Analysis
- 14.2.9.4. Recent Developments
- 14.2.9.5. Financials (Based on Availability)
- 14.2.10 Mitratech Holdings Inc
- 14.2.10.1. Overview
- 14.2.10.2. Products
- 14.2.10.3. SWOT Analysis
- 14.2.10.4. Recent Developments
- 14.2.10.5. Financials (Based on Availability)
- 14.2.11 OneSpan Inc
- 14.2.11.1. Overview
- 14.2.11.2. Products
- 14.2.11.3. SWOT Analysis
- 14.2.11.4. Recent Developments
- 14.2.11.5. Financials (Based on Availability)
- 14.2.12 PactSafe Inc
- 14.2.12.1. Overview
- 14.2.12.2. Products
- 14.2.12.3. SWOT Analysis
- 14.2.12.4. Recent Developments
- 14.2.12.5. Financials (Based on Availability)
- 14.2.13 Topaz Systems Inc
- 14.2.13.1. Overview
- 14.2.13.2. Products
- 14.2.13.3. SWOT Analysis
- 14.2.13.4. Recent Developments
- 14.2.13.5. Financials (Based on Availability)
- 14.2.14 Namirial SpA
- 14.2.14.1. Overview
- 14.2.14.2. Products
- 14.2.14.3. SWOT Analysis
- 14.2.14.4. Recent Developments
- 14.2.14.5. Financials (Based on Availability)
- 14.2.15 eOriginal Inc
- 14.2.15.1. Overview
- 14.2.15.2. Products
- 14.2.15.3. SWOT Analysis
- 14.2.15.4. Recent Developments
- 14.2.15.5. Financials (Based on Availability)
- 14.2.1 HelloSign Inc (Dropbox Inc )
List of Figures
- Figure 1: Global DTM Industry Revenue Breakdown (Million, %) by Region 2024 & 2032
- Figure 2: North America DTM Industry Revenue (Million), by Country 2024 & 2032
- Figure 3: North America DTM Industry Revenue Share (%), by Country 2024 & 2032
- Figure 4: Europe DTM Industry Revenue (Million), by Country 2024 & 2032
- Figure 5: Europe DTM Industry Revenue Share (%), by Country 2024 & 2032
- Figure 6: Asia Pacific DTM Industry Revenue (Million), by Country 2024 & 2032
- Figure 7: Asia Pacific DTM Industry Revenue Share (%), by Country 2024 & 2032
- Figure 8: Rest of the World DTM Industry Revenue (Million), by Country 2024 & 2032
- Figure 9: Rest of the World DTM Industry Revenue Share (%), by Country 2024 & 2032
- Figure 10: North America DTM Industry Revenue (Million), by Component 2024 & 2032
- Figure 11: North America DTM Industry Revenue Share (%), by Component 2024 & 2032
- Figure 12: North America DTM Industry Revenue (Million), by Organization Size 2024 & 2032
- Figure 13: North America DTM Industry Revenue Share (%), by Organization Size 2024 & 2032
- Figure 14: North America DTM Industry Revenue (Million), by End-user Industry 2024 & 2032
- Figure 15: North America DTM Industry Revenue Share (%), by End-user Industry 2024 & 2032
- Figure 16: North America DTM Industry Revenue (Million), by Country 2024 & 2032
- Figure 17: North America DTM Industry Revenue Share (%), by Country 2024 & 2032
- Figure 18: Europe DTM Industry Revenue (Million), by Component 2024 & 2032
- Figure 19: Europe DTM Industry Revenue Share (%), by Component 2024 & 2032
- Figure 20: Europe DTM Industry Revenue (Million), by Organization Size 2024 & 2032
- Figure 21: Europe DTM Industry Revenue Share (%), by Organization Size 2024 & 2032
- Figure 22: Europe DTM Industry Revenue (Million), by End-user Industry 2024 & 2032
- Figure 23: Europe DTM Industry Revenue Share (%), by End-user Industry 2024 & 2032
- Figure 24: Europe DTM Industry Revenue (Million), by Country 2024 & 2032
- Figure 25: Europe DTM Industry Revenue Share (%), by Country 2024 & 2032
- Figure 26: Asia Pacific DTM Industry Revenue (Million), by Component 2024 & 2032
- Figure 27: Asia Pacific DTM Industry Revenue Share (%), by Component 2024 & 2032
- Figure 28: Asia Pacific DTM Industry Revenue (Million), by Organization Size 2024 & 2032
- Figure 29: Asia Pacific DTM Industry Revenue Share (%), by Organization Size 2024 & 2032
- Figure 30: Asia Pacific DTM Industry Revenue (Million), by End-user Industry 2024 & 2032
- Figure 31: Asia Pacific DTM Industry Revenue Share (%), by End-user Industry 2024 & 2032
- Figure 32: Asia Pacific DTM Industry Revenue (Million), by Country 2024 & 2032
- Figure 33: Asia Pacific DTM Industry Revenue Share (%), by Country 2024 & 2032
- Figure 34: Rest of the World DTM Industry Revenue (Million), by Component 2024 & 2032
- Figure 35: Rest of the World DTM Industry Revenue Share (%), by Component 2024 & 2032
- Figure 36: Rest of the World DTM Industry Revenue (Million), by Organization Size 2024 & 2032
- Figure 37: Rest of the World DTM Industry Revenue Share (%), by Organization Size 2024 & 2032
- Figure 38: Rest of the World DTM Industry Revenue (Million), by End-user Industry 2024 & 2032
- Figure 39: Rest of the World DTM Industry Revenue Share (%), by End-user Industry 2024 & 2032
- Figure 40: Rest of the World DTM Industry Revenue (Million), by Country 2024 & 2032
- Figure 41: Rest of the World DTM Industry Revenue Share (%), by Country 2024 & 2032
List of Tables
- Table 1: Global DTM Industry Revenue Million Forecast, by Region 2019 & 2032
- Table 2: Global DTM Industry Revenue Million Forecast, by Component 2019 & 2032
- Table 3: Global DTM Industry Revenue Million Forecast, by Organization Size 2019 & 2032
- Table 4: Global DTM Industry Revenue Million Forecast, by End-user Industry 2019 & 2032
- Table 5: Global DTM Industry Revenue Million Forecast, by Region 2019 & 2032
- Table 6: Global DTM Industry Revenue Million Forecast, by Country 2019 & 2032
- Table 7: DTM Industry Revenue (Million) Forecast, by Application 2019 & 2032
- Table 8: Global DTM Industry Revenue Million Forecast, by Country 2019 & 2032
- Table 9: DTM Industry Revenue (Million) Forecast, by Application 2019 & 2032
- Table 10: Global DTM Industry Revenue Million Forecast, by Country 2019 & 2032
- Table 11: DTM Industry Revenue (Million) Forecast, by Application 2019 & 2032
- Table 12: Global DTM Industry Revenue Million Forecast, by Country 2019 & 2032
- Table 13: DTM Industry Revenue (Million) Forecast, by Application 2019 & 2032
- Table 14: Global DTM Industry Revenue Million Forecast, by Component 2019 & 2032
- Table 15: Global DTM Industry Revenue Million Forecast, by Organization Size 2019 & 2032
- Table 16: Global DTM Industry Revenue Million Forecast, by End-user Industry 2019 & 2032
- Table 17: Global DTM Industry Revenue Million Forecast, by Country 2019 & 2032
- Table 18: Global DTM Industry Revenue Million Forecast, by Component 2019 & 2032
- Table 19: Global DTM Industry Revenue Million Forecast, by Organization Size 2019 & 2032
- Table 20: Global DTM Industry Revenue Million Forecast, by End-user Industry 2019 & 2032
- Table 21: Global DTM Industry Revenue Million Forecast, by Country 2019 & 2032
- Table 22: Global DTM Industry Revenue Million Forecast, by Component 2019 & 2032
- Table 23: Global DTM Industry Revenue Million Forecast, by Organization Size 2019 & 2032
- Table 24: Global DTM Industry Revenue Million Forecast, by End-user Industry 2019 & 2032
- Table 25: Global DTM Industry Revenue Million Forecast, by Country 2019 & 2032
- Table 26: Global DTM Industry Revenue Million Forecast, by Component 2019 & 2032
- Table 27: Global DTM Industry Revenue Million Forecast, by Organization Size 2019 & 2032
- Table 28: Global DTM Industry Revenue Million Forecast, by End-user Industry 2019 & 2032
- Table 29: Global DTM Industry Revenue Million Forecast, by Country 2019 & 2032
Frequently Asked Questions
1. What is the projected Compound Annual Growth Rate (CAGR) of the DTM Industry?
The projected CAGR is approximately 24.54%.
2. Which companies are prominent players in the DTM Industry?
Key companies in the market include HelloSign Inc (Dropbox Inc ), PandaDoc Inc, AssureSign LLC, DocuSign Inc, SignEasy, ZorroSign Inc, Adobe Inc, Nintex Group Pty Ltd, InfoCert, Mitratech Holdings Inc, OneSpan Inc, PactSafe Inc, Topaz Systems Inc, Namirial SpA, eOriginal Inc.
3. What are the main segments of the DTM Industry?
The market segments include Component, Organization Size, End-user Industry.
4. Can you provide details about the market size?
The market size is estimated to be USD 12.52 Million as of 2022.
5. What are some drivers contributing to market growth?
Rise in E-signatures and Adoption of Cloud Services; Focus on Business Automation; BFSI Industry is Expected to Hold a Significant Market Share.
6. What are the notable trends driving market growth?
BFSI Industry is Expected to Hold a Significant Market Share.
7. Are there any restraints impacting market growth?
Geopolitical Situation and Ongoing Changes in Macro-environment.
8. Can you provide examples of recent developments in the market?
December 2022 - Skyslope announced a new partnership with Weichert, Realtors for its innovative digital transaction management to Weichert's over 7,000 corporate associates. This innovative partnership expands Skyslope's capability by adding several thousands of agents to the current members in the USA and Canada. In addition to the core transaction platform, Skyslope offers a prominent digital signature solution to send real estate documents out for e-signature.
9. What pricing options are available for accessing the report?
Pricing options include single-user, multi-user, and enterprise licenses priced at USD 4750, USD 5250, and USD 8750 respectively.
10. Is the market size provided in terms of value or volume?
The market size is provided in terms of value, measured in Million.
11. Are there any specific market keywords associated with the report?
Yes, the market keyword associated with the report is "DTM Industry," which aids in identifying and referencing the specific market segment covered.
12. How do I determine which pricing option suits my needs best?
The pricing options vary based on user requirements and access needs. Individual users may opt for single-user licenses, while businesses requiring broader access may choose multi-user or enterprise licenses for cost-effective access to the report.
13. Are there any additional resources or data provided in the DTM Industry report?
While the report offers comprehensive insights, it's advisable to review the specific contents or supplementary materials provided to ascertain if additional resources or data are available.
14. How can I stay updated on further developments or reports in the DTM Industry?
To stay informed about further developments, trends, and reports in the DTM Industry, consider subscribing to industry newsletters, following relevant companies and organizations, or regularly checking reputable industry news sources and publications.
Methodology
Step 1 - Identification of Relevant Samples Size from Population Database


Step 2 - Approaches for Defining Global Market Size (Value, Volume* & Price*)

Note*: In applicable scenarios
Step 3 - Data Sources
Primary Research
- Web Analytics
- Survey Reports
- Research Institute
- Latest Research Reports
- Opinion Leaders
Secondary Research
- Annual Reports
- White Paper
- Latest Press Release
- Industry Association
- Paid Database
- Investor Presentations

Step 4 - Data Triangulation
Involves using different sources of information in order to increase the validity of a study
These sources are likely to be stakeholders in a program - participants, other researchers, program staff, other community members, and so on.
Then we put all data in single framework & apply various statistical tools to find out the dynamic on the market.
During the analysis stage, feedback from the stakeholder groups would be compared to determine areas of agreement as well as areas of divergence


