
Key Insights
The Direct Drive Wind Turbine (DDWT) market is experiencing robust growth, driven by increasing demand for renewable energy and the inherent advantages of DDWT technology. The market's Compound Annual Growth Rate (CAGR) exceeding 3.40% signifies a consistent upward trajectory, projected to continue through 2033. Key drivers include the rising global focus on reducing carbon emissions, supportive government policies and subsidies promoting wind energy adoption, and the technological advancements enhancing DDWT efficiency and reliability. The elimination of a gearbox in DDWTs results in reduced maintenance costs, increased operational life, and higher energy capture efficiency compared to geared turbines. This advantage is particularly attractive in challenging environments with extreme weather conditions. Market segmentation by capacity (less than 1 MW, 1-3 MW, and greater than 3 MW) reflects the varied applications of DDWTs across different project scales and geographical locations. While larger capacity turbines dominate in offshore wind farms, smaller capacity units are ideal for onshore installations and distributed generation projects. Leading players like ABB, Siemens Gamesa, Goldwind, and Enercon are actively shaping market dynamics through innovation and strategic partnerships, further fueling the market's expansion. Geographical distribution shows strong growth potential across North America, Europe, and Asia-Pacific, with developing economies in Asia-Pacific showcasing particularly high growth prospects due to increasing energy demands and government initiatives.
The competitive landscape is marked by established industry giants and emerging technology providers. Competition is primarily focused on technological advancements, cost optimization, and service offerings. Market restraints include high initial investment costs associated with DDWT technology, the need for specialized infrastructure for larger-capacity turbines, and potential grid integration challenges in certain regions. However, ongoing technological innovation, decreasing manufacturing costs, and improved grid infrastructure are gradually mitigating these restraints. The forecast period of 2025-2033 presents significant opportunities for growth, particularly in offshore wind projects where DDWT's advantages are most pronounced. Continuous R&D efforts focused on increasing efficiency, reducing costs, and improving reliability will be crucial in shaping the market's future trajectory, leading to further market penetration and growth.
Direct Drive Wind Turbine Market: A Comprehensive Market Report (2019-2033)
This comprehensive report provides an in-depth analysis of the Direct Drive Wind Turbine Market, offering invaluable insights for industry stakeholders, investors, and strategic decision-makers. Covering the period from 2019 to 2033, with a base year of 2025 and a forecast period from 2025 to 2033, this report meticulously examines market dynamics, growth drivers, challenges, and competitive landscapes. The global market size is projected to reach xx Million by 2033, exhibiting a CAGR of xx% during the forecast period.
Direct Drive Wind Turbine Market Market Structure & Competitive Dynamics
The Direct Drive Wind Turbine Market is characterized by a moderately concentrated structure, with key players like Siemens Gamesa Renewable Energy SA, Goldwind Science & Technology Co Ltd, and Enercon GmbH holding significant market share. The market exhibits a dynamic innovation ecosystem, driven by continuous advancements in turbine design, materials science, and power electronics. Regulatory frameworks, particularly government incentives and renewable energy targets, significantly influence market growth. Product substitutes, primarily conventional geared wind turbines, pose a competitive challenge, although direct drive technology's advantages in terms of efficiency and reliability are gaining traction. End-user trends reveal a growing preference for larger capacity turbines, particularly in offshore wind projects. M&A activities have been relatively moderate, with deal values averaging xx Million in recent years. Specific metrics such as precise market share for each player and detailed M&A transaction values are available within the full report.
- Market Concentration: Moderately concentrated, with top 5 players holding approximately xx% of the market share.
- Innovation Ecosystem: Active, with continuous advancements in materials, design, and control systems.
- Regulatory Framework: Supportive in many regions, with government policies driving renewable energy adoption.
- Product Substitutes: Geared wind turbines, though direct drive systems offer superior efficiency and reliability.
- End-User Trends: Shift towards higher capacity turbines, especially in offshore applications.
- M&A Activities: Moderate activity with average deal values around xx Million.
Direct Drive Wind Turbine Market Industry Trends & Insights
The Direct Drive Wind Turbine Market is experiencing robust growth, fueled by increasing global demand for renewable energy, stringent environmental regulations, and technological advancements enhancing the efficiency and cost-effectiveness of direct drive turbines. The market's expansion is driven by several factors, including government incentives, declining manufacturing costs, and improved grid integration capabilities. Technological disruptions such as advancements in rare-earth magnet technology, improved power electronics, and the development of larger-capacity turbines contribute to increased market penetration. Consumer preferences are shifting towards larger, more efficient wind turbines with reduced maintenance requirements, advantages offered by the direct drive technology. Intense competition among established players and emerging companies further stimulates innovation and drives down costs, fostering market growth.
Dominant Markets & Segments in Direct Drive Wind Turbine Market
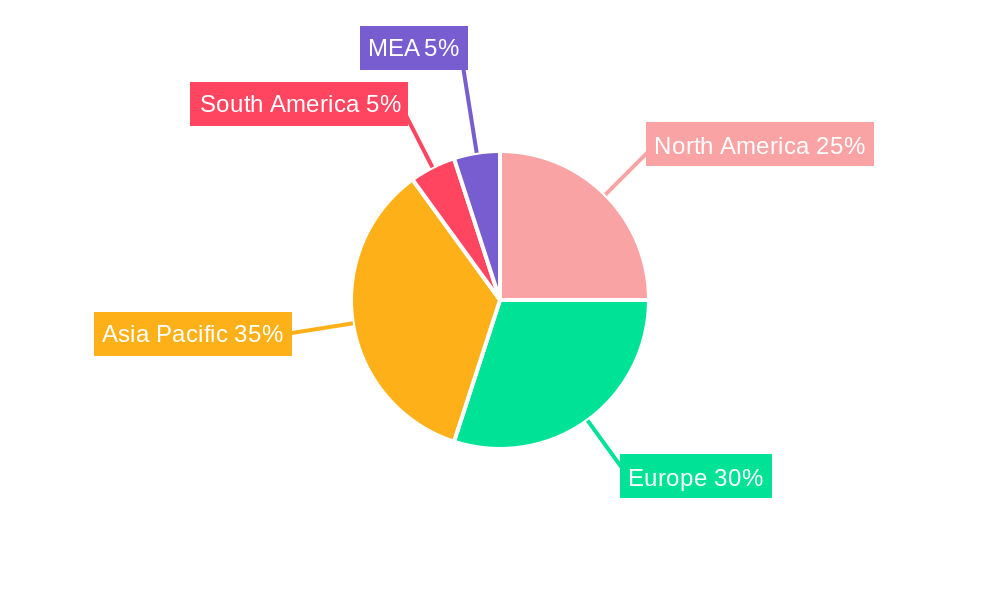
The offshore wind sector is currently the leading segment within the Direct Drive Wind Turbine Market, with the greater than 3 MW capacity segment showing the highest growth rate. Europe, particularly Germany and the UK, and Asia-Pacific, particularly China, are the dominant regional markets.
- Capacity Segment Dominance: Greater than 3 MW capacity segment leads due to its suitability for large-scale offshore projects.
- Regional Dominance: Europe (Germany, UK) and Asia-Pacific (China) leading due to favorable policies and substantial offshore wind development.
Key Drivers for Dominant Regions and Segments:
- Europe (Germany, UK): Strong government support for renewable energy, well-established offshore wind infrastructure, and favorable grid connections.
- Asia-Pacific (China): Massive investments in renewable energy infrastructure, ambitious renewable energy targets, and cost-competitive manufacturing base.
- Greater than 3 MW Capacity Segment: Economies of scale, improved energy capture, and suitability for offshore projects.
Direct Drive Wind Turbine Market Product Innovations
Recent product innovations focus on enhancing turbine efficiency, reliability, and reducing the Levelized Cost of Energy (LCOE). Advancements in rare-earth magnet technology, improved blade designs, and sophisticated control systems are key areas of development. These innovations target specific market needs, such as reducing maintenance costs and improving grid integration capabilities, leading to wider market adoption of direct drive wind turbines.
Report Segmentation & Scope
This report segments the Direct Drive Wind Turbine Market based on capacity:
- Less than 1 MW: This segment is characterized by smaller-scale applications and focuses on distributed generation. Growth is expected to be slower than other segments.
- 1 MW - 3 MW: This segment caters to both onshore and some smaller offshore projects. It benefits from improved technology while remaining cost-competitive.
- Greater than 3 MW: This segment dominates the market, driven by large-scale offshore projects and economies of scale. This segment holds the highest growth potential.
Market size and growth projections are provided for each segment within the full report.
Key Drivers of Direct Drive Wind Turbine Market Growth
The primary growth drivers for the Direct Drive Wind Turbine Market include:
- Increasing global demand for renewable energy: Driven by climate change concerns and government regulations.
- Technological advancements: Improvements in efficiency, reliability, and cost-effectiveness of direct drive turbines.
- Government support and incentives: Subsidies, tax breaks, and renewable energy mandates drive market growth.
Challenges in the Direct Drive Wind Turbine Market Sector
Challenges include:
- High initial investment costs: Direct drive turbines can have higher upfront costs compared to geared turbines.
- Supply chain disruptions: Dependence on rare-earth materials for magnets creates supply chain vulnerability.
- Competition from geared turbines: Geared turbines remain a strong competitor in some market segments.
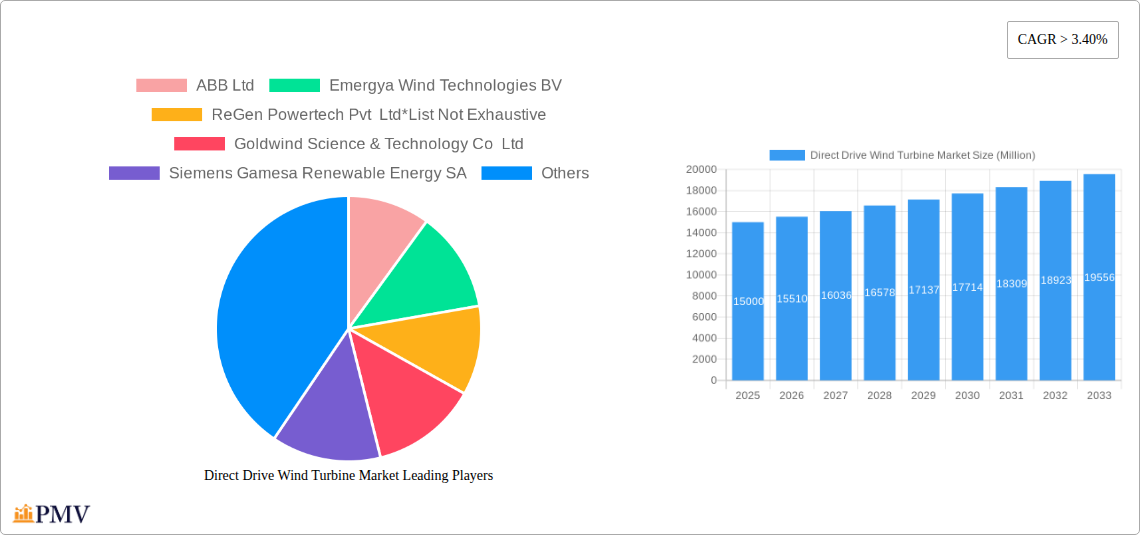
Leading Players in the Direct Drive Wind Turbine Market Market
- ABB Ltd
- Emergya Wind Technologies BV
- ReGen Powertech Pvt Ltd
- Goldwind Science & Technology Co Ltd
- Siemens Gamesa Renewable Energy SA
- Avantis Energy Group
- Northern Power System
- Bachmann electronic GmbH
- Rockwell Automation Inc
- M Torres Olvega Industrial
- Enercon GmbH
Key Developments in Direct Drive Wind Turbine Market Sector
- December 2021: Siemens Gamesa secured a significant order from Orsted for 23 direct drive offshore wind turbines for a German project, highlighting the growing adoption of direct drive technology in the offshore wind sector. This further solidified Siemens Gamesa's market position.
Strategic Direct Drive Wind Turbine Market Market Outlook
The Direct Drive Wind Turbine Market is poised for continued strong growth, driven by increasing global renewable energy targets, technological advancements, and cost reductions. Strategic opportunities lie in focusing on larger capacity turbines for offshore applications, developing innovative solutions to address supply chain challenges, and exploring new market segments such as floating offshore wind. The market's future growth is strongly linked to continued government support, technological innovation, and successful integration of direct drive turbines into smart grids.
Direct Drive Wind Turbine Market Segmentation
-
1. Capacity
- 1.1. Less than 1 MW
- 1.2. 1 MW - 3 MW
- 1.3. Greater than 3 MW
Direct Drive Wind Turbine Market Segmentation By Geography
- 1. North America
- 2. Europe
- 3. Asia Pacific
- 4. South America
- 5. Middle East and Africa
Direct Drive Wind Turbine Market REPORT HIGHLIGHTS
| Aspects | Details |
|---|---|
| Study Period | 2019-2033 |
| Base Year | 2024 |
| Estimated Year | 2025 |
| Forecast Period | 2025-2033 |
| Historical Period | 2019-2024 |
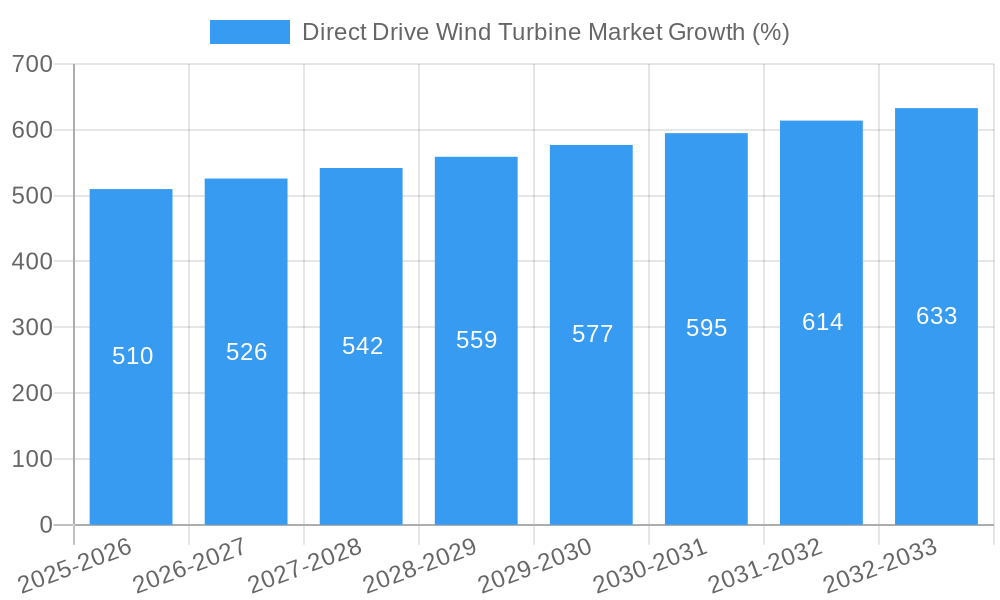
| Growth Rate | CAGR of > 3.40% from 2019-2033 |
| Segmentation |
|
Table of Contents
- 1. Introduction
- 1.1. Research Scope
- 1.2. Market Segmentation
- 1.3. Research Methodology
- 1.4. Definitions and Assumptions
- 2. Executive Summary
- 2.1. Introduction
- 3. Market Dynamics
- 3.1. Introduction
- 3.2. Market Drivers
- 3.2.1. 4.; Substantial Investments and Efforts to Modernize the T&D Grid
- 3.3. Market Restrains
- 3.3.1. 4.; Expansion of High Voltage Direct Current (HVDC) Networks
- 3.4. Market Trends
- 3.4.1. Offshore Segment to Witness Growth for Turbine Capacity of 1 MW – 3 MW
- 4. Market Factor Analysis
- 4.1. Porters Five Forces
- 4.2. Supply/Value Chain
- 4.3. PESTEL analysis
- 4.4. Market Entropy
- 4.5. Patent/Trademark Analysis
- 5. Global Direct Drive Wind Turbine Market Analysis, Insights and Forecast, 2019-2031
- 5.1. Market Analysis, Insights and Forecast - by Capacity
- 5.1.1. Less than 1 MW
- 5.1.2. 1 MW - 3 MW
- 5.1.3. Greater than 3 MW
- 5.2. Market Analysis, Insights and Forecast - by Region
- 5.2.1. North America
- 5.2.2. Europe
- 5.2.3. Asia Pacific
- 5.2.4. South America
- 5.2.5. Middle East and Africa
- 5.1. Market Analysis, Insights and Forecast - by Capacity
- 6. North America Direct Drive Wind Turbine Market Analysis, Insights and Forecast, 2019-2031
- 6.1. Market Analysis, Insights and Forecast - by Capacity
- 6.1.1. Less than 1 MW
- 6.1.2. 1 MW - 3 MW
- 6.1.3. Greater than 3 MW
- 6.1. Market Analysis, Insights and Forecast - by Capacity
- 7. Europe Direct Drive Wind Turbine Market Analysis, Insights and Forecast, 2019-2031
- 7.1. Market Analysis, Insights and Forecast - by Capacity
- 7.1.1. Less than 1 MW
- 7.1.2. 1 MW - 3 MW
- 7.1.3. Greater than 3 MW
- 7.1. Market Analysis, Insights and Forecast - by Capacity
- 8. Asia Pacific Direct Drive Wind Turbine Market Analysis, Insights and Forecast, 2019-2031
- 8.1. Market Analysis, Insights and Forecast - by Capacity
- 8.1.1. Less than 1 MW
- 8.1.2. 1 MW - 3 MW
- 8.1.3. Greater than 3 MW
- 8.1. Market Analysis, Insights and Forecast - by Capacity
- 9. South America Direct Drive Wind Turbine Market Analysis, Insights and Forecast, 2019-2031
- 9.1. Market Analysis, Insights and Forecast - by Capacity
- 9.1.1. Less than 1 MW
- 9.1.2. 1 MW - 3 MW
- 9.1.3. Greater than 3 MW
- 9.1. Market Analysis, Insights and Forecast - by Capacity
- 10. Middle East and Africa Direct Drive Wind Turbine Market Analysis, Insights and Forecast, 2019-2031
- 10.1. Market Analysis, Insights and Forecast - by Capacity
- 10.1.1. Less than 1 MW
- 10.1.2. 1 MW - 3 MW
- 10.1.3. Greater than 3 MW
- 10.1. Market Analysis, Insights and Forecast - by Capacity
- 11. North America Direct Drive Wind Turbine Market Analysis, Insights and Forecast, 2019-2031
- 11.1. Market Analysis, Insights and Forecast - By Country/Sub-region
- 11.1.1 United States
- 11.1.2 Canada
- 11.1.3 Mexico
- 12. Europe Direct Drive Wind Turbine Market Analysis, Insights and Forecast, 2019-2031
- 12.1. Market Analysis, Insights and Forecast - By Country/Sub-region
- 12.1.1 Germany
- 12.1.2 United Kingdom
- 12.1.3 France
- 12.1.4 Spain
- 12.1.5 Italy
- 12.1.6 Spain
- 12.1.7 Belgium
- 12.1.8 Netherland
- 12.1.9 Nordics
- 12.1.10 Rest of Europe
- 13. Asia Pacific Direct Drive Wind Turbine Market Analysis, Insights and Forecast, 2019-2031
- 13.1. Market Analysis, Insights and Forecast - By Country/Sub-region
- 13.1.1 China
- 13.1.2 Japan
- 13.1.3 India
- 13.1.4 South Korea
- 13.1.5 Southeast Asia
- 13.1.6 Australia
- 13.1.7 Indonesia
- 13.1.8 Phillipes
- 13.1.9 Singapore
- 13.1.10 Thailandc
- 13.1.11 Rest of Asia Pacific
- 14. South America Direct Drive Wind Turbine Market Analysis, Insights and Forecast, 2019-2031
- 14.1. Market Analysis, Insights and Forecast - By Country/Sub-region
- 14.1.1 Brazil
- 14.1.2 Argentina
- 14.1.3 Peru
- 14.1.4 Chile
- 14.1.5 Colombia
- 14.1.6 Ecuador
- 14.1.7 Venezuela
- 14.1.8 Rest of South America
- 15. North America Direct Drive Wind Turbine Market Analysis, Insights and Forecast, 2019-2031
- 15.1. Market Analysis, Insights and Forecast - By Country/Sub-region
- 15.1.1 United States
- 15.1.2 Canada
- 15.1.3 Mexico
- 16. MEA Direct Drive Wind Turbine Market Analysis, Insights and Forecast, 2019-2031
- 16.1. Market Analysis, Insights and Forecast - By Country/Sub-region
- 16.1.1 United Arab Emirates
- 16.1.2 Saudi Arabia
- 16.1.3 South Africa
- 16.1.4 Rest of Middle East and Africa
- 17. Competitive Analysis
- 17.1. Global Market Share Analysis 2024
- 17.2. Company Profiles
- 17.2.1 ABB Ltd
- 17.2.1.1. Overview
- 17.2.1.2. Products
- 17.2.1.3. SWOT Analysis
- 17.2.1.4. Recent Developments
- 17.2.1.5. Financials (Based on Availability)
- 17.2.2 Emergya Wind Technologies BV
- 17.2.2.1. Overview
- 17.2.2.2. Products
- 17.2.2.3. SWOT Analysis
- 17.2.2.4. Recent Developments
- 17.2.2.5. Financials (Based on Availability)
- 17.2.3 ReGen Powertech Pvt Ltd*List Not Exhaustive
- 17.2.3.1. Overview
- 17.2.3.2. Products
- 17.2.3.3. SWOT Analysis
- 17.2.3.4. Recent Developments
- 17.2.3.5. Financials (Based on Availability)
- 17.2.4 Goldwind Science & Technology Co Ltd
- 17.2.4.1. Overview
- 17.2.4.2. Products
- 17.2.4.3. SWOT Analysis
- 17.2.4.4. Recent Developments
- 17.2.4.5. Financials (Based on Availability)
- 17.2.5 Siemens Gamesa Renewable Energy SA
- 17.2.5.1. Overview
- 17.2.5.2. Products
- 17.2.5.3. SWOT Analysis
- 17.2.5.4. Recent Developments
- 17.2.5.5. Financials (Based on Availability)
- 17.2.6 Avantis Energy Group
- 17.2.6.1. Overview
- 17.2.6.2. Products
- 17.2.6.3. SWOT Analysis
- 17.2.6.4. Recent Developments
- 17.2.6.5. Financials (Based on Availability)
- 17.2.7 Northern Power System
- 17.2.7.1. Overview
- 17.2.7.2. Products
- 17.2.7.3. SWOT Analysis
- 17.2.7.4. Recent Developments
- 17.2.7.5. Financials (Based on Availability)
- 17.2.8 Bachmann electronic GmbH
- 17.2.8.1. Overview
- 17.2.8.2. Products
- 17.2.8.3. SWOT Analysis
- 17.2.8.4. Recent Developments
- 17.2.8.5. Financials (Based on Availability)
- 17.2.9 Rockwell Automation Inc
- 17.2.9.1. Overview
- 17.2.9.2. Products
- 17.2.9.3. SWOT Analysis
- 17.2.9.4. Recent Developments
- 17.2.9.5. Financials (Based on Availability)
- 17.2.10 M Torres Olvega Industrial
- 17.2.10.1. Overview
- 17.2.10.2. Products
- 17.2.10.3. SWOT Analysis
- 17.2.10.4. Recent Developments
- 17.2.10.5. Financials (Based on Availability)
- 17.2.11 Enercon GmbH
- 17.2.11.1. Overview
- 17.2.11.2. Products
- 17.2.11.3. SWOT Analysis
- 17.2.11.4. Recent Developments
- 17.2.11.5. Financials (Based on Availability)
- 17.2.1 ABB Ltd
List of Figures
- Figure 1: Global Direct Drive Wind Turbine Market Revenue Breakdown (Million, %) by Region 2024 & 2032
- Figure 2: North America Direct Drive Wind Turbine Market Revenue (Million), by Country 2024 & 2032
- Figure 3: North America Direct Drive Wind Turbine Market Revenue Share (%), by Country 2024 & 2032
- Figure 4: Europe Direct Drive Wind Turbine Market Revenue (Million), by Country 2024 & 2032
- Figure 5: Europe Direct Drive Wind Turbine Market Revenue Share (%), by Country 2024 & 2032
- Figure 6: Asia Pacific Direct Drive Wind Turbine Market Revenue (Million), by Country 2024 & 2032
- Figure 7: Asia Pacific Direct Drive Wind Turbine Market Revenue Share (%), by Country 2024 & 2032
- Figure 8: South America Direct Drive Wind Turbine Market Revenue (Million), by Country 2024 & 2032
- Figure 9: South America Direct Drive Wind Turbine Market Revenue Share (%), by Country 2024 & 2032
- Figure 10: North America Direct Drive Wind Turbine Market Revenue (Million), by Country 2024 & 2032
- Figure 11: North America Direct Drive Wind Turbine Market Revenue Share (%), by Country 2024 & 2032
- Figure 12: MEA Direct Drive Wind Turbine Market Revenue (Million), by Country 2024 & 2032
- Figure 13: MEA Direct Drive Wind Turbine Market Revenue Share (%), by Country 2024 & 2032
- Figure 14: North America Direct Drive Wind Turbine Market Revenue (Million), by Capacity 2024 & 2032
- Figure 15: North America Direct Drive Wind Turbine Market Revenue Share (%), by Capacity 2024 & 2032
- Figure 16: North America Direct Drive Wind Turbine Market Revenue (Million), by Country 2024 & 2032
- Figure 17: North America Direct Drive Wind Turbine Market Revenue Share (%), by Country 2024 & 2032
- Figure 18: Europe Direct Drive Wind Turbine Market Revenue (Million), by Capacity 2024 & 2032
- Figure 19: Europe Direct Drive Wind Turbine Market Revenue Share (%), by Capacity 2024 & 2032
- Figure 20: Europe Direct Drive Wind Turbine Market Revenue (Million), by Country 2024 & 2032
- Figure 21: Europe Direct Drive Wind Turbine Market Revenue Share (%), by Country 2024 & 2032
- Figure 22: Asia Pacific Direct Drive Wind Turbine Market Revenue (Million), by Capacity 2024 & 2032
- Figure 23: Asia Pacific Direct Drive Wind Turbine Market Revenue Share (%), by Capacity 2024 & 2032
- Figure 24: Asia Pacific Direct Drive Wind Turbine Market Revenue (Million), by Country 2024 & 2032
- Figure 25: Asia Pacific Direct Drive Wind Turbine Market Revenue Share (%), by Country 2024 & 2032
- Figure 26: South America Direct Drive Wind Turbine Market Revenue (Million), by Capacity 2024 & 2032
- Figure 27: South America Direct Drive Wind Turbine Market Revenue Share (%), by Capacity 2024 & 2032
- Figure 28: South America Direct Drive Wind Turbine Market Revenue (Million), by Country 2024 & 2032
- Figure 29: South America Direct Drive Wind Turbine Market Revenue Share (%), by Country 2024 & 2032
- Figure 30: Middle East and Africa Direct Drive Wind Turbine Market Revenue (Million), by Capacity 2024 & 2032
- Figure 31: Middle East and Africa Direct Drive Wind Turbine Market Revenue Share (%), by Capacity 2024 & 2032
- Figure 32: Middle East and Africa Direct Drive Wind Turbine Market Revenue (Million), by Country 2024 & 2032
- Figure 33: Middle East and Africa Direct Drive Wind Turbine Market Revenue Share (%), by Country 2024 & 2032
List of Tables
- Table 1: Global Direct Drive Wind Turbine Market Revenue Million Forecast, by Region 2019 & 2032
- Table 2: Global Direct Drive Wind Turbine Market Revenue Million Forecast, by Capacity 2019 & 2032
- Table 3: Global Direct Drive Wind Turbine Market Revenue Million Forecast, by Region 2019 & 2032
- Table 4: Global Direct Drive Wind Turbine Market Revenue Million Forecast, by Country 2019 & 2032
- Table 5: United States Direct Drive Wind Turbine Market Revenue (Million) Forecast, by Application 2019 & 2032
- Table 6: Canada Direct Drive Wind Turbine Market Revenue (Million) Forecast, by Application 2019 & 2032
- Table 7: Mexico Direct Drive Wind Turbine Market Revenue (Million) Forecast, by Application 2019 & 2032
- Table 8: Global Direct Drive Wind Turbine Market Revenue Million Forecast, by Country 2019 & 2032
- Table 9: Germany Direct Drive Wind Turbine Market Revenue (Million) Forecast, by Application 2019 & 2032
- Table 10: United Kingdom Direct Drive Wind Turbine Market Revenue (Million) Forecast, by Application 2019 & 2032
- Table 11: France Direct Drive Wind Turbine Market Revenue (Million) Forecast, by Application 2019 & 2032
- Table 12: Spain Direct Drive Wind Turbine Market Revenue (Million) Forecast, by Application 2019 & 2032
- Table 13: Italy Direct Drive Wind Turbine Market Revenue (Million) Forecast, by Application 2019 & 2032
- Table 14: Spain Direct Drive Wind Turbine Market Revenue (Million) Forecast, by Application 2019 & 2032
- Table 15: Belgium Direct Drive Wind Turbine Market Revenue (Million) Forecast, by Application 2019 & 2032
- Table 16: Netherland Direct Drive Wind Turbine Market Revenue (Million) Forecast, by Application 2019 & 2032
- Table 17: Nordics Direct Drive Wind Turbine Market Revenue (Million) Forecast, by Application 2019 & 2032
- Table 18: Rest of Europe Direct Drive Wind Turbine Market Revenue (Million) Forecast, by Application 2019 & 2032
- Table 19: Global Direct Drive Wind Turbine Market Revenue Million Forecast, by Country 2019 & 2032
- Table 20: China Direct Drive Wind Turbine Market Revenue (Million) Forecast, by Application 2019 & 2032
- Table 21: Japan Direct Drive Wind Turbine Market Revenue (Million) Forecast, by Application 2019 & 2032
- Table 22: India Direct Drive Wind Turbine Market Revenue (Million) Forecast, by Application 2019 & 2032
- Table 23: South Korea Direct Drive Wind Turbine Market Revenue (Million) Forecast, by Application 2019 & 2032
- Table 24: Southeast Asia Direct Drive Wind Turbine Market Revenue (Million) Forecast, by Application 2019 & 2032
- Table 25: Australia Direct Drive Wind Turbine Market Revenue (Million) Forecast, by Application 2019 & 2032
- Table 26: Indonesia Direct Drive Wind Turbine Market Revenue (Million) Forecast, by Application 2019 & 2032
- Table 27: Phillipes Direct Drive Wind Turbine Market Revenue (Million) Forecast, by Application 2019 & 2032
- Table 28: Singapore Direct Drive Wind Turbine Market Revenue (Million) Forecast, by Application 2019 & 2032
- Table 29: Thailandc Direct Drive Wind Turbine Market Revenue (Million) Forecast, by Application 2019 & 2032
- Table 30: Rest of Asia Pacific Direct Drive Wind Turbine Market Revenue (Million) Forecast, by Application 2019 & 2032
- Table 31: Global Direct Drive Wind Turbine Market Revenue Million Forecast, by Country 2019 & 2032
- Table 32: Brazil Direct Drive Wind Turbine Market Revenue (Million) Forecast, by Application 2019 & 2032
- Table 33: Argentina Direct Drive Wind Turbine Market Revenue (Million) Forecast, by Application 2019 & 2032
- Table 34: Peru Direct Drive Wind Turbine Market Revenue (Million) Forecast, by Application 2019 & 2032
- Table 35: Chile Direct Drive Wind Turbine Market Revenue (Million) Forecast, by Application 2019 & 2032
- Table 36: Colombia Direct Drive Wind Turbine Market Revenue (Million) Forecast, by Application 2019 & 2032
- Table 37: Ecuador Direct Drive Wind Turbine Market Revenue (Million) Forecast, by Application 2019 & 2032
- Table 38: Venezuela Direct Drive Wind Turbine Market Revenue (Million) Forecast, by Application 2019 & 2032
- Table 39: Rest of South America Direct Drive Wind Turbine Market Revenue (Million) Forecast, by Application 2019 & 2032
- Table 40: Global Direct Drive Wind Turbine Market Revenue Million Forecast, by Country 2019 & 2032
- Table 41: United States Direct Drive Wind Turbine Market Revenue (Million) Forecast, by Application 2019 & 2032
- Table 42: Canada Direct Drive Wind Turbine Market Revenue (Million) Forecast, by Application 2019 & 2032
- Table 43: Mexico Direct Drive Wind Turbine Market Revenue (Million) Forecast, by Application 2019 & 2032
- Table 44: Global Direct Drive Wind Turbine Market Revenue Million Forecast, by Country 2019 & 2032
- Table 45: United Arab Emirates Direct Drive Wind Turbine Market Revenue (Million) Forecast, by Application 2019 & 2032
- Table 46: Saudi Arabia Direct Drive Wind Turbine Market Revenue (Million) Forecast, by Application 2019 & 2032
- Table 47: South Africa Direct Drive Wind Turbine Market Revenue (Million) Forecast, by Application 2019 & 2032
- Table 48: Rest of Middle East and Africa Direct Drive Wind Turbine Market Revenue (Million) Forecast, by Application 2019 & 2032
- Table 49: Global Direct Drive Wind Turbine Market Revenue Million Forecast, by Capacity 2019 & 2032
- Table 50: Global Direct Drive Wind Turbine Market Revenue Million Forecast, by Country 2019 & 2032
- Table 51: Global Direct Drive Wind Turbine Market Revenue Million Forecast, by Capacity 2019 & 2032
- Table 52: Global Direct Drive Wind Turbine Market Revenue Million Forecast, by Country 2019 & 2032
- Table 53: Global Direct Drive Wind Turbine Market Revenue Million Forecast, by Capacity 2019 & 2032
- Table 54: Global Direct Drive Wind Turbine Market Revenue Million Forecast, by Country 2019 & 2032
- Table 55: Global Direct Drive Wind Turbine Market Revenue Million Forecast, by Capacity 2019 & 2032
- Table 56: Global Direct Drive Wind Turbine Market Revenue Million Forecast, by Country 2019 & 2032
- Table 57: Global Direct Drive Wind Turbine Market Revenue Million Forecast, by Capacity 2019 & 2032
- Table 58: Global Direct Drive Wind Turbine Market Revenue Million Forecast, by Country 2019 & 2032
Frequently Asked Questions
1. What is the projected Compound Annual Growth Rate (CAGR) of the Direct Drive Wind Turbine Market?
The projected CAGR is approximately > 3.40%.
2. Which companies are prominent players in the Direct Drive Wind Turbine Market?
Key companies in the market include ABB Ltd, Emergya Wind Technologies BV, ReGen Powertech Pvt Ltd*List Not Exhaustive, Goldwind Science & Technology Co Ltd, Siemens Gamesa Renewable Energy SA, Avantis Energy Group, Northern Power System, Bachmann electronic GmbH, Rockwell Automation Inc, M Torres Olvega Industrial, Enercon GmbH.
3. What are the main segments of the Direct Drive Wind Turbine Market?
The market segments include Capacity.
4. Can you provide details about the market size?
The market size is estimated to be USD XX Million as of 2022.
5. What are some drivers contributing to market growth?
4.; Substantial Investments and Efforts to Modernize the T&D Grid.
6. What are the notable trends driving market growth?
Offshore Segment to Witness Growth for Turbine Capacity of 1 MW – 3 MW.
7. Are there any restraints impacting market growth?
4.; Expansion of High Voltage Direct Current (HVDC) Networks.
8. Can you provide examples of recent developments in the market?
In December 2021, Siemens Gamesa received an order from Orsted for a German offshore wind power project to supply 23 Siemens Gamesa 11.0-200 direct drive offshore wind turbines. The scope of the order includes a five-year service agreement. This order may enhance the company's presence in the German offshore wind industry.
9. What pricing options are available for accessing the report?
Pricing options include single-user, multi-user, and enterprise licenses priced at USD 4750, USD 5250, and USD 8750 respectively.
10. Is the market size provided in terms of value or volume?
The market size is provided in terms of value, measured in Million.
11. Are there any specific market keywords associated with the report?
Yes, the market keyword associated with the report is "Direct Drive Wind Turbine Market," which aids in identifying and referencing the specific market segment covered.
12. How do I determine which pricing option suits my needs best?
The pricing options vary based on user requirements and access needs. Individual users may opt for single-user licenses, while businesses requiring broader access may choose multi-user or enterprise licenses for cost-effective access to the report.
13. Are there any additional resources or data provided in the Direct Drive Wind Turbine Market report?
While the report offers comprehensive insights, it's advisable to review the specific contents or supplementary materials provided to ascertain if additional resources or data are available.
14. How can I stay updated on further developments or reports in the Direct Drive Wind Turbine Market?
To stay informed about further developments, trends, and reports in the Direct Drive Wind Turbine Market, consider subscribing to industry newsletters, following relevant companies and organizations, or regularly checking reputable industry news sources and publications.
Methodology
Step 1 - Identification of Relevant Samples Size from Population Database


Step 2 - Approaches for Defining Global Market Size (Value, Volume* & Price*)

Note*: In applicable scenarios
Step 3 - Data Sources
Primary Research
- Web Analytics
- Survey Reports
- Research Institute
- Latest Research Reports
- Opinion Leaders
Secondary Research
- Annual Reports
- White Paper
- Latest Press Release
- Industry Association
- Paid Database
- Investor Presentations

Step 4 - Data Triangulation
Involves using different sources of information in order to increase the validity of a study
These sources are likely to be stakeholders in a program - participants, other researchers, program staff, other community members, and so on.
Then we put all data in single framework & apply various statistical tools to find out the dynamic on the market.
During the analysis stage, feedback from the stakeholder groups would be compared to determine areas of agreement as well as areas of divergence


