
Key Insights
The digital power generation market is experiencing robust growth, driven by the increasing demand for reliable, efficient, and sustainable energy solutions. A compound annual growth rate (CAGR) exceeding 5.80% from 2019 to 2024 indicates a significant upward trajectory. This expansion is fueled by several key factors: the widespread adoption of smart grids and advanced metering infrastructure (AMI) for enhanced grid management and energy efficiency; the integration of renewable energy sources, such as solar and wind power, necessitating sophisticated digital control systems; and the growing need for predictive maintenance and operational optimization to reduce downtime and improve asset lifespan. The market is segmented by technology (integrated solutions, hardware) and sector (power generation, transmission & distribution (T&D), energy storage, energy trading). Integrated solutions are witnessing the highest adoption, owing to their ability to provide holistic energy management capabilities. Geographically, North America and Europe are currently leading the market due to established infrastructure and advanced technological capabilities, while the Asia-Pacific region is expected to exhibit substantial growth in the coming years driven by increasing investments in renewable energy and infrastructure development. Major players like ABB, Siemens, and GE are driving innovation and market consolidation through strategic partnerships, acquisitions, and the development of cutting-edge digital technologies.
The restraints on market growth primarily involve high initial investment costs associated with digital infrastructure deployment, cybersecurity concerns related to the interconnected nature of smart grids, and the need for skilled workforce to manage and maintain these sophisticated systems. However, government initiatives promoting renewable energy integration and energy efficiency, coupled with declining hardware costs and advancements in data analytics, are expected to mitigate these challenges. The forecast period (2025-2033) promises continued expansion, with the Asia-Pacific region projected to become a significant growth driver. The energy storage segment is anticipated to experience particularly strong growth fueled by the increasing need for grid stability and the integration of intermittent renewable energy sources. The market's evolution will continue to be shaped by the ongoing technological advancements in areas such as artificial intelligence (AI), machine learning (ML), and the Internet of Things (IoT), fostering greater automation and optimization within the power generation sector.
Digital Power Generation Market: A Comprehensive Report (2019-2033)
This comprehensive report provides a detailed analysis of the Digital Power Generation Market, covering the period 2019-2033, with a base year of 2025 and a forecast period of 2025-2033. It offers actionable insights into market structure, competitive dynamics, industry trends, dominant segments, technological innovations, and strategic outlook, empowering stakeholders to make informed decisions in this rapidly evolving landscape. The market is projected to reach xx Million by 2033, exhibiting a CAGR of xx% during the forecast period.
Digital Power Generation Market Market Structure & Competitive Dynamics
The Digital Power Generation Market exhibits a moderately concentrated structure, with a few major players holding significant market share. However, the presence of numerous smaller, specialized firms fosters innovation and competition. The market is shaped by stringent regulatory frameworks focused on grid stability, security, and environmental sustainability. Product substitution is a factor, with advancements in alternative technologies continually impacting market dynamics. End-user trends, particularly the increasing demand for renewable energy sources and the growing adoption of smart grids, are driving market growth. Mergers and acquisitions (M&A) activity is substantial, with deal values reaching xx Million in recent years, aimed at expanding market reach and technological capabilities. For example, the acquisition of [Company A] by [Company B] in [Year] resulted in a combined market share of xx%. Key metrics analyzed include market concentration ratio (CR), Herfindahl-Hirschman Index (HHI), and M&A deal volume and value.
- Market Concentration: Moderately concentrated, with top 5 players holding approximately xx% of the market share.
- Innovation Ecosystems: Strong presence of research institutions, startups, and established players leading to rapid technological advancements.
- Regulatory Frameworks: Stringent regulations around data security, grid reliability, and environmental impact.
- Product Substitutes: Competition from alternative energy solutions and grid management technologies.
- End-User Trends: Increased demand for smart grids, renewable energy integration, and improved grid efficiency.
- M&A Activity: Significant activity with deal values exceeding xx Million annually, driven by strategic expansion and technological acquisition.
Digital Power Generation Market Industry Trends & Insights
The Digital Power Generation Market is experiencing robust growth fueled by several key factors. The increasing penetration of renewable energy sources necessitates sophisticated grid management solutions, driving demand for digital technologies. Technological disruptions, such as the advent of artificial intelligence (AI), machine learning (ML), and the Internet of Things (IoT), are transforming the sector, enabling predictive maintenance, optimized energy distribution, and enhanced grid resilience. Consumer preferences are shifting towards sustainable and reliable energy solutions, further propelling market growth. The competitive landscape is dynamic, with established players and new entrants vying for market share through innovation and strategic partnerships. The market exhibits a substantial growth trajectory, with a projected CAGR of xx% from 2025 to 2033, driven by factors such as government initiatives promoting digitalization in the energy sector and the increasing adoption of smart grid technologies. Market penetration of digital solutions in power generation is expected to increase from xx% in 2025 to xx% by 2033.
Dominant Markets & Segments in Digital Power Generation Market
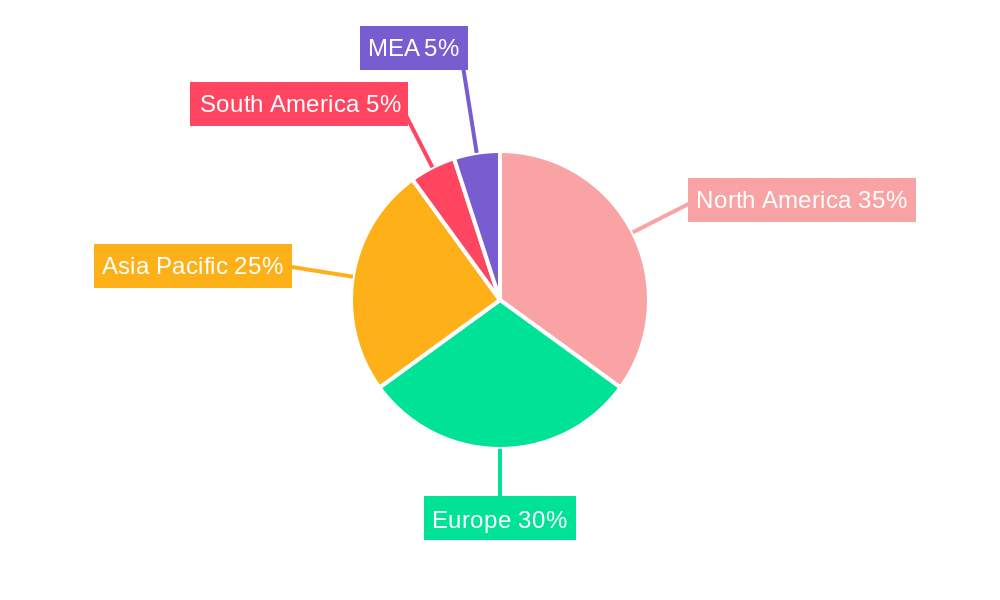
The North American region currently holds the leading position in the Digital Power Generation Market, driven by substantial investments in grid modernization, a robust renewable energy sector, and supportive government policies. However, the Asia-Pacific region is projected to experience the highest growth rate over the forecast period due to rapid economic development, increasing energy demand, and significant government initiatives aimed at promoting digitalization in the energy sector. Within the technology segments, Integrated Solutions hold a larger market share currently due to their comprehensive nature, offering a holistic approach to digital grid management. However, Hardware segment is anticipated to exhibit faster growth due to the increasing demand for advanced sensors and monitoring devices. In terms of sector, Power Generation is currently the dominant segment, followed by Transmission & Distribution (T&D). However, Energy Storage and Energy Trading segments are expected to see rapid growth in the coming years, fueled by the expansion of renewable energy sources and the need for efficient energy management.
- Key Drivers for North America: Robust renewable energy sector, significant investments in grid modernization, and supportive government policies.
- Key Drivers for Asia-Pacific: Rapid economic development, rising energy demand, and government initiatives promoting digitalization.
- Integrated Solutions: High market share due to comprehensive capabilities and holistic approach.
- Hardware: Rapid growth projected due to increasing demand for advanced sensors and monitoring devices.
- Power Generation: Currently dominant sector, followed by T&D.
- Energy Storage & Energy Trading: Significant growth potential driven by renewable energy expansion and efficient energy management needs.
Digital Power Generation Market Product Innovations
Recent product innovations have focused on enhancing the efficiency, reliability, and security of digital power generation systems. Advancements in AI and ML are enabling predictive maintenance, optimized energy distribution, and improved grid stability. The integration of IoT devices allows for real-time monitoring and control of power generation assets. New solutions are emphasizing cybersecurity measures to protect against cyber threats. These innovations are improving the market fit by addressing critical challenges in the energy sector, such as enhancing grid resilience and ensuring reliable power supply.
Report Segmentation & Scope
This report segments the Digital Power Generation Market based on technology (Integrated Solutions and Hardware) and sector (Power Generation, Transmission and Distribution (T&D), Energy Storage, and Energy Trading). The Integrated Solutions segment is projected to grow at a CAGR of xx% during the forecast period, driven by the demand for comprehensive grid management solutions. The Hardware segment is expected to grow at a CAGR of xx%, fueled by the rising need for advanced sensors, meters, and communication devices. The Power Generation sector dominates the market currently, exhibiting a CAGR of xx%, while the Energy Storage and Energy Trading sectors are projected to experience high growth rates, reflecting the increasing adoption of renewable energy sources and the need for efficient energy management systems. The Transmission and Distribution (T&D) sector is also expected to show steady growth driven by investments in grid modernization and expansion.
Key Drivers of Digital Power Generation Market Growth
The Digital Power Generation Market is driven by several key factors. Technological advancements, particularly in AI, ML, and IoT, are enabling the development of innovative solutions for enhanced grid management, predictive maintenance, and optimized energy distribution. Government regulations promoting renewable energy integration and grid modernization are creating a favorable environment for market expansion. The increasing demand for reliable and sustainable energy, coupled with growing concerns about climate change, is further driving market growth. Furthermore, the decreasing cost of digital technologies is making them more accessible to power generation companies, accelerating adoption rates.
Challenges in the Digital Power Generation Market Sector
The Digital Power Generation Market faces several challenges. High initial investment costs associated with implementing digital technologies can be a barrier for smaller companies. Data security and cybersecurity concerns are crucial, requiring robust measures to protect sensitive grid data from cyber threats. Integration complexities between existing legacy systems and new digital technologies pose significant challenges. Furthermore, the lack of skilled workforce specializing in digital grid management can hinder implementation and effective utilization of these technologies. These factors collectively impact market expansion and adoption rates.
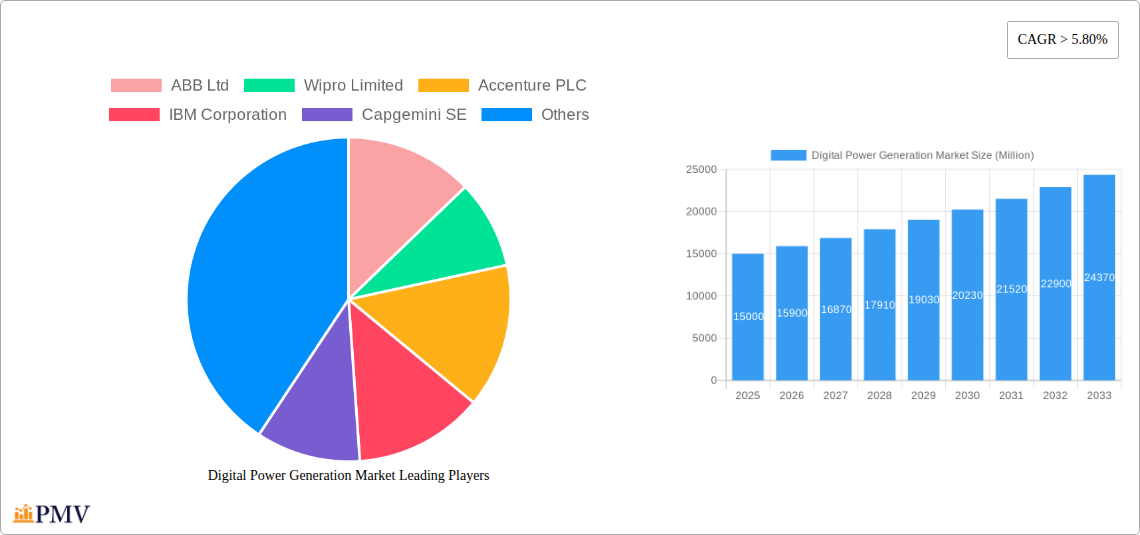
Leading Players in the Digital Power Generation Market Market
- ABB Ltd
- Wipro Limited
- Accenture PLC
- IBM Corporation
- Capgemini SE
- Siemens AG
- Infosys Limited
- Microsoft Corporation
- General Electric Company
- SAP SE
Key Developments in Digital Power Generation Market Sector
- March 2021: ABB reached the cumulative 5-gigawatt (GW) mark in providing Programmable Logic Controller-based (PLC) solar plant automation solutions in India, demonstrating significant market penetration and technological leadership in solar energy automation.
- September 2021: Infosys Ltd and Microsoft Corp. signed a multi-year strategic deal with Ausgrid to accelerate the cloud transformation of Australia's largest electricity distributor, showcasing the growing adoption of cloud-based solutions in the energy sector.
- October 2021: SP Group partnered to develop Singapore's first national grid digital twin, highlighting the increasing use of digital twins for improving grid resilience and reliability.
Strategic Digital Power Generation Market Market Outlook
The future of the Digital Power Generation Market is promising, with significant growth potential driven by the increasing adoption of renewable energy, government initiatives promoting grid modernization, and advancements in digital technologies. Strategic opportunities exist for companies to focus on developing innovative solutions that address key challenges, such as enhancing grid resilience, improving cybersecurity, and optimizing energy distribution. Companies that can successfully navigate the regulatory landscape and build strong partnerships will be well-positioned to capitalize on the market's growth potential. Furthermore, focusing on developing solutions for smart grids, energy storage, and efficient energy trading will be crucial for future success in this sector.
Digital Power Generation Market Segmentation
-
1. Technology
- 1.1. Integrated Solutions
- 1.2. Hardware
-
2. Sector
- 2.1. Power Generation
- 2.2. Transmission and Distribution (T&D)
- 2.3. Energy Storage
- 2.4. Energy Trading
Digital Power Generation Market Segmentation By Geography
- 1. North America
- 2. Europe
- 3. Asia Pacific
- 4. South America
- 5. Middle East
Digital Power Generation Market REPORT HIGHLIGHTS
| Aspects | Details |
|---|---|
| Study Period | 2019-2033 |
| Base Year | 2024 |
| Estimated Year | 2025 |
| Forecast Period | 2025-2033 |
| Historical Period | 2019-2024 |
| Growth Rate | CAGR of > 5.80% from 2019-2033 |
| Segmentation |
|
Table of Contents
- 1. Introduction
- 1.1. Research Scope
- 1.2. Market Segmentation
- 1.3. Research Methodology
- 1.4. Definitions and Assumptions
- 2. Executive Summary
- 2.1. Introduction
- 3. Market Dynamics
- 3.1. Introduction
- 3.2. Market Drivers
- 3.2.1. 4.; Supportive Government Policies and Incentives4.; Environmental Concerns
- 3.3. Market Restrains
- 3.3.1. 4.; Fossil Fuel Subsidies
- 3.4. Market Trends
- 3.4.1. Power Generation Segment to Witness Significant Growth
- 4. Market Factor Analysis
- 4.1. Porters Five Forces
- 4.2. Supply/Value Chain
- 4.3. PESTEL analysis
- 4.4. Market Entropy
- 4.5. Patent/Trademark Analysis
- 5. Global Digital Power Generation Market Analysis, Insights and Forecast, 2019-2031
- 5.1. Market Analysis, Insights and Forecast - by Technology
- 5.1.1. Integrated Solutions
- 5.1.2. Hardware
- 5.2. Market Analysis, Insights and Forecast - by Sector
- 5.2.1. Power Generation
- 5.2.2. Transmission and Distribution (T&D)
- 5.2.3. Energy Storage
- 5.2.4. Energy Trading
- 5.3. Market Analysis, Insights and Forecast - by Region
- 5.3.1. North America
- 5.3.2. Europe
- 5.3.3. Asia Pacific
- 5.3.4. South America
- 5.3.5. Middle East
- 5.1. Market Analysis, Insights and Forecast - by Technology
- 6. North America Digital Power Generation Market Analysis, Insights and Forecast, 2019-2031
- 6.1. Market Analysis, Insights and Forecast - by Technology
- 6.1.1. Integrated Solutions
- 6.1.2. Hardware
- 6.2. Market Analysis, Insights and Forecast - by Sector
- 6.2.1. Power Generation
- 6.2.2. Transmission and Distribution (T&D)
- 6.2.3. Energy Storage
- 6.2.4. Energy Trading
- 6.1. Market Analysis, Insights and Forecast - by Technology
- 7. Europe Digital Power Generation Market Analysis, Insights and Forecast, 2019-2031
- 7.1. Market Analysis, Insights and Forecast - by Technology
- 7.1.1. Integrated Solutions
- 7.1.2. Hardware
- 7.2. Market Analysis, Insights and Forecast - by Sector
- 7.2.1. Power Generation
- 7.2.2. Transmission and Distribution (T&D)
- 7.2.3. Energy Storage
- 7.2.4. Energy Trading
- 7.1. Market Analysis, Insights and Forecast - by Technology
- 8. Asia Pacific Digital Power Generation Market Analysis, Insights and Forecast, 2019-2031
- 8.1. Market Analysis, Insights and Forecast - by Technology
- 8.1.1. Integrated Solutions
- 8.1.2. Hardware
- 8.2. Market Analysis, Insights and Forecast - by Sector
- 8.2.1. Power Generation
- 8.2.2. Transmission and Distribution (T&D)
- 8.2.3. Energy Storage
- 8.2.4. Energy Trading
- 8.1. Market Analysis, Insights and Forecast - by Technology
- 9. South America Digital Power Generation Market Analysis, Insights and Forecast, 2019-2031
- 9.1. Market Analysis, Insights and Forecast - by Technology
- 9.1.1. Integrated Solutions
- 9.1.2. Hardware
- 9.2. Market Analysis, Insights and Forecast - by Sector
- 9.2.1. Power Generation
- 9.2.2. Transmission and Distribution (T&D)
- 9.2.3. Energy Storage
- 9.2.4. Energy Trading
- 9.1. Market Analysis, Insights and Forecast - by Technology
- 10. Middle East Digital Power Generation Market Analysis, Insights and Forecast, 2019-2031
- 10.1. Market Analysis, Insights and Forecast - by Technology
- 10.1.1. Integrated Solutions
- 10.1.2. Hardware
- 10.2. Market Analysis, Insights and Forecast - by Sector
- 10.2.1. Power Generation
- 10.2.2. Transmission and Distribution (T&D)
- 10.2.3. Energy Storage
- 10.2.4. Energy Trading
- 10.1. Market Analysis, Insights and Forecast - by Technology
- 11. North America Digital Power Generation Market Analysis, Insights and Forecast, 2019-2031
- 11.1. Market Analysis, Insights and Forecast - By Country/Sub-region
- 11.1.1 United States
- 11.1.2 Canada
- 11.1.3 Mexico
- 12. Europe Digital Power Generation Market Analysis, Insights and Forecast, 2019-2031
- 12.1. Market Analysis, Insights and Forecast - By Country/Sub-region
- 12.1.1 Germany
- 12.1.2 United Kingdom
- 12.1.3 France
- 12.1.4 Spain
- 12.1.5 Italy
- 12.1.6 Spain
- 12.1.7 Belgium
- 12.1.8 Netherland
- 12.1.9 Nordics
- 12.1.10 Rest of Europe
- 13. Asia Pacific Digital Power Generation Market Analysis, Insights and Forecast, 2019-2031
- 13.1. Market Analysis, Insights and Forecast - By Country/Sub-region
- 13.1.1 China
- 13.1.2 Japan
- 13.1.3 India
- 13.1.4 South Korea
- 13.1.5 Southeast Asia
- 13.1.6 Australia
- 13.1.7 Indonesia
- 13.1.8 Phillipes
- 13.1.9 Singapore
- 13.1.10 Thailandc
- 13.1.11 Rest of Asia Pacific
- 14. South America Digital Power Generation Market Analysis, Insights and Forecast, 2019-2031
- 14.1. Market Analysis, Insights and Forecast - By Country/Sub-region
- 14.1.1 Brazil
- 14.1.2 Argentina
- 14.1.3 Peru
- 14.1.4 Chile
- 14.1.5 Colombia
- 14.1.6 Ecuador
- 14.1.7 Venezuela
- 14.1.8 Rest of South America
- 15. North America Digital Power Generation Market Analysis, Insights and Forecast, 2019-2031
- 15.1. Market Analysis, Insights and Forecast - By Country/Sub-region
- 15.1.1 United States
- 15.1.2 Canada
- 15.1.3 Mexico
- 16. MEA Digital Power Generation Market Analysis, Insights and Forecast, 2019-2031
- 16.1. Market Analysis, Insights and Forecast - By Country/Sub-region
- 16.1.1 United Arab Emirates
- 16.1.2 Saudi Arabia
- 16.1.3 South Africa
- 16.1.4 Rest of Middle East and Africa
- 17. Competitive Analysis
- 17.1. Global Market Share Analysis 2024
- 17.2. Company Profiles
- 17.2.1 ABB Ltd
- 17.2.1.1. Overview
- 17.2.1.2. Products
- 17.2.1.3. SWOT Analysis
- 17.2.1.4. Recent Developments
- 17.2.1.5. Financials (Based on Availability)
- 17.2.2 Wipro Limited
- 17.2.2.1. Overview
- 17.2.2.2. Products
- 17.2.2.3. SWOT Analysis
- 17.2.2.4. Recent Developments
- 17.2.2.5. Financials (Based on Availability)
- 17.2.3 Accenture PLC
- 17.2.3.1. Overview
- 17.2.3.2. Products
- 17.2.3.3. SWOT Analysis
- 17.2.3.4. Recent Developments
- 17.2.3.5. Financials (Based on Availability)
- 17.2.4 IBM Corporation
- 17.2.4.1. Overview
- 17.2.4.2. Products
- 17.2.4.3. SWOT Analysis
- 17.2.4.4. Recent Developments
- 17.2.4.5. Financials (Based on Availability)
- 17.2.5 Capgemini SE
- 17.2.5.1. Overview
- 17.2.5.2. Products
- 17.2.5.3. SWOT Analysis
- 17.2.5.4. Recent Developments
- 17.2.5.5. Financials (Based on Availability)
- 17.2.6 Siemens AG
- 17.2.6.1. Overview
- 17.2.6.2. Products
- 17.2.6.3. SWOT Analysis
- 17.2.6.4. Recent Developments
- 17.2.6.5. Financials (Based on Availability)
- 17.2.7 Infosys Limited
- 17.2.7.1. Overview
- 17.2.7.2. Products
- 17.2.7.3. SWOT Analysis
- 17.2.7.4. Recent Developments
- 17.2.7.5. Financials (Based on Availability)
- 17.2.8 Microsoft Corporation
- 17.2.8.1. Overview
- 17.2.8.2. Products
- 17.2.8.3. SWOT Analysis
- 17.2.8.4. Recent Developments
- 17.2.8.5. Financials (Based on Availability)
- 17.2.9 General Electric Company
- 17.2.9.1. Overview
- 17.2.9.2. Products
- 17.2.9.3. SWOT Analysis
- 17.2.9.4. Recent Developments
- 17.2.9.5. Financials (Based on Availability)
- 17.2.10 SAP SE
- 17.2.10.1. Overview
- 17.2.10.2. Products
- 17.2.10.3. SWOT Analysis
- 17.2.10.4. Recent Developments
- 17.2.10.5. Financials (Based on Availability)
- 17.2.1 ABB Ltd
List of Figures
- Figure 1: Global Digital Power Generation Market Revenue Breakdown (Million, %) by Region 2024 & 2032
- Figure 2: North America Digital Power Generation Market Revenue (Million), by Country 2024 & 2032
- Figure 3: North America Digital Power Generation Market Revenue Share (%), by Country 2024 & 2032
- Figure 4: Europe Digital Power Generation Market Revenue (Million), by Country 2024 & 2032
- Figure 5: Europe Digital Power Generation Market Revenue Share (%), by Country 2024 & 2032
- Figure 6: Asia Pacific Digital Power Generation Market Revenue (Million), by Country 2024 & 2032
- Figure 7: Asia Pacific Digital Power Generation Market Revenue Share (%), by Country 2024 & 2032
- Figure 8: South America Digital Power Generation Market Revenue (Million), by Country 2024 & 2032
- Figure 9: South America Digital Power Generation Market Revenue Share (%), by Country 2024 & 2032
- Figure 10: North America Digital Power Generation Market Revenue (Million), by Country 2024 & 2032
- Figure 11: North America Digital Power Generation Market Revenue Share (%), by Country 2024 & 2032
- Figure 12: MEA Digital Power Generation Market Revenue (Million), by Country 2024 & 2032
- Figure 13: MEA Digital Power Generation Market Revenue Share (%), by Country 2024 & 2032
- Figure 14: North America Digital Power Generation Market Revenue (Million), by Technology 2024 & 2032
- Figure 15: North America Digital Power Generation Market Revenue Share (%), by Technology 2024 & 2032
- Figure 16: North America Digital Power Generation Market Revenue (Million), by Sector 2024 & 2032
- Figure 17: North America Digital Power Generation Market Revenue Share (%), by Sector 2024 & 2032
- Figure 18: North America Digital Power Generation Market Revenue (Million), by Country 2024 & 2032
- Figure 19: North America Digital Power Generation Market Revenue Share (%), by Country 2024 & 2032
- Figure 20: Europe Digital Power Generation Market Revenue (Million), by Technology 2024 & 2032
- Figure 21: Europe Digital Power Generation Market Revenue Share (%), by Technology 2024 & 2032
- Figure 22: Europe Digital Power Generation Market Revenue (Million), by Sector 2024 & 2032
- Figure 23: Europe Digital Power Generation Market Revenue Share (%), by Sector 2024 & 2032
- Figure 24: Europe Digital Power Generation Market Revenue (Million), by Country 2024 & 2032
- Figure 25: Europe Digital Power Generation Market Revenue Share (%), by Country 2024 & 2032
- Figure 26: Asia Pacific Digital Power Generation Market Revenue (Million), by Technology 2024 & 2032
- Figure 27: Asia Pacific Digital Power Generation Market Revenue Share (%), by Technology 2024 & 2032
- Figure 28: Asia Pacific Digital Power Generation Market Revenue (Million), by Sector 2024 & 2032
- Figure 29: Asia Pacific Digital Power Generation Market Revenue Share (%), by Sector 2024 & 2032
- Figure 30: Asia Pacific Digital Power Generation Market Revenue (Million), by Country 2024 & 2032
- Figure 31: Asia Pacific Digital Power Generation Market Revenue Share (%), by Country 2024 & 2032
- Figure 32: South America Digital Power Generation Market Revenue (Million), by Technology 2024 & 2032
- Figure 33: South America Digital Power Generation Market Revenue Share (%), by Technology 2024 & 2032
- Figure 34: South America Digital Power Generation Market Revenue (Million), by Sector 2024 & 2032
- Figure 35: South America Digital Power Generation Market Revenue Share (%), by Sector 2024 & 2032
- Figure 36: South America Digital Power Generation Market Revenue (Million), by Country 2024 & 2032
- Figure 37: South America Digital Power Generation Market Revenue Share (%), by Country 2024 & 2032
- Figure 38: Middle East Digital Power Generation Market Revenue (Million), by Technology 2024 & 2032
- Figure 39: Middle East Digital Power Generation Market Revenue Share (%), by Technology 2024 & 2032
- Figure 40: Middle East Digital Power Generation Market Revenue (Million), by Sector 2024 & 2032
- Figure 41: Middle East Digital Power Generation Market Revenue Share (%), by Sector 2024 & 2032
- Figure 42: Middle East Digital Power Generation Market Revenue (Million), by Country 2024 & 2032
- Figure 43: Middle East Digital Power Generation Market Revenue Share (%), by Country 2024 & 2032
List of Tables
- Table 1: Global Digital Power Generation Market Revenue Million Forecast, by Region 2019 & 2032
- Table 2: Global Digital Power Generation Market Revenue Million Forecast, by Technology 2019 & 2032
- Table 3: Global Digital Power Generation Market Revenue Million Forecast, by Sector 2019 & 2032
- Table 4: Global Digital Power Generation Market Revenue Million Forecast, by Region 2019 & 2032
- Table 5: Global Digital Power Generation Market Revenue Million Forecast, by Country 2019 & 2032
- Table 6: United States Digital Power Generation Market Revenue (Million) Forecast, by Application 2019 & 2032
- Table 7: Canada Digital Power Generation Market Revenue (Million) Forecast, by Application 2019 & 2032
- Table 8: Mexico Digital Power Generation Market Revenue (Million) Forecast, by Application 2019 & 2032
- Table 9: Global Digital Power Generation Market Revenue Million Forecast, by Country 2019 & 2032
- Table 10: Germany Digital Power Generation Market Revenue (Million) Forecast, by Application 2019 & 2032
- Table 11: United Kingdom Digital Power Generation Market Revenue (Million) Forecast, by Application 2019 & 2032
- Table 12: France Digital Power Generation Market Revenue (Million) Forecast, by Application 2019 & 2032
- Table 13: Spain Digital Power Generation Market Revenue (Million) Forecast, by Application 2019 & 2032
- Table 14: Italy Digital Power Generation Market Revenue (Million) Forecast, by Application 2019 & 2032
- Table 15: Spain Digital Power Generation Market Revenue (Million) Forecast, by Application 2019 & 2032
- Table 16: Belgium Digital Power Generation Market Revenue (Million) Forecast, by Application 2019 & 2032
- Table 17: Netherland Digital Power Generation Market Revenue (Million) Forecast, by Application 2019 & 2032
- Table 18: Nordics Digital Power Generation Market Revenue (Million) Forecast, by Application 2019 & 2032
- Table 19: Rest of Europe Digital Power Generation Market Revenue (Million) Forecast, by Application 2019 & 2032
- Table 20: Global Digital Power Generation Market Revenue Million Forecast, by Country 2019 & 2032
- Table 21: China Digital Power Generation Market Revenue (Million) Forecast, by Application 2019 & 2032
- Table 22: Japan Digital Power Generation Market Revenue (Million) Forecast, by Application 2019 & 2032
- Table 23: India Digital Power Generation Market Revenue (Million) Forecast, by Application 2019 & 2032
- Table 24: South Korea Digital Power Generation Market Revenue (Million) Forecast, by Application 2019 & 2032
- Table 25: Southeast Asia Digital Power Generation Market Revenue (Million) Forecast, by Application 2019 & 2032
- Table 26: Australia Digital Power Generation Market Revenue (Million) Forecast, by Application 2019 & 2032
- Table 27: Indonesia Digital Power Generation Market Revenue (Million) Forecast, by Application 2019 & 2032
- Table 28: Phillipes Digital Power Generation Market Revenue (Million) Forecast, by Application 2019 & 2032
- Table 29: Singapore Digital Power Generation Market Revenue (Million) Forecast, by Application 2019 & 2032
- Table 30: Thailandc Digital Power Generation Market Revenue (Million) Forecast, by Application 2019 & 2032
- Table 31: Rest of Asia Pacific Digital Power Generation Market Revenue (Million) Forecast, by Application 2019 & 2032
- Table 32: Global Digital Power Generation Market Revenue Million Forecast, by Country 2019 & 2032
- Table 33: Brazil Digital Power Generation Market Revenue (Million) Forecast, by Application 2019 & 2032
- Table 34: Argentina Digital Power Generation Market Revenue (Million) Forecast, by Application 2019 & 2032
- Table 35: Peru Digital Power Generation Market Revenue (Million) Forecast, by Application 2019 & 2032
- Table 36: Chile Digital Power Generation Market Revenue (Million) Forecast, by Application 2019 & 2032
- Table 37: Colombia Digital Power Generation Market Revenue (Million) Forecast, by Application 2019 & 2032
- Table 38: Ecuador Digital Power Generation Market Revenue (Million) Forecast, by Application 2019 & 2032
- Table 39: Venezuela Digital Power Generation Market Revenue (Million) Forecast, by Application 2019 & 2032
- Table 40: Rest of South America Digital Power Generation Market Revenue (Million) Forecast, by Application 2019 & 2032
- Table 41: Global Digital Power Generation Market Revenue Million Forecast, by Country 2019 & 2032
- Table 42: United States Digital Power Generation Market Revenue (Million) Forecast, by Application 2019 & 2032
- Table 43: Canada Digital Power Generation Market Revenue (Million) Forecast, by Application 2019 & 2032
- Table 44: Mexico Digital Power Generation Market Revenue (Million) Forecast, by Application 2019 & 2032
- Table 45: Global Digital Power Generation Market Revenue Million Forecast, by Country 2019 & 2032
- Table 46: United Arab Emirates Digital Power Generation Market Revenue (Million) Forecast, by Application 2019 & 2032
- Table 47: Saudi Arabia Digital Power Generation Market Revenue (Million) Forecast, by Application 2019 & 2032
- Table 48: South Africa Digital Power Generation Market Revenue (Million) Forecast, by Application 2019 & 2032
- Table 49: Rest of Middle East and Africa Digital Power Generation Market Revenue (Million) Forecast, by Application 2019 & 2032
- Table 50: Global Digital Power Generation Market Revenue Million Forecast, by Technology 2019 & 2032
- Table 51: Global Digital Power Generation Market Revenue Million Forecast, by Sector 2019 & 2032
- Table 52: Global Digital Power Generation Market Revenue Million Forecast, by Country 2019 & 2032
- Table 53: Global Digital Power Generation Market Revenue Million Forecast, by Technology 2019 & 2032
- Table 54: Global Digital Power Generation Market Revenue Million Forecast, by Sector 2019 & 2032
- Table 55: Global Digital Power Generation Market Revenue Million Forecast, by Country 2019 & 2032
- Table 56: Global Digital Power Generation Market Revenue Million Forecast, by Technology 2019 & 2032
- Table 57: Global Digital Power Generation Market Revenue Million Forecast, by Sector 2019 & 2032
- Table 58: Global Digital Power Generation Market Revenue Million Forecast, by Country 2019 & 2032
- Table 59: Global Digital Power Generation Market Revenue Million Forecast, by Technology 2019 & 2032
- Table 60: Global Digital Power Generation Market Revenue Million Forecast, by Sector 2019 & 2032
- Table 61: Global Digital Power Generation Market Revenue Million Forecast, by Country 2019 & 2032
- Table 62: Global Digital Power Generation Market Revenue Million Forecast, by Technology 2019 & 2032
- Table 63: Global Digital Power Generation Market Revenue Million Forecast, by Sector 2019 & 2032
- Table 64: Global Digital Power Generation Market Revenue Million Forecast, by Country 2019 & 2032
Frequently Asked Questions
1. What is the projected Compound Annual Growth Rate (CAGR) of the Digital Power Generation Market?
The projected CAGR is approximately > 5.80%.
2. Which companies are prominent players in the Digital Power Generation Market?
Key companies in the market include ABB Ltd, Wipro Limited, Accenture PLC, IBM Corporation, Capgemini SE, Siemens AG, Infosys Limited, Microsoft Corporation, General Electric Company, SAP SE.
3. What are the main segments of the Digital Power Generation Market?
The market segments include Technology, Sector.
4. Can you provide details about the market size?
The market size is estimated to be USD XX Million as of 2022.
5. What are some drivers contributing to market growth?
4.; Supportive Government Policies and Incentives4.; Environmental Concerns.
6. What are the notable trends driving market growth?
Power Generation Segment to Witness Significant Growth.
7. Are there any restraints impacting market growth?
4.; Fossil Fuel Subsidies.
8. Can you provide examples of recent developments in the market?
In March 2021, ABB reached the cumulative 5-gigawatt (GW) mark in providing Programmable Logic Controller-based (PLC) solar plant automation solutions in India.
9. What pricing options are available for accessing the report?
Pricing options include single-user, multi-user, and enterprise licenses priced at USD 4750, USD 5250, and USD 8750 respectively.
10. Is the market size provided in terms of value or volume?
The market size is provided in terms of value, measured in Million.
11. Are there any specific market keywords associated with the report?
Yes, the market keyword associated with the report is "Digital Power Generation Market," which aids in identifying and referencing the specific market segment covered.
12. How do I determine which pricing option suits my needs best?
The pricing options vary based on user requirements and access needs. Individual users may opt for single-user licenses, while businesses requiring broader access may choose multi-user or enterprise licenses for cost-effective access to the report.
13. Are there any additional resources or data provided in the Digital Power Generation Market report?
While the report offers comprehensive insights, it's advisable to review the specific contents or supplementary materials provided to ascertain if additional resources or data are available.
14. How can I stay updated on further developments or reports in the Digital Power Generation Market?
To stay informed about further developments, trends, and reports in the Digital Power Generation Market, consider subscribing to industry newsletters, following relevant companies and organizations, or regularly checking reputable industry news sources and publications.
Methodology
Step 1 - Identification of Relevant Samples Size from Population Database


Step 2 - Approaches for Defining Global Market Size (Value, Volume* & Price*)

Note*: In applicable scenarios
Step 3 - Data Sources
Primary Research
- Web Analytics
- Survey Reports
- Research Institute
- Latest Research Reports
- Opinion Leaders
Secondary Research
- Annual Reports
- White Paper
- Latest Press Release
- Industry Association
- Paid Database
- Investor Presentations

Step 4 - Data Triangulation
Involves using different sources of information in order to increase the validity of a study
These sources are likely to be stakeholders in a program - participants, other researchers, program staff, other community members, and so on.
Then we put all data in single framework & apply various statistical tools to find out the dynamic on the market.
During the analysis stage, feedback from the stakeholder groups would be compared to determine areas of agreement as well as areas of divergence


