


Key Insights
The global Artificial Lift Systems market is projected for significant expansion, with a projected Compound Annual Growth Rate (CAGR) of 5.1%. Building upon a base year of 2025, the market is anticipated to reach a valuation of 7.65 billion by 2033. This robust growth is fueled by the escalating demand for enhanced oil and gas recovery (EOR) techniques, particularly in mature fields requiring sophisticated artificial lift solutions. Technological advancements, including the integration of advanced analytics and automation in Electric Submersible Pump (ESP) and Progressive Cavity Pump (PCP) systems, are driving operational efficiency and minimizing downtime. The increasing adoption of smart well technologies and a heightened focus on environmental sustainability are fostering opportunities for innovative artificial lift software that optimizes energy consumption and reduces environmental impact. The market is segmented by key technologies: ESP systems, favored for their versatility; PCP systems, ideal for high-viscosity fluids; Rod Lift systems, a proven traditional method; and 'Others' encompassing emerging solutions. Leading companies such as Baker Hughes, Halliburton, Schlumberger, and Weatherford are at the forefront of developing and deploying cutting-edge systems and software, stimulating market competition and innovation. Geographically, North America and the Asia-Pacific region are leading market expansion due to substantial exploration and production activities.
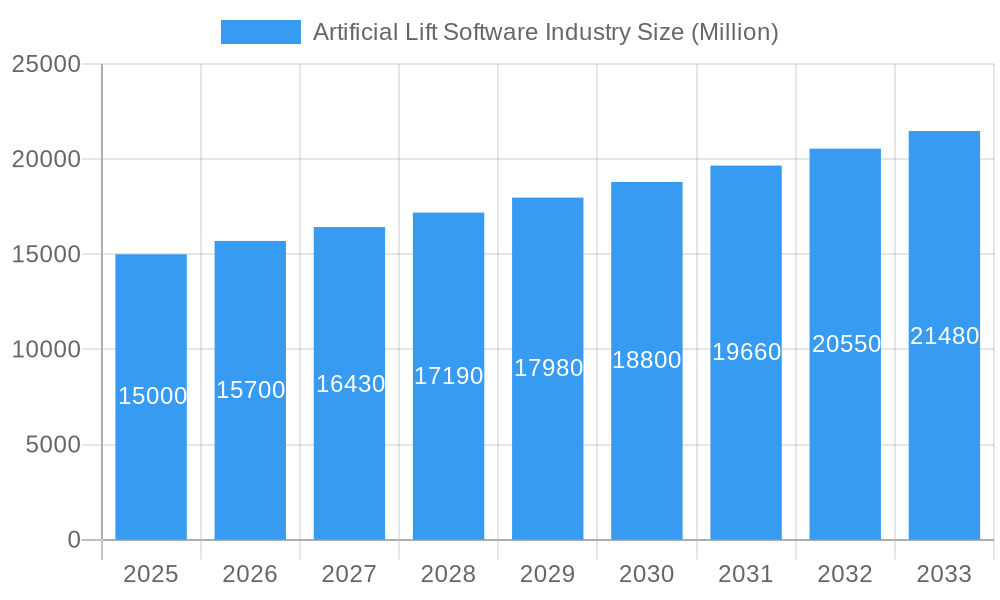
Artificial Lift Software Industry Market Size (In Billion)

Market growth is tempered by the substantial initial investment required for advanced artificial lift systems, particularly for smaller operators, and by fluctuations in oil and gas prices influencing investment decisions. However, the long-term benefits of cost savings and improved production efficiency are expected to outweigh these initial challenges. The ongoing digitalization trend in the oil and gas sector presents significant opportunities for integrating advanced analytics and predictive maintenance into artificial lift software, leading to more efficient and cost-effective operations. Industry consolidation is anticipated as key players aim to expand market share and technological capabilities. Future developments will likely see greater integration of artificial lift systems within comprehensive digital oilfield solutions for holistic production optimization.
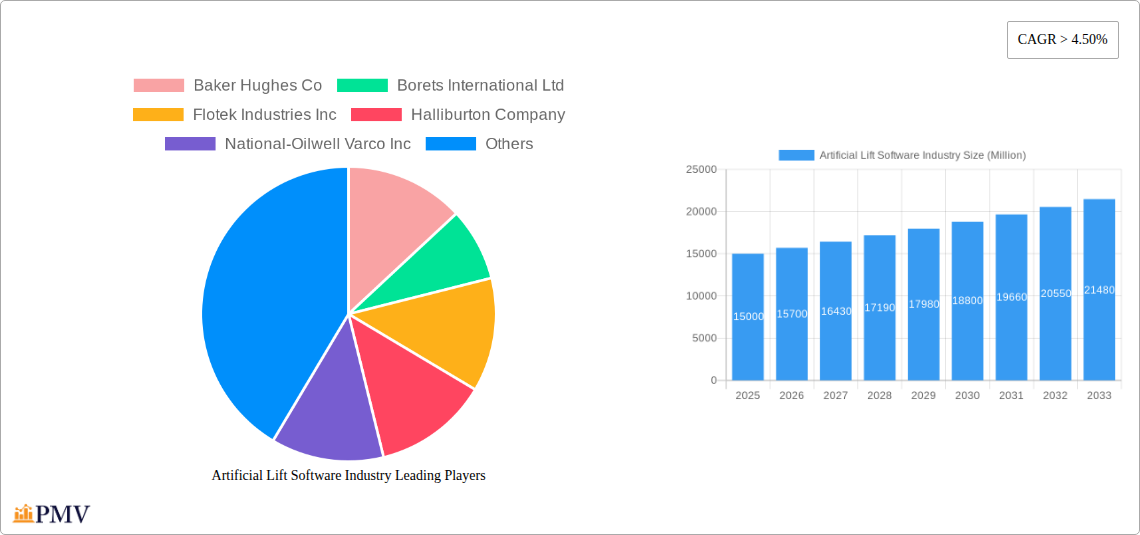
Artificial Lift Software Industry Company Market Share
This report offers a detailed analysis of the Artificial Lift Software market, providing critical insights for industry stakeholders, investors, and researchers. Covering the period from 2019 to 2033, with 2025 as the base year, this study examines market size, growth drivers, competitive landscape, and emerging trends within this vital segment of the oil and gas industry. The analysis incorporates historical data from 2019-2024 and projects future market values in billions.
Artificial Lift Software Industry Market Structure & Competitive Dynamics
The Artificial Lift Software market exhibits a moderately concentrated structure, with several major players dominating the landscape. Key companies include Baker Hughes Co, Borets International Ltd, Flotek Industries Inc, Halliburton Company, National-Oilwell Varco Inc, Alkhorayef Commercial Co, Weatherford International Ltd, Schlumberger Limited, and Dover Corp. However, the market also features several smaller, specialized providers fostering a dynamic competitive environment.
Market concentration is influenced by factors such as technological advancements, mergers and acquisitions (M&A) activities, and regulatory frameworks. While precise market share figures for individual companies are proprietary, we estimate that the top five players collectively hold approximately xx% of the global market share in 2025. M&A activity has played a significant role in shaping the competitive landscape. The total value of M&A deals in the Artificial Lift Software sector during the period 2019-2024 is estimated to be approximately $xx Million.
Innovation ecosystems are crucial, with continuous development of new software features and integration with other technologies driving competition and product differentiation. Regulatory compliance, particularly concerning data security and environmental regulations, influences market dynamics. The presence of substitute technologies (e.g., alternative artificial lift methods) also impacts market growth. Finally, end-user trends, including a growing preference for cloud-based solutions and data analytics, shape the demand for sophisticated artificial lift software.
Artificial Lift Software Industry Industry Trends & Insights
The Artificial Lift Software market is experiencing robust growth, driven by increasing demand for enhanced oil and gas recovery techniques, the adoption of digitalization in the energy sector, and the need for improved operational efficiency. The Compound Annual Growth Rate (CAGR) for the forecast period (2025-2033) is projected to be approximately xx%, indicating significant market expansion.
Technological disruptions, particularly advancements in artificial intelligence (AI), machine learning (ML), and cloud computing, are significantly impacting the market. The integration of these technologies enhances predictive capabilities, optimizes production processes, and reduces operational costs. Consumer preferences increasingly favor integrated software solutions that offer comprehensive data analysis and visualization, simplifying decision-making for oil and gas operators. The market penetration of advanced analytics tools is steadily growing, with an estimated xx% of oil and gas operators adopting such solutions by 2033. Competitive dynamics are characterized by ongoing innovation, strategic partnerships, and the expansion of software offerings by major players.
Dominant Markets & Segments in Artificial Lift Software Industry
The North American region currently holds the dominant position in the Artificial Lift Software market, driven by significant oil and gas production activities and substantial investments in technological advancements. However, the Middle East and Asia-Pacific regions are witnessing significant growth due to increasing exploration and production activities.
- Key Drivers of North American Dominance:
- Robust oil and gas production infrastructure
- Early adoption of digital technologies in the energy sector
- Favorable regulatory environment
- Presence of key industry players
Among the various types of artificial lift systems, the Electric Submersible Pump (ESP) system segment represents the largest share of the market due to its widespread use and versatility.
- Electric Submersible Pump System: High market share due to its reliability and adaptability to various well conditions. Growth is driven by continuous technological advancements in pump design and control systems.
- Progressive Cavity Pump System: This segment holds a moderate market share, favored for its suitability in handling viscous fluids and high-solids content. Growth is primarily driven by applications in heavy oil and unconventional resource production.
- Rod Lift System: This segment's market share is relatively smaller, largely due to its limitations in terms of depth and fluid viscosity. However, technological improvements aimed at enhancing efficiency are fostering moderate growth.
- Others: This segment encompasses various other types of artificial lift systems, each with specific applications and market niches. This segment shows promising growth potential given continued innovation in less-mainstream solutions.
Artificial Lift Software Industry Product Innovations
The Artificial Lift Software market witnesses continuous innovation, with new software features and functionalities emerging regularly. Key trends include the integration of AI/ML for predictive maintenance, advanced analytics for optimizing production, and cloud-based deployment for improved accessibility and scalability. These innovations enhance the efficiency, reliability, and cost-effectiveness of artificial lift operations, providing competitive advantages to providers and substantial benefits to oil and gas operators.
Report Segmentation & Scope
The report segments the Artificial Lift Software market primarily by type of artificial lift system: Electric Submersible Pump System, Progressive Cavity Pump System, Rod Lift System, and Others. Each segment is analyzed based on its market size, growth projections, and competitive dynamics. Detailed regional analysis and country-specific insights further enhance the report's scope. The market segmentation provides a granular view of the market enabling better understanding of industry developments.
The Electric Submersible Pump System segment is anticipated to exhibit the highest growth during the forecast period. The Progressive Cavity Pump System segment is projected to witness steady growth, driven by its adaptability in handling varied fluids. The Rod Lift System segment's growth will be moderate, limited by its technological constraints. The 'Others' segment includes emerging technologies and thus has significant growth potential.
Key Drivers of Artificial Lift Software Growth
Several factors contribute to the growth of the Artificial Lift Software market. Technological advancements, such as AI and ML integration, enhance efficiency and optimize operations. Increased demand for enhanced oil recovery techniques necessitates the use of sophisticated software solutions. Furthermore, stringent regulatory requirements for environmental protection and safety standards drive the adoption of advanced monitoring and control systems. Economic factors, including fluctuations in oil and gas prices, also influence market growth.
Challenges in the Artificial Lift Software Industry Sector
The Artificial Lift Software market faces certain challenges, including the high initial investment costs associated with software implementation and integration. Cybersecurity risks and data protection concerns pose significant hurdles. Competition from established players and emerging technologies adds to the complexity. Supply chain disruptions and the availability of skilled personnel can also impact market growth. The overall impact of these challenges is estimated to reduce the annual market growth by approximately xx% during the forecast period.
Leading Players in the Artificial Lift Software Industry Market
- Baker Hughes Co
- Borets International Ltd
- Flotek Industries Inc
- Halliburton Company
- National-Oilwell Varco Inc
- Alkhorayef Commercial Co
- Weatherford International Ltd
- Schlumberger Limited
- Dover Corp
Key Developments in Artificial Lift Software Industry Sector
- February 2022: Upwing's Magnetic Drive System (MDS) launch improves reliability and simplifies deployment.
- August 2021: ChampionX Technologies launched XSPOC production optimization software for enhanced well efficiencies.
- April 2021: Microsoft Azure enabled deployment of Ambyint's artificial lift optimization applications. These developments highlight the ongoing innovation and market expansion within the Artificial Lift Software sector.
Strategic Artificial Lift Software Industry Market Outlook
The Artificial Lift Software market presents significant growth potential driven by sustained investment in digitalization within the oil and gas industry. Strategic opportunities lie in developing advanced analytics capabilities, integrating AI/ML for enhanced predictive maintenance, and exploring partnerships to expand market reach. The market is poised for continued expansion, fueled by the ongoing demand for improved efficiency, reduced operational costs, and enhanced production optimization in the oil and gas sector. The forecast indicates a market value exceeding $xx Million by 2033.
Artificial Lift Software Industry Segmentation
-
1. Type
- 1.1. Electric Submersible Pump System
- 1.2. Progressive Cavity Pump System
- 1.3. Rod Lift System
- 1.4. Others
Artificial Lift Software Industry Segmentation By Geography
- 1. North America
- 2. Asia Pacific
- 3. Europe
- 4. South America
- 5. Middle East and Africa
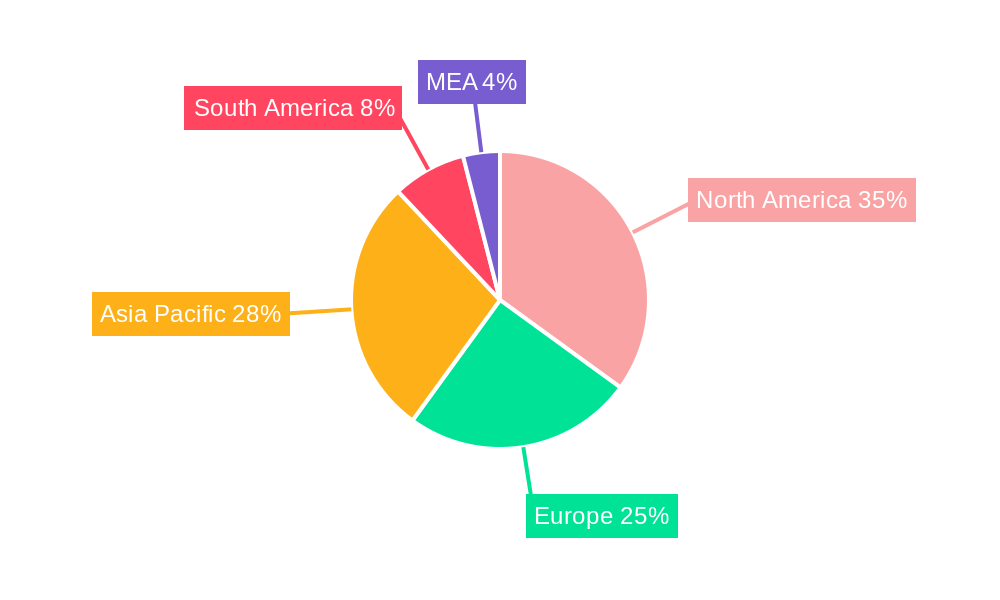
Artificial Lift Software Industry Regional Market Share
Geographic Coverage of Artificial Lift Software Industry
Artificial Lift Software Industry REPORT HIGHLIGHTS
| Aspects | Details |
|---|---|
| Study Period | 2020-2034 |
| Base Year | 2025 |
| Estimated Year | 2026 |
| Forecast Period | 2026-2034 |
| Historical Period | 2020-2025 |
| Growth Rate | CAGR of 5.1% from 2020-2034 |
| Segmentation |
|
Table of Contents
- 1. Introduction
- 1.1. Research Scope
- 1.2. Market Segmentation
- 1.3. Research Methodology
- 1.4. Definitions and Assumptions
- 2. Executive Summary
- 2.1. Introduction
- 3. Market Dynamics
- 3.1. Introduction
- 3.2. Market Drivers
- 3.2.1. 4.; Government Initiatives and Increasing Private Investments
- 3.3. Market Restrains
- 3.3.1. 4.; Declining Lithium-ion Battery Prices
- 3.4. Market Trends
- 3.4.1. Electric Submersible Pump (ESP) System to Dominate the Market
- 4. Market Factor Analysis
- 4.1. Porters Five Forces
- 4.2. Supply/Value Chain
- 4.3. PESTEL analysis
- 4.4. Market Entropy
- 4.5. Patent/Trademark Analysis
- 5. Global Artificial Lift Software Industry Analysis, Insights and Forecast, 2020-2032
- 5.1. Market Analysis, Insights and Forecast - by Type
- 5.1.1. Electric Submersible Pump System
- 5.1.2. Progressive Cavity Pump System
- 5.1.3. Rod Lift System
- 5.1.4. Others
- 5.2. Market Analysis, Insights and Forecast - by Region
- 5.2.1. North America
- 5.2.2. Asia Pacific
- 5.2.3. Europe
- 5.2.4. South America
- 5.2.5. Middle East and Africa
- 5.1. Market Analysis, Insights and Forecast - by Type
- 6. North America Artificial Lift Software Industry Analysis, Insights and Forecast, 2020-2032
- 6.1. Market Analysis, Insights and Forecast - by Type
- 6.1.1. Electric Submersible Pump System
- 6.1.2. Progressive Cavity Pump System
- 6.1.3. Rod Lift System
- 6.1.4. Others
- 6.1. Market Analysis, Insights and Forecast - by Type
- 7. Asia Pacific Artificial Lift Software Industry Analysis, Insights and Forecast, 2020-2032
- 7.1. Market Analysis, Insights and Forecast - by Type
- 7.1.1. Electric Submersible Pump System
- 7.1.2. Progressive Cavity Pump System
- 7.1.3. Rod Lift System
- 7.1.4. Others
- 7.1. Market Analysis, Insights and Forecast - by Type
- 8. Europe Artificial Lift Software Industry Analysis, Insights and Forecast, 2020-2032
- 8.1. Market Analysis, Insights and Forecast - by Type
- 8.1.1. Electric Submersible Pump System
- 8.1.2. Progressive Cavity Pump System
- 8.1.3. Rod Lift System
- 8.1.4. Others
- 8.1. Market Analysis, Insights and Forecast - by Type
- 9. South America Artificial Lift Software Industry Analysis, Insights and Forecast, 2020-2032
- 9.1. Market Analysis, Insights and Forecast - by Type
- 9.1.1. Electric Submersible Pump System
- 9.1.2. Progressive Cavity Pump System
- 9.1.3. Rod Lift System
- 9.1.4. Others
- 9.1. Market Analysis, Insights and Forecast - by Type
- 10. Middle East and Africa Artificial Lift Software Industry Analysis, Insights and Forecast, 2020-2032
- 10.1. Market Analysis, Insights and Forecast - by Type
- 10.1.1. Electric Submersible Pump System
- 10.1.2. Progressive Cavity Pump System
- 10.1.3. Rod Lift System
- 10.1.4. Others
- 10.1. Market Analysis, Insights and Forecast - by Type
- 11. Competitive Analysis
- 11.1. Global Market Share Analysis 2025
- 11.2. Company Profiles
- 11.2.1 Baker Hughes Co
- 11.2.1.1. Overview
- 11.2.1.2. Products
- 11.2.1.3. SWOT Analysis
- 11.2.1.4. Recent Developments
- 11.2.1.5. Financials (Based on Availability)
- 11.2.2 Borets International Ltd
- 11.2.2.1. Overview
- 11.2.2.2. Products
- 11.2.2.3. SWOT Analysis
- 11.2.2.4. Recent Developments
- 11.2.2.5. Financials (Based on Availability)
- 11.2.3 Flotek Industries Inc
- 11.2.3.1. Overview
- 11.2.3.2. Products
- 11.2.3.3. SWOT Analysis
- 11.2.3.4. Recent Developments
- 11.2.3.5. Financials (Based on Availability)
- 11.2.4 Halliburton Company
- 11.2.4.1. Overview
- 11.2.4.2. Products
- 11.2.4.3. SWOT Analysis
- 11.2.4.4. Recent Developments
- 11.2.4.5. Financials (Based on Availability)
- 11.2.5 National-Oilwell Varco Inc
- 11.2.5.1. Overview
- 11.2.5.2. Products
- 11.2.5.3. SWOT Analysis
- 11.2.5.4. Recent Developments
- 11.2.5.5. Financials (Based on Availability)
- 11.2.6 Alkhorayef Commercial Co*List Not Exhaustive
- 11.2.6.1. Overview
- 11.2.6.2. Products
- 11.2.6.3. SWOT Analysis
- 11.2.6.4. Recent Developments
- 11.2.6.5. Financials (Based on Availability)
- 11.2.7 Weatherford International Ltd
- 11.2.7.1. Overview
- 11.2.7.2. Products
- 11.2.7.3. SWOT Analysis
- 11.2.7.4. Recent Developments
- 11.2.7.5. Financials (Based on Availability)
- 11.2.8 Schlumberger Limited
- 11.2.8.1. Overview
- 11.2.8.2. Products
- 11.2.8.3. SWOT Analysis
- 11.2.8.4. Recent Developments
- 11.2.8.5. Financials (Based on Availability)
- 11.2.9 Dover Corp
- 11.2.9.1. Overview
- 11.2.9.2. Products
- 11.2.9.3. SWOT Analysis
- 11.2.9.4. Recent Developments
- 11.2.9.5. Financials (Based on Availability)
- 11.2.1 Baker Hughes Co
List of Figures
- Figure 1: Global Artificial Lift Software Industry Revenue Breakdown (billion, %) by Region 2025 & 2033
- Figure 2: North America Artificial Lift Software Industry Revenue (billion), by Type 2025 & 2033
- Figure 3: North America Artificial Lift Software Industry Revenue Share (%), by Type 2025 & 2033
- Figure 4: North America Artificial Lift Software Industry Revenue (billion), by Country 2025 & 2033
- Figure 5: North America Artificial Lift Software Industry Revenue Share (%), by Country 2025 & 2033
- Figure 6: Asia Pacific Artificial Lift Software Industry Revenue (billion), by Type 2025 & 2033
- Figure 7: Asia Pacific Artificial Lift Software Industry Revenue Share (%), by Type 2025 & 2033
- Figure 8: Asia Pacific Artificial Lift Software Industry Revenue (billion), by Country 2025 & 2033
- Figure 9: Asia Pacific Artificial Lift Software Industry Revenue Share (%), by Country 2025 & 2033
- Figure 10: Europe Artificial Lift Software Industry Revenue (billion), by Type 2025 & 2033
- Figure 11: Europe Artificial Lift Software Industry Revenue Share (%), by Type 2025 & 2033
- Figure 12: Europe Artificial Lift Software Industry Revenue (billion), by Country 2025 & 2033
- Figure 13: Europe Artificial Lift Software Industry Revenue Share (%), by Country 2025 & 2033
- Figure 14: South America Artificial Lift Software Industry Revenue (billion), by Type 2025 & 2033
- Figure 15: South America Artificial Lift Software Industry Revenue Share (%), by Type 2025 & 2033
- Figure 16: South America Artificial Lift Software Industry Revenue (billion), by Country 2025 & 2033
- Figure 17: South America Artificial Lift Software Industry Revenue Share (%), by Country 2025 & 2033
- Figure 18: Middle East and Africa Artificial Lift Software Industry Revenue (billion), by Type 2025 & 2033
- Figure 19: Middle East and Africa Artificial Lift Software Industry Revenue Share (%), by Type 2025 & 2033
- Figure 20: Middle East and Africa Artificial Lift Software Industry Revenue (billion), by Country 2025 & 2033
- Figure 21: Middle East and Africa Artificial Lift Software Industry Revenue Share (%), by Country 2025 & 2033
List of Tables
- Table 1: Global Artificial Lift Software Industry Revenue billion Forecast, by Type 2020 & 2033
- Table 2: Global Artificial Lift Software Industry Revenue billion Forecast, by Region 2020 & 2033
- Table 3: Global Artificial Lift Software Industry Revenue billion Forecast, by Type 2020 & 2033
- Table 4: Global Artificial Lift Software Industry Revenue billion Forecast, by Country 2020 & 2033
- Table 5: Global Artificial Lift Software Industry Revenue billion Forecast, by Type 2020 & 2033
- Table 6: Global Artificial Lift Software Industry Revenue billion Forecast, by Country 2020 & 2033
- Table 7: Global Artificial Lift Software Industry Revenue billion Forecast, by Type 2020 & 2033
- Table 8: Global Artificial Lift Software Industry Revenue billion Forecast, by Country 2020 & 2033
- Table 9: Global Artificial Lift Software Industry Revenue billion Forecast, by Type 2020 & 2033
- Table 10: Global Artificial Lift Software Industry Revenue billion Forecast, by Country 2020 & 2033
- Table 11: Global Artificial Lift Software Industry Revenue billion Forecast, by Type 2020 & 2033
- Table 12: Global Artificial Lift Software Industry Revenue billion Forecast, by Country 2020 & 2033
Frequently Asked Questions
1. What is the projected Compound Annual Growth Rate (CAGR) of the Artificial Lift Software Industry?
The projected CAGR is approximately 5.1%.
2. Which companies are prominent players in the Artificial Lift Software Industry?
Key companies in the market include Baker Hughes Co, Borets International Ltd, Flotek Industries Inc, Halliburton Company, National-Oilwell Varco Inc, Alkhorayef Commercial Co*List Not Exhaustive, Weatherford International Ltd, Schlumberger Limited, Dover Corp.
3. What are the main segments of the Artificial Lift Software Industry?
The market segments include Type.
4. Can you provide details about the market size?
The market size is estimated to be USD 7.65 billion as of 2022.
5. What are some drivers contributing to market growth?
4.; Government Initiatives and Increasing Private Investments.
6. What are the notable trends driving market growth?
Electric Submersible Pump (ESP) System to Dominate the Market.
7. Are there any restraints impacting market growth?
4.; Declining Lithium-ion Battery Prices.
8. Can you provide examples of recent developments in the market?
In February 2022, the Upwing Magnetic Drive System (MDS) hermetically isolates all the failure-prone electrical components from the harsh production fluids by placing them in the well's annulus as part of the permanent completion. It also simplifies deployment and intervention using a slickline for the system's mechanical string.
9. What pricing options are available for accessing the report?
Pricing options include single-user, multi-user, and enterprise licenses priced at USD 4750, USD 5250, and USD 8750 respectively.
10. Is the market size provided in terms of value or volume?
The market size is provided in terms of value, measured in billion.
11. Are there any specific market keywords associated with the report?
Yes, the market keyword associated with the report is "Artificial Lift Software Industry," which aids in identifying and referencing the specific market segment covered.
12. How do I determine which pricing option suits my needs best?
The pricing options vary based on user requirements and access needs. Individual users may opt for single-user licenses, while businesses requiring broader access may choose multi-user or enterprise licenses for cost-effective access to the report.
13. Are there any additional resources or data provided in the Artificial Lift Software Industry report?
While the report offers comprehensive insights, it's advisable to review the specific contents or supplementary materials provided to ascertain if additional resources or data are available.
14. How can I stay updated on further developments or reports in the Artificial Lift Software Industry?
To stay informed about further developments, trends, and reports in the Artificial Lift Software Industry, consider subscribing to industry newsletters, following relevant companies and organizations, or regularly checking reputable industry news sources and publications.
Methodology
Step 1 - Identification of Relevant Samples Size from Population Database


Step 2 - Approaches for Defining Global Market Size (Value, Volume* & Price*)

Note*: In applicable scenarios
Step 3 - Data Sources
Primary Research
- Web Analytics
- Survey Reports
- Research Institute
- Latest Research Reports
- Opinion Leaders
Secondary Research
- Annual Reports
- White Paper
- Latest Press Release
- Industry Association
- Paid Database
- Investor Presentations

Step 4 - Data Triangulation
Involves using different sources of information in order to increase the validity of a study
These sources are likely to be stakeholders in a program - participants, other researchers, program staff, other community members, and so on.
Then we put all data in single framework & apply various statistical tools to find out the dynamic on the market.
During the analysis stage, feedback from the stakeholder groups would be compared to determine areas of agreement as well as areas of divergence