

Key Insights
The global air starter market is projected to reach 416.18 million by 2025, driven by a Compound Annual Growth Rate (CAGR) of 4.75% between 2025 and 2033. This growth is underpinned by escalating demand for dependable starting solutions in the oil and gas sector, particularly for offshore and remote operations. The expanding power generation industry, requiring robust turbine and generator starting mechanisms, also significantly contributes to market expansion. Mining operations, reliant on heavy-duty equipment with reliable starting systems, further fuel this demand. Technological advancements, focusing on compact, lightweight, and fuel-efficient air starters, are positively influencing market dynamics. Key market segments include Vane Air Starters and Turbine Air Starters, with Oil & Gas, Power Generation, and Mining as dominant end-user industries. Geographically, North America, Europe, and Asia Pacific are pivotal regions, each presenting distinct growth patterns influenced by industrial development and infrastructure initiatives.
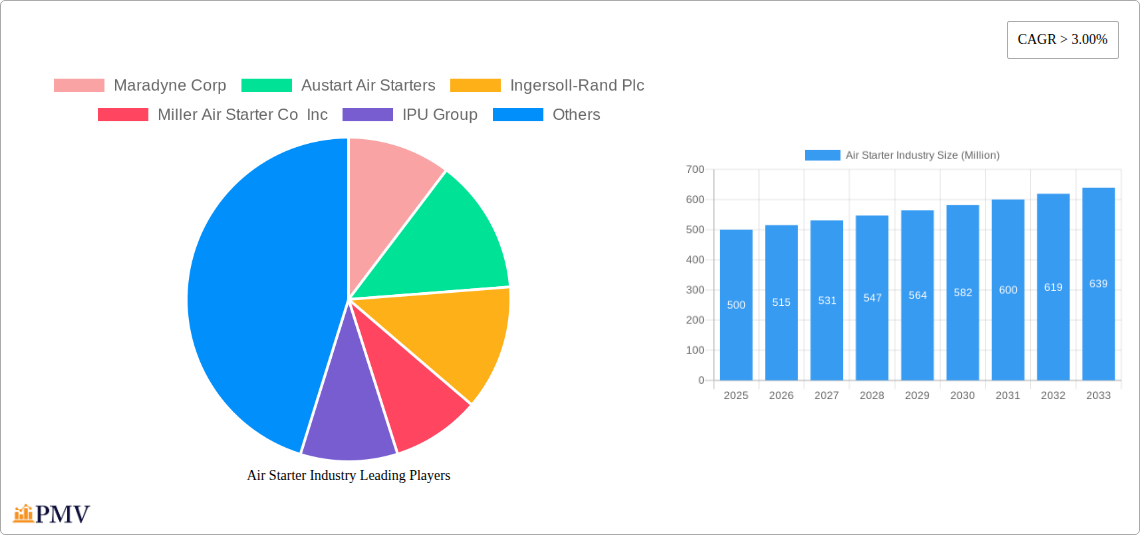
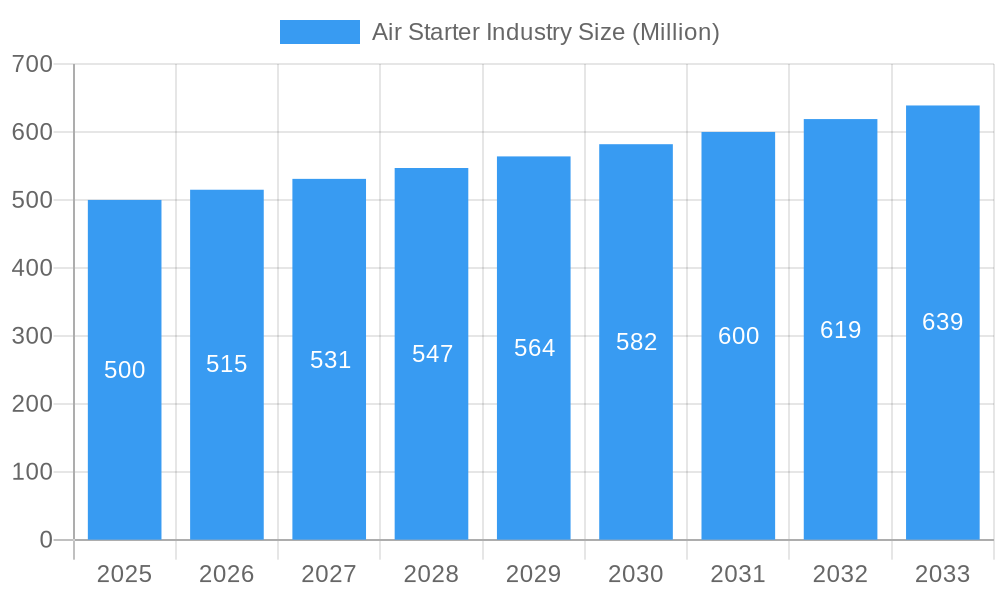
Air Starter Industry Market Size (In Million)
The competitive arena features established entities such as Ingersoll-Rand Plc and Maradyne Corp, alongside specialized manufacturers like Austart Air Starters and Miller Air Starter Co Inc. These companies are strategically focused on product innovation, collaborations, and global expansion. Potential market restraints include volatile raw material costs and stringent emission standards. The forecast period (2025-2033) anticipates sustained growth, propelled by increasing industrial activities worldwide, especially in emerging economies. Market evolution will likely be shaped by technological innovations, regulatory frameworks concerning emissions, and the broader global economic climate. Detailed regional segmentation, factoring in industry-specific growth, regulatory environments, and technology adoption rates, will offer deeper market insights.
Air Starter Industry Company Market Share
Air Starter Industry Market Report: 2019-2033
This comprehensive report provides an in-depth analysis of the global Air Starter industry, offering invaluable insights for businesses, investors, and stakeholders seeking to understand and navigate this dynamic market. The study period covers 2019-2033, with a base year of 2025 and a forecast period of 2025-2033. The report leverages extensive market research to deliver actionable intelligence, projecting a market valued at $XX Million in 2025, exhibiting a CAGR of XX% throughout the forecast period.
Air Starter Industry Market Structure & Competitive Dynamics
The global air starter market is characterized by a moderately concentrated structure, with key players such as Maradyne Corp, Austart Air Starters, Ingersoll-Rand Plc, Miller Air Starter Co Inc, IPU Group, Multi Torque Industries Pty Ltd, The Rowland Company, KH Equipment Pty Ltd, Air Starter Components, and Gali Group holding significant market share. The market exhibits a dynamic competitive landscape driven by technological innovation, strategic acquisitions, and evolving end-user demands.
Market concentration is estimated at XX%, with the top five players accounting for approximately XX% of the total market revenue in 2025. Innovation ecosystems are largely shaped by collaborations between manufacturers and research institutions focusing on enhancing efficiency, durability, and reducing emissions. Regulatory frameworks, particularly concerning environmental regulations and safety standards, significantly influence market dynamics. Product substitutes, such as electric starters, pose a growing challenge, although air starters maintain a dominant position due to their reliability and cost-effectiveness in specific applications.
Significant M&A activity has been observed in recent years, with deal values totaling approximately $XX Million in 2024. This activity is expected to continue as companies seek to expand their market reach and product portfolios. End-user trends indicate a growing preference for energy-efficient and environmentally friendly air starters, particularly in the Oil & Gas and Power Generation sectors.
Air Starter Industry Industry Trends & Insights
The air starter market is experiencing robust growth driven by the increasing demand from key end-user industries like Oil & Gas, Power Generation, and Mining. The global expansion of these sectors, coupled with the need for reliable and efficient equipment in demanding environments, fuels market expansion. Technological advancements, particularly in materials science and manufacturing processes, are leading to the development of lighter, more durable, and energy-efficient air starters. Furthermore, stringent environmental regulations are pushing manufacturers to develop environmentally friendly air starters with lower emissions.
Consumer preferences are shifting towards improved reliability, reduced maintenance requirements, and enhanced safety features. Competitive dynamics are characterized by intense competition among established players and the emergence of new entrants offering innovative solutions. Market penetration of advanced air starter technologies, such as those incorporating smart sensors and predictive maintenance capabilities, is increasing at a CAGR of XX%. This translates into significant revenue growth for companies specializing in these areas.
Dominant Markets & Segments in Air Starter Industry
The Oil & Gas sector currently dominates the air starter market, accounting for approximately XX% of the global revenue in 2025. This dominance is primarily driven by the high demand for reliable starting systems in harsh operating environments. The North American region is currently the leading geographical market, fueled by substantial investments in oil and gas exploration and production.
Key Drivers in the Oil & Gas Sector:
- Robust growth in upstream and downstream activities.
- Stringent safety regulations mandating reliable starting systems.
- High capital expenditure on oil and gas infrastructure.
Dominant Type Segment: Vane Air Starters currently hold a larger market share than Turbine Air Starters, benefiting from their cost-effectiveness and suitability for a wider range of applications.
Geographic Dominance: The North American region's dominance is attributed to a robust oil & gas industry and substantial investments in infrastructure development. However, Asia-Pacific is experiencing rapid growth due to rising industrialization and energy demand.
Air Starter Industry Product Innovations
Recent product innovations focus on improving efficiency, durability, and reducing environmental impact. Lightweight materials, advanced compressor designs, and improved sealing technologies are key areas of development. These innovations aim to cater to the increasing demand for reliable and energy-efficient solutions in various applications. Furthermore, the integration of smart sensors and predictive maintenance capabilities is enhancing the overall lifecycle management of air starters.
Report Segmentation & Scope
The report segments the air starter market based on type (Vane Air Starter, Turbine Air Starter) and end-user (Oil & Gas, Power Generation, Mining, Others). Each segment is analyzed individually, providing detailed information on market size, growth projections, competitive dynamics, and key trends. The Vane Air Starter segment is projected to witness substantial growth driven by its cost-effectiveness and widespread application across various industries. The Turbine Air Starter segment, while experiencing slower growth, maintains its importance in high-power applications. The Oil & Gas segment dominates the end-user market, followed by the Power Generation and Mining segments, each exhibiting unique growth dynamics and competitive landscapes. The "Others" segment includes various industries utilizing air starters, which collectively present a sizable market opportunity.
Key Drivers of Air Starter Industry Growth
Several factors contribute to the growth of the air starter industry. Firstly, the continuous expansion of the oil & gas, power generation, and mining sectors fuels the demand for reliable starting systems. Secondly, technological advancements in air starter design and manufacturing lead to increased efficiency, durability, and reduced maintenance costs. Thirdly, stringent environmental regulations necessitate the development of more energy-efficient and environmentally friendly air starters.
Challenges in the Air Starter Industry Sector
The air starter industry faces certain challenges. Firstly, the increasing adoption of alternative starting technologies, such as electric starters, poses a competitive threat. Secondly, fluctuations in raw material prices and supply chain disruptions impact production costs and profitability. Thirdly, stringent environmental regulations require significant investments in research and development to meet emission standards. The cumulative impact of these challenges could potentially reduce the overall growth rate by XX% in the forecast period.
Leading Players in the Air Starter Industry Market
- Maradyne Corp
- Austart Air Starters
- Ingersoll-Rand Plc
- Miller Air Starter Co Inc
- IPU Group
- Multi Torque Industries Pty Ltd
- The Rowland Company
- KH Equipment Pty Ltd
- Air Starter Components
- Gali Group
Key Developments in Air Starter Industry Sector
- January 2023: Ingersoll Rand Plc launched a new line of energy-efficient air starters.
- June 2022: Maradyne Corp acquired a smaller air starter manufacturer, expanding its market share.
- October 2021: New safety regulations implemented in the EU impacted the air starter market. (Specific regulation details would need to be inserted here)
- March 2020: Several manufacturers faced supply chain disruptions due to the global pandemic.
Strategic Air Starter Industry Market Outlook
The air starter market is poised for continued growth, driven by increasing demand from key end-user industries and technological advancements. Strategic opportunities exist in developing energy-efficient and environmentally friendly air starters to comply with tightening environmental regulations. Furthermore, investments in research and development focused on improving reliability, durability, and reducing maintenance costs will play a crucial role in shaping future market trends. Companies focused on innovation and strategic partnerships are expected to gain a competitive advantage in this dynamic market.
Air Starter Industry Segmentation
-
1. Type
- 1.1. Vane Air Starter
- 1.2. Turbine Air Starter
-
2. End-User
- 2.1. Oil & Gas
- 2.2. Power Generation
- 2.3. Mining
- 2.4. Others
Air Starter Industry Segmentation By Geography
- 1. North America
- 2. Asia Pacific
- 3. Europe
- 4. South America
- 5. Middle East and Africa
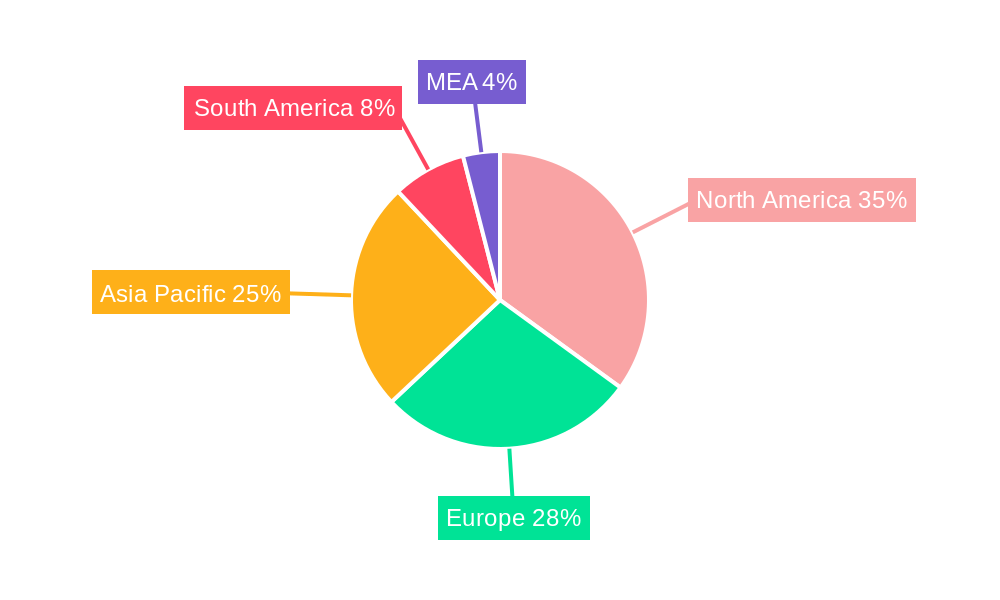
Air Starter Industry Regional Market Share
Geographic Coverage of Air Starter Industry
Air Starter Industry REPORT HIGHLIGHTS
| Aspects | Details |
|---|---|
| Study Period | 2020-2034 |
| Base Year | 2025 |
| Estimated Year | 2026 |
| Forecast Period | 2026-2034 |
| Historical Period | 2020-2025 |
| Growth Rate | CAGR of 4.75% from 2020-2034 |
| Segmentation |
|
Table of Contents
- 1. Introduction
- 1.1. Research Scope
- 1.2. Market Segmentation
- 1.3. Research Objective
- 1.4. Definitions and Assumptions
- 2. Executive Summary
- 2.1. Market Snapshot
- 3. Market Dynamics
- 3.1. Market Drivers
- 3.2. Market Restrains
- 3.3. Market Trends
- 3.4. Market Opportunities
- 4. Market Factor Analysis
- 4.1. Porters Five Forces
- 4.1.1. Bargaining Power of Suppliers
- 4.1.2. Bargaining Power of Buyers
- 4.1.3. Threat of New Entrants
- 4.1.4. Threat of Substitutes
- 4.1.5. Competitive Rivalry
- 4.2. PESTEL analysis
- 4.3. BCG Analysis
- 4.3.1. Stars (High Growth, High Market Share)
- 4.3.2. Cash Cows (Low Growth, High Market Share)
- 4.3.3. Question Mark (High Growth, Low Market Share)
- 4.3.4. Dogs (Low Growth, Low Market Share)
- 4.4. Ansoff Matrix Analysis
- 4.5. Supply Chain Analysis
- 4.6. Regulatory Landscape
- 4.7. Current Market Potential and Opportunity Assessment (TAM–SAM–SOM Framework)
- 4.8. PMV Analyst Note
- 4.1. Porters Five Forces
- 5. Market Analysis, Insights and Forecast 2021-2033
- 5.1. Market Analysis, Insights and Forecast - by Type
- 5.1.1. Vane Air Starter
- 5.1.2. Turbine Air Starter
- 5.2. Market Analysis, Insights and Forecast - by End-User
- 5.2.1. Oil & Gas
- 5.2.2. Power Generation
- 5.2.3. Mining
- 5.2.4. Others
- 5.3. Market Analysis, Insights and Forecast - by Region
- 5.3.1. North America
- 5.3.2. Asia Pacific
- 5.3.3. Europe
- 5.3.4. South America
- 5.3.5. Middle East and Africa
- 5.1. Market Analysis, Insights and Forecast - by Type
- 6. Global Air Starter Industry Analysis, Insights and Forecast, 2021-2033
- 6.1. Market Analysis, Insights and Forecast - by Type
- 6.1.1. Vane Air Starter
- 6.1.2. Turbine Air Starter
- 6.2. Market Analysis, Insights and Forecast - by End-User
- 6.2.1. Oil & Gas
- 6.2.2. Power Generation
- 6.2.3. Mining
- 6.2.4. Others
- 6.1. Market Analysis, Insights and Forecast - by Type
- 7. North America Air Starter Industry Analysis, Insights and Forecast, 2020-2032
- 7.1. Market Analysis, Insights and Forecast - by Type
- 7.1.1. Vane Air Starter
- 7.1.2. Turbine Air Starter
- 7.2. Market Analysis, Insights and Forecast - by End-User
- 7.2.1. Oil & Gas
- 7.2.2. Power Generation
- 7.2.3. Mining
- 7.2.4. Others
- 7.1. Market Analysis, Insights and Forecast - by Type
- 8. Asia Pacific Air Starter Industry Analysis, Insights and Forecast, 2020-2032
- 8.1. Market Analysis, Insights and Forecast - by Type
- 8.1.1. Vane Air Starter
- 8.1.2. Turbine Air Starter
- 8.2. Market Analysis, Insights and Forecast - by End-User
- 8.2.1. Oil & Gas
- 8.2.2. Power Generation
- 8.2.3. Mining
- 8.2.4. Others
- 8.1. Market Analysis, Insights and Forecast - by Type
- 9. Europe Air Starter Industry Analysis, Insights and Forecast, 2020-2032
- 9.1. Market Analysis, Insights and Forecast - by Type
- 9.1.1. Vane Air Starter
- 9.1.2. Turbine Air Starter
- 9.2. Market Analysis, Insights and Forecast - by End-User
- 9.2.1. Oil & Gas
- 9.2.2. Power Generation
- 9.2.3. Mining
- 9.2.4. Others
- 9.1. Market Analysis, Insights and Forecast - by Type
- 10. South America Air Starter Industry Analysis, Insights and Forecast, 2020-2032
- 10.1. Market Analysis, Insights and Forecast - by Type
- 10.1.1. Vane Air Starter
- 10.1.2. Turbine Air Starter
- 10.2. Market Analysis, Insights and Forecast - by End-User
- 10.2.1. Oil & Gas
- 10.2.2. Power Generation
- 10.2.3. Mining
- 10.2.4. Others
- 10.1. Market Analysis, Insights and Forecast - by Type
- 11. Middle East and Africa Air Starter Industry Analysis, Insights and Forecast, 2020-2032
- 11.1. Market Analysis, Insights and Forecast - by Type
- 11.1.1. Vane Air Starter
- 11.1.2. Turbine Air Starter
- 11.2. Market Analysis, Insights and Forecast - by End-User
- 11.2.1. Oil & Gas
- 11.2.2. Power Generation
- 11.2.3. Mining
- 11.2.4. Others
- 11.1. Market Analysis, Insights and Forecast - by Type
- 12. Competitive Analysis
- 12.1. Company Profiles
- 12.1.1 Maradyne Corp
- 12.1.1.1. Company Overview
- 12.1.1.2. Products
- 12.1.1.3. Company Financials
- 12.1.1.4. SWOT Analysis
- 12.1.2 Austart Air Starters
- 12.1.2.1. Company Overview
- 12.1.2.2. Products
- 12.1.2.3. Company Financials
- 12.1.2.4. SWOT Analysis
- 12.1.3 Ingersoll-Rand Plc
- 12.1.3.1. Company Overview
- 12.1.3.2. Products
- 12.1.3.3. Company Financials
- 12.1.3.4. SWOT Analysis
- 12.1.4 Miller Air Starter Co Inc
- 12.1.4.1. Company Overview
- 12.1.4.2. Products
- 12.1.4.3. Company Financials
- 12.1.4.4. SWOT Analysis
- 12.1.5 IPU Group
- 12.1.5.1. Company Overview
- 12.1.5.2. Products
- 12.1.5.3. Company Financials
- 12.1.5.4. SWOT Analysis
- 12.1.6 Multi Torque Industries Pty Ltd
- 12.1.6.1. Company Overview
- 12.1.6.2. Products
- 12.1.6.3. Company Financials
- 12.1.6.4. SWOT Analysis
- 12.1.7 The Rowland Company
- 12.1.7.1. Company Overview
- 12.1.7.2. Products
- 12.1.7.3. Company Financials
- 12.1.7.4. SWOT Analysis
- 12.1.8 KH Equipment Pty Ltd
- 12.1.8.1. Company Overview
- 12.1.8.2. Products
- 12.1.8.3. Company Financials
- 12.1.8.4. SWOT Analysis
- 12.1.9 Air Starter Components
- 12.1.9.1. Company Overview
- 12.1.9.2. Products
- 12.1.9.3. Company Financials
- 12.1.9.4. SWOT Analysis
- 12.1.10 Gali Group
- 12.1.10.1. Company Overview
- 12.1.10.2. Products
- 12.1.10.3. Company Financials
- 12.1.10.4. SWOT Analysis
- 12.1.1 Maradyne Corp
- 12.2. Market Entropy
- 12.2.1 Company's Key Areas Served
- 12.2.2 Recent Developments
- 12.3. Company Market Share Analysis 2025
- 12.3.1 Top 5 Companies Market Share Analysis
- 12.3.2 Top 3 Companies Market Share Analysis
- 12.4. List of Potential Customers
- 13. Research Methodology
List of Figures
- Figure 1: Global Air Starter Industry Revenue Breakdown (million, %) by Region 2025 & 2033
- Figure 2: Global Air Starter Industry Volume Breakdown (K Units, %) by Region 2025 & 2033
- Figure 3: North America Air Starter Industry Revenue (million), by Type 2025 & 2033
- Figure 4: North America Air Starter Industry Volume (K Units), by Type 2025 & 2033
- Figure 5: North America Air Starter Industry Revenue Share (%), by Type 2025 & 2033
- Figure 6: North America Air Starter Industry Volume Share (%), by Type 2025 & 2033
- Figure 7: North America Air Starter Industry Revenue (million), by End-User 2025 & 2033
- Figure 8: North America Air Starter Industry Volume (K Units), by End-User 2025 & 2033
- Figure 9: North America Air Starter Industry Revenue Share (%), by End-User 2025 & 2033
- Figure 10: North America Air Starter Industry Volume Share (%), by End-User 2025 & 2033
- Figure 11: North America Air Starter Industry Revenue (million), by Country 2025 & 2033
- Figure 12: North America Air Starter Industry Volume (K Units), by Country 2025 & 2033
- Figure 13: North America Air Starter Industry Revenue Share (%), by Country 2025 & 2033
- Figure 14: North America Air Starter Industry Volume Share (%), by Country 2025 & 2033
- Figure 15: Asia Pacific Air Starter Industry Revenue (million), by Type 2025 & 2033
- Figure 16: Asia Pacific Air Starter Industry Volume (K Units), by Type 2025 & 2033
- Figure 17: Asia Pacific Air Starter Industry Revenue Share (%), by Type 2025 & 2033
- Figure 18: Asia Pacific Air Starter Industry Volume Share (%), by Type 2025 & 2033
- Figure 19: Asia Pacific Air Starter Industry Revenue (million), by End-User 2025 & 2033
- Figure 20: Asia Pacific Air Starter Industry Volume (K Units), by End-User 2025 & 2033
- Figure 21: Asia Pacific Air Starter Industry Revenue Share (%), by End-User 2025 & 2033
- Figure 22: Asia Pacific Air Starter Industry Volume Share (%), by End-User 2025 & 2033
- Figure 23: Asia Pacific Air Starter Industry Revenue (million), by Country 2025 & 2033
- Figure 24: Asia Pacific Air Starter Industry Volume (K Units), by Country 2025 & 2033
- Figure 25: Asia Pacific Air Starter Industry Revenue Share (%), by Country 2025 & 2033
- Figure 26: Asia Pacific Air Starter Industry Volume Share (%), by Country 2025 & 2033
- Figure 27: Europe Air Starter Industry Revenue (million), by Type 2025 & 2033
- Figure 28: Europe Air Starter Industry Volume (K Units), by Type 2025 & 2033
- Figure 29: Europe Air Starter Industry Revenue Share (%), by Type 2025 & 2033
- Figure 30: Europe Air Starter Industry Volume Share (%), by Type 2025 & 2033
- Figure 31: Europe Air Starter Industry Revenue (million), by End-User 2025 & 2033
- Figure 32: Europe Air Starter Industry Volume (K Units), by End-User 2025 & 2033
- Figure 33: Europe Air Starter Industry Revenue Share (%), by End-User 2025 & 2033
- Figure 34: Europe Air Starter Industry Volume Share (%), by End-User 2025 & 2033
- Figure 35: Europe Air Starter Industry Revenue (million), by Country 2025 & 2033
- Figure 36: Europe Air Starter Industry Volume (K Units), by Country 2025 & 2033
- Figure 37: Europe Air Starter Industry Revenue Share (%), by Country 2025 & 2033
- Figure 38: Europe Air Starter Industry Volume Share (%), by Country 2025 & 2033
- Figure 39: South America Air Starter Industry Revenue (million), by Type 2025 & 2033
- Figure 40: South America Air Starter Industry Volume (K Units), by Type 2025 & 2033
- Figure 41: South America Air Starter Industry Revenue Share (%), by Type 2025 & 2033
- Figure 42: South America Air Starter Industry Volume Share (%), by Type 2025 & 2033
- Figure 43: South America Air Starter Industry Revenue (million), by End-User 2025 & 2033
- Figure 44: South America Air Starter Industry Volume (K Units), by End-User 2025 & 2033
- Figure 45: South America Air Starter Industry Revenue Share (%), by End-User 2025 & 2033
- Figure 46: South America Air Starter Industry Volume Share (%), by End-User 2025 & 2033
- Figure 47: South America Air Starter Industry Revenue (million), by Country 2025 & 2033
- Figure 48: South America Air Starter Industry Volume (K Units), by Country 2025 & 2033
- Figure 49: South America Air Starter Industry Revenue Share (%), by Country 2025 & 2033
- Figure 50: South America Air Starter Industry Volume Share (%), by Country 2025 & 2033
- Figure 51: Middle East and Africa Air Starter Industry Revenue (million), by Type 2025 & 2033
- Figure 52: Middle East and Africa Air Starter Industry Volume (K Units), by Type 2025 & 2033
- Figure 53: Middle East and Africa Air Starter Industry Revenue Share (%), by Type 2025 & 2033
- Figure 54: Middle East and Africa Air Starter Industry Volume Share (%), by Type 2025 & 2033
- Figure 55: Middle East and Africa Air Starter Industry Revenue (million), by End-User 2025 & 2033
- Figure 56: Middle East and Africa Air Starter Industry Volume (K Units), by End-User 2025 & 2033
- Figure 57: Middle East and Africa Air Starter Industry Revenue Share (%), by End-User 2025 & 2033
- Figure 58: Middle East and Africa Air Starter Industry Volume Share (%), by End-User 2025 & 2033
- Figure 59: Middle East and Africa Air Starter Industry Revenue (million), by Country 2025 & 2033
- Figure 60: Middle East and Africa Air Starter Industry Volume (K Units), by Country 2025 & 2033
- Figure 61: Middle East and Africa Air Starter Industry Revenue Share (%), by Country 2025 & 2033
- Figure 62: Middle East and Africa Air Starter Industry Volume Share (%), by Country 2025 & 2033
List of Tables
- Table 1: Global Air Starter Industry Revenue million Forecast, by Type 2020 & 2033
- Table 2: Global Air Starter Industry Volume K Units Forecast, by Type 2020 & 2033
- Table 3: Global Air Starter Industry Revenue million Forecast, by End-User 2020 & 2033
- Table 4: Global Air Starter Industry Volume K Units Forecast, by End-User 2020 & 2033
- Table 5: Global Air Starter Industry Revenue million Forecast, by Region 2020 & 2033
- Table 6: Global Air Starter Industry Volume K Units Forecast, by Region 2020 & 2033
- Table 7: Global Air Starter Industry Revenue million Forecast, by Type 2020 & 2033
- Table 8: Global Air Starter Industry Volume K Units Forecast, by Type 2020 & 2033
- Table 9: Global Air Starter Industry Revenue million Forecast, by End-User 2020 & 2033
- Table 10: Global Air Starter Industry Volume K Units Forecast, by End-User 2020 & 2033
- Table 11: Global Air Starter Industry Revenue million Forecast, by Country 2020 & 2033
- Table 12: Global Air Starter Industry Volume K Units Forecast, by Country 2020 & 2033
- Table 13: Global Air Starter Industry Revenue million Forecast, by Type 2020 & 2033
- Table 14: Global Air Starter Industry Volume K Units Forecast, by Type 2020 & 2033
- Table 15: Global Air Starter Industry Revenue million Forecast, by End-User 2020 & 2033
- Table 16: Global Air Starter Industry Volume K Units Forecast, by End-User 2020 & 2033
- Table 17: Global Air Starter Industry Revenue million Forecast, by Country 2020 & 2033
- Table 18: Global Air Starter Industry Volume K Units Forecast, by Country 2020 & 2033
- Table 19: Global Air Starter Industry Revenue million Forecast, by Type 2020 & 2033
- Table 20: Global Air Starter Industry Volume K Units Forecast, by Type 2020 & 2033
- Table 21: Global Air Starter Industry Revenue million Forecast, by End-User 2020 & 2033
- Table 22: Global Air Starter Industry Volume K Units Forecast, by End-User 2020 & 2033
- Table 23: Global Air Starter Industry Revenue million Forecast, by Country 2020 & 2033
- Table 24: Global Air Starter Industry Volume K Units Forecast, by Country 2020 & 2033
- Table 25: Global Air Starter Industry Revenue million Forecast, by Type 2020 & 2033
- Table 26: Global Air Starter Industry Volume K Units Forecast, by Type 2020 & 2033
- Table 27: Global Air Starter Industry Revenue million Forecast, by End-User 2020 & 2033
- Table 28: Global Air Starter Industry Volume K Units Forecast, by End-User 2020 & 2033
- Table 29: Global Air Starter Industry Revenue million Forecast, by Country 2020 & 2033
- Table 30: Global Air Starter Industry Volume K Units Forecast, by Country 2020 & 2033
- Table 31: Global Air Starter Industry Revenue million Forecast, by Type 2020 & 2033
- Table 32: Global Air Starter Industry Volume K Units Forecast, by Type 2020 & 2033
- Table 33: Global Air Starter Industry Revenue million Forecast, by End-User 2020 & 2033
- Table 34: Global Air Starter Industry Volume K Units Forecast, by End-User 2020 & 2033
- Table 35: Global Air Starter Industry Revenue million Forecast, by Country 2020 & 2033
- Table 36: Global Air Starter Industry Volume K Units Forecast, by Country 2020 & 2033
Frequently Asked Questions
1. What is the projected Compound Annual Growth Rate (CAGR) of the Air Starter Industry?
The projected CAGR is approximately 4.75%.
2. Which companies are prominent players in the Air Starter Industry?
Key companies in the market include Maradyne Corp, Austart Air Starters, Ingersoll-Rand Plc, Miller Air Starter Co Inc, IPU Group, Multi Torque Industries Pty Ltd, The Rowland Company, KH Equipment Pty Ltd, Air Starter Components, Gali Group.
3. What are the main segments of the Air Starter Industry?
The market segments include Type, End-User.
4. Can you provide details about the market size?
The market size is estimated to be USD 416.18 million as of 2022.
5. What are some drivers contributing to market growth?
4.; Growing Vehicle Ownership4.; Government Initiatives.
6. What are the notable trends driving market growth?
Oil & Gas Sector to Dominate the Market.
7. Are there any restraints impacting market growth?
4.; Volatile Crude Oil Prices.
8. Can you provide examples of recent developments in the market?
N/A
9. What pricing options are available for accessing the report?
Pricing options include single-user, multi-user, and enterprise licenses priced at USD 4750, USD 5250, and USD 8750 respectively.
10. Is the market size provided in terms of value or volume?
The market size is provided in terms of value, measured in million and volume, measured in K Units.
11. Are there any specific market keywords associated with the report?
Yes, the market keyword associated with the report is "Air Starter Industry," which aids in identifying and referencing the specific market segment covered.
12. How do I determine which pricing option suits my needs best?
The pricing options vary based on user requirements and access needs. Individual users may opt for single-user licenses, while businesses requiring broader access may choose multi-user or enterprise licenses for cost-effective access to the report.
13. Are there any additional resources or data provided in the Air Starter Industry report?
While the report offers comprehensive insights, it's advisable to review the specific contents or supplementary materials provided to ascertain if additional resources or data are available.
14. How can I stay updated on further developments or reports in the Air Starter Industry?
To stay informed about further developments, trends, and reports in the Air Starter Industry, consider subscribing to industry newsletters, following relevant companies and organizations, or regularly checking reputable industry news sources and publications.
Methodology
Step 1 - Identification of Relevant Samples Size from Population Database


Step 2 - Approaches for Defining Global Market Size (Value, Volume* & Price*)

Note*: In applicable scenarios
Step 3 - Data Sources
Primary Research
- Web Analytics
- Survey Reports
- Research Institute
- Latest Research Reports
- Opinion Leaders
Secondary Research
- Annual Reports
- White Paper
- Latest Press Release
- Industry Association
- Paid Database
- Investor Presentations

Step 4 - Data Triangulation
Involves using different sources of information in order to increase the validity of a study
These sources are likely to be stakeholders in a program - participants, other researchers, program staff, other community members, and so on.
Then we put all data in single framework & apply various statistical tools to find out the dynamic on the market.
During the analysis stage, feedback from the stakeholder groups would be compared to determine areas of agreement as well as areas of divergence