


Key Insights
The global Digital Diagnostics System market is poised for remarkable expansion, projected to reach an estimated USD 1.41 billion in 2025. This growth is fueled by an impressive Compound Annual Growth Rate (CAGR) of 18.08% during the forecast period of 2025-2033. A significant driver for this surge is the increasing adoption of artificial intelligence (AI) within diagnostic workflows, enhancing accuracy, speed, and accessibility. AI-based digital diagnostics are revolutionizing fields like pathology, radiology, and medical imaging by enabling faster analysis of complex data, aiding in early disease detection, and personalizing treatment plans. The demand for sophisticated diagnostic solutions in hospitals, independent diagnostic centers, and research institutions is continuously rising, propelled by the need for more efficient and precise patient care. Furthermore, the growing prevalence of chronic diseases and an aging global population contribute to the escalating demand for advanced diagnostic tools that can offer timely and accurate results.
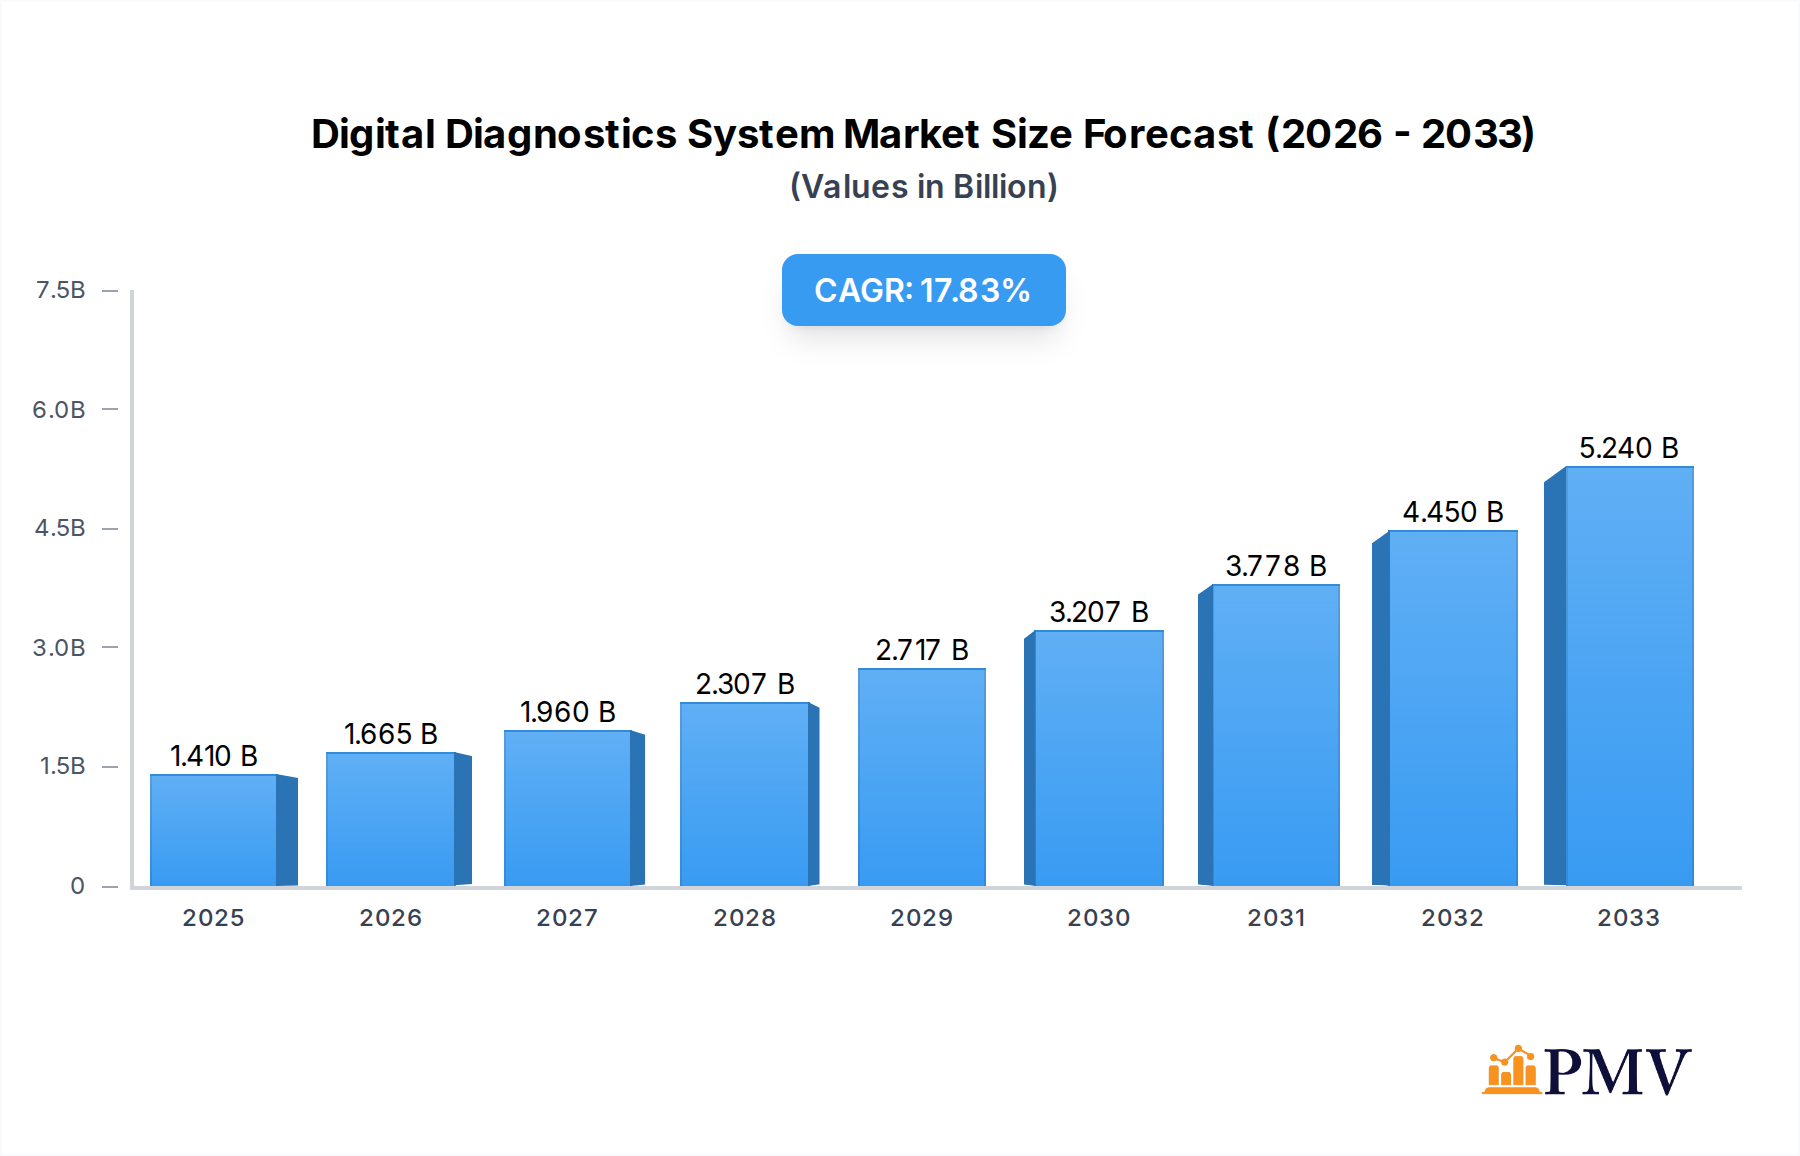
Digital Diagnostics System Market Size (In Billion)

The market's robust growth trajectory is further supported by a landscape of technological advancements and increasing investment from key players such as Hologic, PathAI, Proscia, and Aiforia. These companies are at the forefront of developing innovative digital pathology and AI-powered diagnostic platforms, integrating machine learning for enhanced image analysis and clinical decision support. While the market is predominantly driven by technological innovation and increasing healthcare expenditure, potential restraints could arise from the high initial investment costs for implementing these advanced systems and the need for stringent regulatory approvals. However, the clear advantages of digital diagnostics, including improved workflow efficiency, reduced human error, and better data management, are expected to outweigh these challenges, ensuring sustained market expansion across various applications and regions. The integration of AI promises to unlock new frontiers in early disease detection and targeted therapies, solidifying the digital diagnostics system's critical role in modern healthcare.

Digital Diagnostics System Company Market Share
This comprehensive market research report delves into the global Digital Diagnostics System market, offering in-depth analysis and actionable insights for industry stakeholders. Covering the historical period of 2019–2024 and extending to a forecast period of 2025–2033, with a base year of 2025, this study provides a detailed understanding of market dynamics, trends, and future prospects. The report is meticulously crafted to be SEO-optimized, integrating high-ranking keywords to ensure maximum search visibility and engagement with professionals in the healthcare and technology sectors. All monetary values are presented in billions.
Digital Diagnostics System Market Structure & Competitive Dynamics
The Digital Diagnostics System market exhibits a moderately concentrated structure, characterized by the presence of established players alongside emerging innovators. Market concentration is influenced by significant R&D investments and the intellectual property landscape. The innovation ecosystem is vibrant, with a strong focus on AI-powered diagnostics, driving the development of advanced solutions. Regulatory frameworks, particularly around data privacy and medical device approvals, play a crucial role in shaping market entry and competitive strategies. Product substitutes, while present, are increasingly being augmented or replaced by digital solutions, especially in areas like digital pathology. End-user trends point towards an increasing demand for faster, more accurate, and cost-effective diagnostic methods across all healthcare settings. Mergers and acquisitions (M&A) are a significant aspect of market dynamics, with recent deals valuing in the billions signaling consolidation and strategic expansion. For instance, a notable M&A in the last quarter of 2023 saw a deal worth xx billion aimed at enhancing AI capabilities. Market share analyses reveal that companies with robust AI algorithms and comprehensive digital pathology platforms are gaining significant traction, holding substantial portions of the overall market share.
Digital Diagnostics System Industry Trends & Insights
The Digital Diagnostics System industry is poised for substantial growth, driven by a confluence of technological advancements, increasing healthcare expenditures, and a growing emphasis on precision medicine. The AI-based diagnostics segment is experiencing a remarkable surge, with projected Compound Annual Growth Rates (CAGRs) of xx% over the forecast period. This growth is fueled by the ability of AI algorithms to analyze vast amounts of medical data, including images and patient records, with unprecedented speed and accuracy, leading to earlier disease detection and more personalized treatment plans. Technological disruptions are primarily centered around advancements in machine learning, deep learning, and cloud computing, which are enabling the development of more sophisticated diagnostic tools. For example, the integration of computational pathology with AI is revolutionizing the analysis of tissue samples, providing quantitative insights that were previously unattainable. Consumer preferences are shifting towards digital health solutions that offer convenience, accessibility, and improved outcomes. Patients are increasingly seeking remote diagnostic capabilities and personalized health management, driving the adoption of digital diagnostics systems. Competitive dynamics are intensifying, with key players investing heavily in R&D to maintain a competitive edge. The market penetration of digital diagnostics systems is expected to reach xx% by 2033, indicating a significant transformation in how diagnostic services are delivered. The increasing adoption of telemedicine and remote patient monitoring further bolsters the demand for digital diagnostic solutions. Moreover, the growing prevalence of chronic diseases worldwide necessitates more efficient and scalable diagnostic approaches, a gap that digital diagnostics systems are well-positioned to fill. The global market size for digital diagnostics systems is projected to reach over xx billion by 2033, a testament to its transformative potential.
Dominant Markets & Segments in Digital Diagnostics System
The North America region currently dominates the global Digital Diagnostics System market, driven by robust healthcare infrastructure, high adoption rates of advanced technologies, and significant investments in digital health research and development. Within North America, the United States leads in terms of market size and innovation. Key drivers for this dominance include supportive government policies promoting digital health adoption, a well-established ecosystem of technology companies and research institutions, and a strong demand for cutting-edge diagnostic solutions.
Application Dominance:
- Hospitals: Hospitals are the largest application segment, accounting for an estimated xx% of the market share. This is attributed to the increasing need for integrated diagnostic workflows, advanced imaging analysis, and efficient patient management within hospital settings. The substantial patient volumes and complex diagnostic requirements in hospitals necessitate the adoption of sophisticated digital tools for pathology, radiology, and other specialties.
- Diagnostic Centers: Diagnostic centers represent another significant segment, projected to grow at a CAGR of xx%. These centers are increasingly investing in digital technologies to offer a wider range of services and to improve turnaround times for diagnostic tests, thereby enhancing patient convenience and satisfaction.
- Laboratories & Research Institutes: This segment, while smaller, is crucial for driving innovation and adoption of novel digital diagnostic solutions. Research institutes are leveraging digital pathology and AI to accelerate drug discovery and disease research, contributing to the overall market expansion.
Types Dominance:
- AI-Based: The AI-Based segment is the fastest-growing and most impactful type of digital diagnostic system. With an estimated market share of xx% and a projected CAGR of xx%, AI-powered solutions are redefining diagnostic capabilities. This dominance stems from the ability of AI to enhance accuracy, efficiency, and reduce diagnostic errors.
- Other: The 'Other' types, encompassing traditional digital imaging systems and basic digital pathology software, hold a smaller but still significant portion of the market. However, their growth is outpaced by the rapid advancements in AI-driven systems.
The economic policies in developed nations, such as tax incentives for technology adoption and funding for healthcare innovation, further contribute to the dominance of these regions and segments. Infrastructure development, including high-speed internet connectivity and cloud computing capabilities, is also a critical enabler of digital diagnostics system adoption.
Digital Diagnostics System Product Innovations
Product innovations in the Digital Diagnostics System market are primarily focused on enhancing diagnostic accuracy, efficiency, and accessibility through the integration of artificial intelligence and advanced imaging techniques. Companies are developing AI algorithms capable of performing complex analyses of digital pathology slides, radiology images, and other medical data, leading to faster and more precise diagnoses. Competitive advantages are being built around the development of proprietary algorithms, user-friendly interfaces, and seamless integration with existing hospital information systems. Technological trends include the growing use of deep learning for image recognition, the application of natural language processing for analyzing clinical notes, and the deployment of cloud-based platforms for scalable data management and analysis. These innovations are enabling new applications in areas such as early cancer detection, personalized treatment planning, and remote diagnostics, providing a significant market fit.
Report Segmentation & Scope
This report segments the Digital Diagnostics System market across key dimensions to provide a granular view of its dynamics. The primary segmentation includes:
Application:
- Hospital: This segment encompasses the deployment and usage of digital diagnostics systems within hospital settings. Growth projections for this segment are xx% CAGR, with an estimated market size of xx billion by 2033. Competitive dynamics are driven by the need for integrated diagnostic solutions and efficient workflow management.
- Diagnostic Centers: This segment covers the use of digital diagnostics in independent diagnostic facilities. The market size for this segment is projected at xx billion by 2033, with a CAGR of xx%. Key competitive factors include service offerings and turnaround times.
- Laboratories & Research Institutes: This segment focuses on the adoption of digital diagnostics for research and specialized laboratory testing. Market size is estimated at xx billion by 2033, with a CAGR of xx%. Competitive dynamics are characterized by innovation and the development of cutting-edge research tools.
Types:
- AI Based: This segment represents diagnostic systems powered by artificial intelligence. Projected market size is xx billion by 2033, with a high CAGR of xx%. The competitive landscape is defined by algorithmic sophistication and data validation.
- Other: This segment includes digital diagnostic systems that do not primarily rely on AI, such as advanced digital imaging devices. Market size is projected at xx billion by 2033, with a CAGR of xx%. Competition revolves around hardware capabilities and integration.
The scope of this report covers the global market, with detailed regional and country-level analysis.
Key Drivers of Digital Diagnostics System Growth
The growth of the Digital Diagnostics System market is propelled by several key drivers. Technological advancements, particularly in artificial intelligence and machine learning, are fundamental, enabling more accurate and efficient diagnostic processes. For instance, the development of deep learning models for image analysis is revolutionizing radiology and pathology. Economic factors, such as increasing healthcare expenditure globally and the growing demand for cost-effective healthcare solutions, are also significant. Governments worldwide are investing in digital health infrastructure, further fueling market expansion. Regulatory bodies are increasingly creating frameworks that support the adoption of innovative digital diagnostic tools, although this can also be a challenge. The rising prevalence of chronic diseases and the need for early detection and personalized treatment further drive the demand for advanced diagnostic capabilities.
Challenges in the Digital Diagnostics System Sector
Despite the promising growth trajectory, the Digital Diagnostics System sector faces several challenges. Regulatory hurdles, including the lengthy and complex approval processes for new medical devices and software, can significantly slow down market penetration. Data privacy concerns and cybersecurity threats are also major restraints, requiring robust safeguards to protect sensitive patient information. The high initial investment cost associated with implementing digital diagnostic systems can be a barrier for smaller healthcare providers and in developing economies. Furthermore, the need for skilled personnel to operate and maintain these advanced systems poses a challenge, necessitating significant investment in training and education. Interoperability issues between different digital systems and legacy IT infrastructure can also hinder seamless integration and data exchange, impacting overall efficiency.
Leading Players in the Digital Diagnostics System Market
The Digital Diagnostics System market is populated by a number of key players, including:
- Hologic
- PathAI
- Proscia
- Aiforia
- Deep Bio
- Dipath
- iDeepwise
- LBP
- F.Q pathtech
- CellaVision
- AIRA Matrix
- Syntropy
- Indica Labs
- DoMore Diagnostics
Key Developments in Digital Diagnostics System Sector
- 2023/Q4: PathAI partners with a leading pharmaceutical company to develop AI-powered companion diagnostics for oncology, impacting drug development timelines and precision medicine.
- 2024/Q1: Proscia launches a new AI-powered digital pathology solution for prostate cancer grading, improving accuracy and efficiency for pathologists, a significant step in computational pathology.
- 2024/Q2: Aiforia secures xx million in funding to accelerate the development and commercialization of its AI-driven image analysis platform, enhancing its market position in AI-based diagnostics.
- 2024/Q3: Hologic announces the acquisition of a smaller diagnostics company for xx billion, expanding its portfolio in women's health diagnostics and strengthening its market presence.
- 2024/Q4: Deep Bio receives regulatory approval for its AI-based breast cancer detection software, marking a crucial milestone in regulatory acceptance of AI in diagnostic imaging.
Strategic Digital Diagnostics System Market Outlook
The strategic outlook for the Digital Diagnostics System market is exceptionally strong, driven by ongoing innovation and increasing adoption across healthcare ecosystems. Growth accelerators include the expanding applications of AI in predicting disease risk and personalizing treatment plans, alongside the continuous development of cloud-based platforms that enhance scalability and accessibility. The increasing focus on preventative healthcare and early disease detection further fuels demand for sophisticated digital diagnostic tools. Strategic opportunities lie in expanding into emerging markets, fostering collaborations between technology providers and healthcare institutions, and addressing the evolving regulatory landscape. The market is set to witness further consolidation through strategic acquisitions and partnerships as companies aim to leverage synergistic capabilities and expand their global footprint, ensuring robust future market potential.
Digital Diagnostics System Segmentation
-
1. Application
- 1.1. Hospital
- 1.2. Diagnostic Centers
- 1.3. Laboratories & Research Institutes
-
2. Types
- 2.1. AI Based
- 2.2. Other
Digital Diagnostics System Segmentation By Geography
-
1. North America
- 1.1. United States
- 1.2. Canada
- 1.3. Mexico
-
2. South America
- 2.1. Brazil
- 2.2. Argentina
- 2.3. Rest of South America
-
3. Europe
- 3.1. United Kingdom
- 3.2. Germany
- 3.3. France
- 3.4. Italy
- 3.5. Spain
- 3.6. Russia
- 3.7. Benelux
- 3.8. Nordics
- 3.9. Rest of Europe
-
4. Middle East & Africa
- 4.1. Turkey
- 4.2. Israel
- 4.3. GCC
- 4.4. North Africa
- 4.5. South Africa
- 4.6. Rest of Middle East & Africa
-
5. Asia Pacific
- 5.1. China
- 5.2. India
- 5.3. Japan
- 5.4. South Korea
- 5.5. ASEAN
- 5.6. Oceania
- 5.7. Rest of Asia Pacific
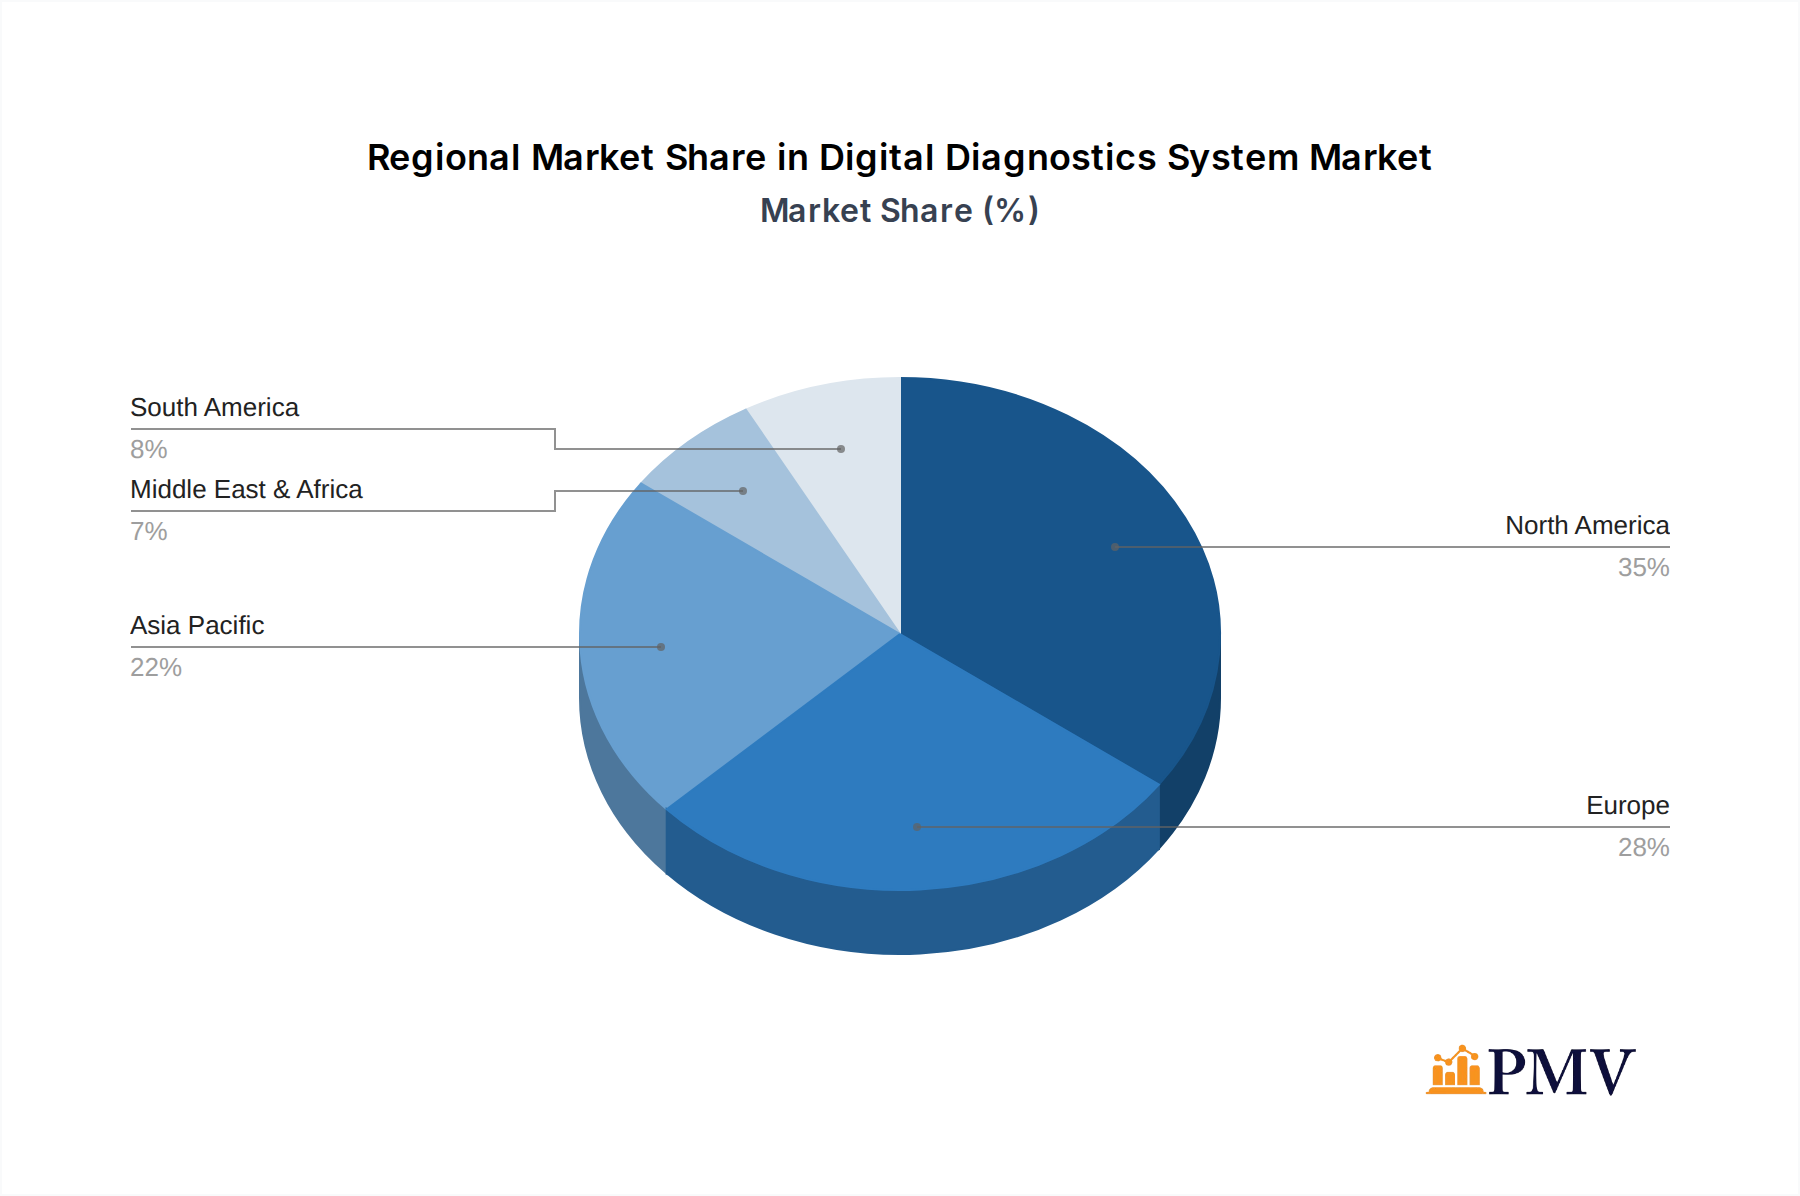
Digital Diagnostics System Regional Market Share
Geographic Coverage of Digital Diagnostics System
Digital Diagnostics System REPORT HIGHLIGHTS
| Aspects | Details |
|---|---|
| Study Period | 2020-2034 |
| Base Year | 2025 |
| Estimated Year | 2026 |
| Forecast Period | 2026-2034 |
| Historical Period | 2020-2025 |
| Growth Rate | CAGR of 18.08% from 2020-2034 |
| Segmentation |
|
Table of Contents
- 1. Introduction
- 1.1. Research Scope
- 1.2. Market Segmentation
- 1.3. Research Methodology
- 1.4. Definitions and Assumptions
- 2. Executive Summary
- 2.1. Introduction
- 3. Market Dynamics
- 3.1. Introduction
- 3.2. Market Drivers
- 3.3. Market Restrains
- 3.4. Market Trends
- 4. Market Factor Analysis
- 4.1. Porters Five Forces
- 4.2. Supply/Value Chain
- 4.3. PESTEL analysis
- 4.4. Market Entropy
- 4.5. Patent/Trademark Analysis
- 5. Global Digital Diagnostics System Analysis, Insights and Forecast, 2020-2032
- 5.1. Market Analysis, Insights and Forecast - by Application
- 5.1.1. Hospital
- 5.1.2. Diagnostic Centers
- 5.1.3. Laboratories & Research Institutes
- 5.2. Market Analysis, Insights and Forecast - by Types
- 5.2.1. AI Based
- 5.2.2. Other
- 5.3. Market Analysis, Insights and Forecast - by Region
- 5.3.1. North America
- 5.3.2. South America
- 5.3.3. Europe
- 5.3.4. Middle East & Africa
- 5.3.5. Asia Pacific
- 5.1. Market Analysis, Insights and Forecast - by Application
- 6. North America Digital Diagnostics System Analysis, Insights and Forecast, 2020-2032
- 6.1. Market Analysis, Insights and Forecast - by Application
- 6.1.1. Hospital
- 6.1.2. Diagnostic Centers
- 6.1.3. Laboratories & Research Institutes
- 6.2. Market Analysis, Insights and Forecast - by Types
- 6.2.1. AI Based
- 6.2.2. Other
- 6.1. Market Analysis, Insights and Forecast - by Application
- 7. South America Digital Diagnostics System Analysis, Insights and Forecast, 2020-2032
- 7.1. Market Analysis, Insights and Forecast - by Application
- 7.1.1. Hospital
- 7.1.2. Diagnostic Centers
- 7.1.3. Laboratories & Research Institutes
- 7.2. Market Analysis, Insights and Forecast - by Types
- 7.2.1. AI Based
- 7.2.2. Other
- 7.1. Market Analysis, Insights and Forecast - by Application
- 8. Europe Digital Diagnostics System Analysis, Insights and Forecast, 2020-2032
- 8.1. Market Analysis, Insights and Forecast - by Application
- 8.1.1. Hospital
- 8.1.2. Diagnostic Centers
- 8.1.3. Laboratories & Research Institutes
- 8.2. Market Analysis, Insights and Forecast - by Types
- 8.2.1. AI Based
- 8.2.2. Other
- 8.1. Market Analysis, Insights and Forecast - by Application
- 9. Middle East & Africa Digital Diagnostics System Analysis, Insights and Forecast, 2020-2032
- 9.1. Market Analysis, Insights and Forecast - by Application
- 9.1.1. Hospital
- 9.1.2. Diagnostic Centers
- 9.1.3. Laboratories & Research Institutes
- 9.2. Market Analysis, Insights and Forecast - by Types
- 9.2.1. AI Based
- 9.2.2. Other
- 9.1. Market Analysis, Insights and Forecast - by Application
- 10. Asia Pacific Digital Diagnostics System Analysis, Insights and Forecast, 2020-2032
- 10.1. Market Analysis, Insights and Forecast - by Application
- 10.1.1. Hospital
- 10.1.2. Diagnostic Centers
- 10.1.3. Laboratories & Research Institutes
- 10.2. Market Analysis, Insights and Forecast - by Types
- 10.2.1. AI Based
- 10.2.2. Other
- 10.1. Market Analysis, Insights and Forecast - by Application
- 11. Competitive Analysis
- 11.1. Global Market Share Analysis 2025
- 11.2. Company Profiles
- 11.2.1 Hologic
- 11.2.1.1. Overview
- 11.2.1.2. Products
- 11.2.1.3. SWOT Analysis
- 11.2.1.4. Recent Developments
- 11.2.1.5. Financials (Based on Availability)
- 11.2.2 PathAI
- 11.2.2.1. Overview
- 11.2.2.2. Products
- 11.2.2.3. SWOT Analysis
- 11.2.2.4. Recent Developments
- 11.2.2.5. Financials (Based on Availability)
- 11.2.3 Proscia
- 11.2.3.1. Overview
- 11.2.3.2. Products
- 11.2.3.3. SWOT Analysis
- 11.2.3.4. Recent Developments
- 11.2.3.5. Financials (Based on Availability)
- 11.2.4 Aiforia
- 11.2.4.1. Overview
- 11.2.4.2. Products
- 11.2.4.3. SWOT Analysis
- 11.2.4.4. Recent Developments
- 11.2.4.5. Financials (Based on Availability)
- 11.2.5 Deep Bio
- 11.2.5.1. Overview
- 11.2.5.2. Products
- 11.2.5.3. SWOT Analysis
- 11.2.5.4. Recent Developments
- 11.2.5.5. Financials (Based on Availability)
- 11.2.6 Dipath
- 11.2.6.1. Overview
- 11.2.6.2. Products
- 11.2.6.3. SWOT Analysis
- 11.2.6.4. Recent Developments
- 11.2.6.5. Financials (Based on Availability)
- 11.2.7 iDeepwise
- 11.2.7.1. Overview
- 11.2.7.2. Products
- 11.2.7.3. SWOT Analysis
- 11.2.7.4. Recent Developments
- 11.2.7.5. Financials (Based on Availability)
- 11.2.8 LBP
- 11.2.8.1. Overview
- 11.2.8.2. Products
- 11.2.8.3. SWOT Analysis
- 11.2.8.4. Recent Developments
- 11.2.8.5. Financials (Based on Availability)
- 11.2.9 F.Q pathtech
- 11.2.9.1. Overview
- 11.2.9.2. Products
- 11.2.9.3. SWOT Analysis
- 11.2.9.4. Recent Developments
- 11.2.9.5. Financials (Based on Availability)
- 11.2.10 CellaVision
- 11.2.10.1. Overview
- 11.2.10.2. Products
- 11.2.10.3. SWOT Analysis
- 11.2.10.4. Recent Developments
- 11.2.10.5. Financials (Based on Availability)
- 11.2.11 AIRA Matrix
- 11.2.11.1. Overview
- 11.2.11.2. Products
- 11.2.11.3. SWOT Analysis
- 11.2.11.4. Recent Developments
- 11.2.11.5. Financials (Based on Availability)
- 11.2.12 Syntropy
- 11.2.12.1. Overview
- 11.2.12.2. Products
- 11.2.12.3. SWOT Analysis
- 11.2.12.4. Recent Developments
- 11.2.12.5. Financials (Based on Availability)
- 11.2.13 Indica Labs
- 11.2.13.1. Overview
- 11.2.13.2. Products
- 11.2.13.3. SWOT Analysis
- 11.2.13.4. Recent Developments
- 11.2.13.5. Financials (Based on Availability)
- 11.2.14 DoMore Diagnostics
- 11.2.14.1. Overview
- 11.2.14.2. Products
- 11.2.14.3. SWOT Analysis
- 11.2.14.4. Recent Developments
- 11.2.14.5. Financials (Based on Availability)
- 11.2.1 Hologic
List of Figures
- Figure 1: Global Digital Diagnostics System Revenue Breakdown (undefined, %) by Region 2025 & 2033
- Figure 2: North America Digital Diagnostics System Revenue (undefined), by Application 2025 & 2033
- Figure 3: North America Digital Diagnostics System Revenue Share (%), by Application 2025 & 2033
- Figure 4: North America Digital Diagnostics System Revenue (undefined), by Types 2025 & 2033
- Figure 5: North America Digital Diagnostics System Revenue Share (%), by Types 2025 & 2033
- Figure 6: North America Digital Diagnostics System Revenue (undefined), by Country 2025 & 2033
- Figure 7: North America Digital Diagnostics System Revenue Share (%), by Country 2025 & 2033
- Figure 8: South America Digital Diagnostics System Revenue (undefined), by Application 2025 & 2033
- Figure 9: South America Digital Diagnostics System Revenue Share (%), by Application 2025 & 2033
- Figure 10: South America Digital Diagnostics System Revenue (undefined), by Types 2025 & 2033
- Figure 11: South America Digital Diagnostics System Revenue Share (%), by Types 2025 & 2033
- Figure 12: South America Digital Diagnostics System Revenue (undefined), by Country 2025 & 2033
- Figure 13: South America Digital Diagnostics System Revenue Share (%), by Country 2025 & 2033
- Figure 14: Europe Digital Diagnostics System Revenue (undefined), by Application 2025 & 2033
- Figure 15: Europe Digital Diagnostics System Revenue Share (%), by Application 2025 & 2033
- Figure 16: Europe Digital Diagnostics System Revenue (undefined), by Types 2025 & 2033
- Figure 17: Europe Digital Diagnostics System Revenue Share (%), by Types 2025 & 2033
- Figure 18: Europe Digital Diagnostics System Revenue (undefined), by Country 2025 & 2033
- Figure 19: Europe Digital Diagnostics System Revenue Share (%), by Country 2025 & 2033
- Figure 20: Middle East & Africa Digital Diagnostics System Revenue (undefined), by Application 2025 & 2033
- Figure 21: Middle East & Africa Digital Diagnostics System Revenue Share (%), by Application 2025 & 2033
- Figure 22: Middle East & Africa Digital Diagnostics System Revenue (undefined), by Types 2025 & 2033
- Figure 23: Middle East & Africa Digital Diagnostics System Revenue Share (%), by Types 2025 & 2033
- Figure 24: Middle East & Africa Digital Diagnostics System Revenue (undefined), by Country 2025 & 2033
- Figure 25: Middle East & Africa Digital Diagnostics System Revenue Share (%), by Country 2025 & 2033
- Figure 26: Asia Pacific Digital Diagnostics System Revenue (undefined), by Application 2025 & 2033
- Figure 27: Asia Pacific Digital Diagnostics System Revenue Share (%), by Application 2025 & 2033
- Figure 28: Asia Pacific Digital Diagnostics System Revenue (undefined), by Types 2025 & 2033
- Figure 29: Asia Pacific Digital Diagnostics System Revenue Share (%), by Types 2025 & 2033
- Figure 30: Asia Pacific Digital Diagnostics System Revenue (undefined), by Country 2025 & 2033
- Figure 31: Asia Pacific Digital Diagnostics System Revenue Share (%), by Country 2025 & 2033
List of Tables
- Table 1: Global Digital Diagnostics System Revenue undefined Forecast, by Application 2020 & 2033
- Table 2: Global Digital Diagnostics System Revenue undefined Forecast, by Types 2020 & 2033
- Table 3: Global Digital Diagnostics System Revenue undefined Forecast, by Region 2020 & 2033
- Table 4: Global Digital Diagnostics System Revenue undefined Forecast, by Application 2020 & 2033
- Table 5: Global Digital Diagnostics System Revenue undefined Forecast, by Types 2020 & 2033
- Table 6: Global Digital Diagnostics System Revenue undefined Forecast, by Country 2020 & 2033
- Table 7: United States Digital Diagnostics System Revenue (undefined) Forecast, by Application 2020 & 2033
- Table 8: Canada Digital Diagnostics System Revenue (undefined) Forecast, by Application 2020 & 2033
- Table 9: Mexico Digital Diagnostics System Revenue (undefined) Forecast, by Application 2020 & 2033
- Table 10: Global Digital Diagnostics System Revenue undefined Forecast, by Application 2020 & 2033
- Table 11: Global Digital Diagnostics System Revenue undefined Forecast, by Types 2020 & 2033
- Table 12: Global Digital Diagnostics System Revenue undefined Forecast, by Country 2020 & 2033
- Table 13: Brazil Digital Diagnostics System Revenue (undefined) Forecast, by Application 2020 & 2033
- Table 14: Argentina Digital Diagnostics System Revenue (undefined) Forecast, by Application 2020 & 2033
- Table 15: Rest of South America Digital Diagnostics System Revenue (undefined) Forecast, by Application 2020 & 2033
- Table 16: Global Digital Diagnostics System Revenue undefined Forecast, by Application 2020 & 2033
- Table 17: Global Digital Diagnostics System Revenue undefined Forecast, by Types 2020 & 2033
- Table 18: Global Digital Diagnostics System Revenue undefined Forecast, by Country 2020 & 2033
- Table 19: United Kingdom Digital Diagnostics System Revenue (undefined) Forecast, by Application 2020 & 2033
- Table 20: Germany Digital Diagnostics System Revenue (undefined) Forecast, by Application 2020 & 2033
- Table 21: France Digital Diagnostics System Revenue (undefined) Forecast, by Application 2020 & 2033
- Table 22: Italy Digital Diagnostics System Revenue (undefined) Forecast, by Application 2020 & 2033
- Table 23: Spain Digital Diagnostics System Revenue (undefined) Forecast, by Application 2020 & 2033
- Table 24: Russia Digital Diagnostics System Revenue (undefined) Forecast, by Application 2020 & 2033
- Table 25: Benelux Digital Diagnostics System Revenue (undefined) Forecast, by Application 2020 & 2033
- Table 26: Nordics Digital Diagnostics System Revenue (undefined) Forecast, by Application 2020 & 2033
- Table 27: Rest of Europe Digital Diagnostics System Revenue (undefined) Forecast, by Application 2020 & 2033
- Table 28: Global Digital Diagnostics System Revenue undefined Forecast, by Application 2020 & 2033
- Table 29: Global Digital Diagnostics System Revenue undefined Forecast, by Types 2020 & 2033
- Table 30: Global Digital Diagnostics System Revenue undefined Forecast, by Country 2020 & 2033
- Table 31: Turkey Digital Diagnostics System Revenue (undefined) Forecast, by Application 2020 & 2033
- Table 32: Israel Digital Diagnostics System Revenue (undefined) Forecast, by Application 2020 & 2033
- Table 33: GCC Digital Diagnostics System Revenue (undefined) Forecast, by Application 2020 & 2033
- Table 34: North Africa Digital Diagnostics System Revenue (undefined) Forecast, by Application 2020 & 2033
- Table 35: South Africa Digital Diagnostics System Revenue (undefined) Forecast, by Application 2020 & 2033
- Table 36: Rest of Middle East & Africa Digital Diagnostics System Revenue (undefined) Forecast, by Application 2020 & 2033
- Table 37: Global Digital Diagnostics System Revenue undefined Forecast, by Application 2020 & 2033
- Table 38: Global Digital Diagnostics System Revenue undefined Forecast, by Types 2020 & 2033
- Table 39: Global Digital Diagnostics System Revenue undefined Forecast, by Country 2020 & 2033
- Table 40: China Digital Diagnostics System Revenue (undefined) Forecast, by Application 2020 & 2033
- Table 41: India Digital Diagnostics System Revenue (undefined) Forecast, by Application 2020 & 2033
- Table 42: Japan Digital Diagnostics System Revenue (undefined) Forecast, by Application 2020 & 2033
- Table 43: South Korea Digital Diagnostics System Revenue (undefined) Forecast, by Application 2020 & 2033
- Table 44: ASEAN Digital Diagnostics System Revenue (undefined) Forecast, by Application 2020 & 2033
- Table 45: Oceania Digital Diagnostics System Revenue (undefined) Forecast, by Application 2020 & 2033
- Table 46: Rest of Asia Pacific Digital Diagnostics System Revenue (undefined) Forecast, by Application 2020 & 2033
Frequently Asked Questions
1. What is the projected Compound Annual Growth Rate (CAGR) of the Digital Diagnostics System?
The projected CAGR is approximately 18.08%.
2. Which companies are prominent players in the Digital Diagnostics System?
Key companies in the market include Hologic, PathAI, Proscia, Aiforia, Deep Bio, Dipath, iDeepwise, LBP, F.Q pathtech, CellaVision, AIRA Matrix, Syntropy, Indica Labs, DoMore Diagnostics.
3. What are the main segments of the Digital Diagnostics System?
The market segments include Application, Types.
4. Can you provide details about the market size?
The market size is estimated to be USD XXX N/A as of 2022.
5. What are some drivers contributing to market growth?
N/A
6. What are the notable trends driving market growth?
N/A
7. Are there any restraints impacting market growth?
N/A
8. Can you provide examples of recent developments in the market?
N/A
9. What pricing options are available for accessing the report?
Pricing options include single-user, multi-user, and enterprise licenses priced at USD 4900.00, USD 7350.00, and USD 9800.00 respectively.
10. Is the market size provided in terms of value or volume?
The market size is provided in terms of value, measured in N/A.
11. Are there any specific market keywords associated with the report?
Yes, the market keyword associated with the report is "Digital Diagnostics System," which aids in identifying and referencing the specific market segment covered.
12. How do I determine which pricing option suits my needs best?
The pricing options vary based on user requirements and access needs. Individual users may opt for single-user licenses, while businesses requiring broader access may choose multi-user or enterprise licenses for cost-effective access to the report.
13. Are there any additional resources or data provided in the Digital Diagnostics System report?
While the report offers comprehensive insights, it's advisable to review the specific contents or supplementary materials provided to ascertain if additional resources or data are available.
14. How can I stay updated on further developments or reports in the Digital Diagnostics System?
To stay informed about further developments, trends, and reports in the Digital Diagnostics System, consider subscribing to industry newsletters, following relevant companies and organizations, or regularly checking reputable industry news sources and publications.
Methodology
Step 1 - Identification of Relevant Samples Size from Population Database


Step 2 - Approaches for Defining Global Market Size (Value, Volume* & Price*)

Note*: In applicable scenarios
Step 3 - Data Sources
Primary Research
- Web Analytics
- Survey Reports
- Research Institute
- Latest Research Reports
- Opinion Leaders
Secondary Research
- Annual Reports
- White Paper
- Latest Press Release
- Industry Association
- Paid Database
- Investor Presentations

Step 4 - Data Triangulation
Involves using different sources of information in order to increase the validity of a study
These sources are likely to be stakeholders in a program - participants, other researchers, program staff, other community members, and so on.
Then we put all data in single framework & apply various statistical tools to find out the dynamic on the market.
During the analysis stage, feedback from the stakeholder groups would be compared to determine areas of agreement as well as areas of divergence