
Key Insights
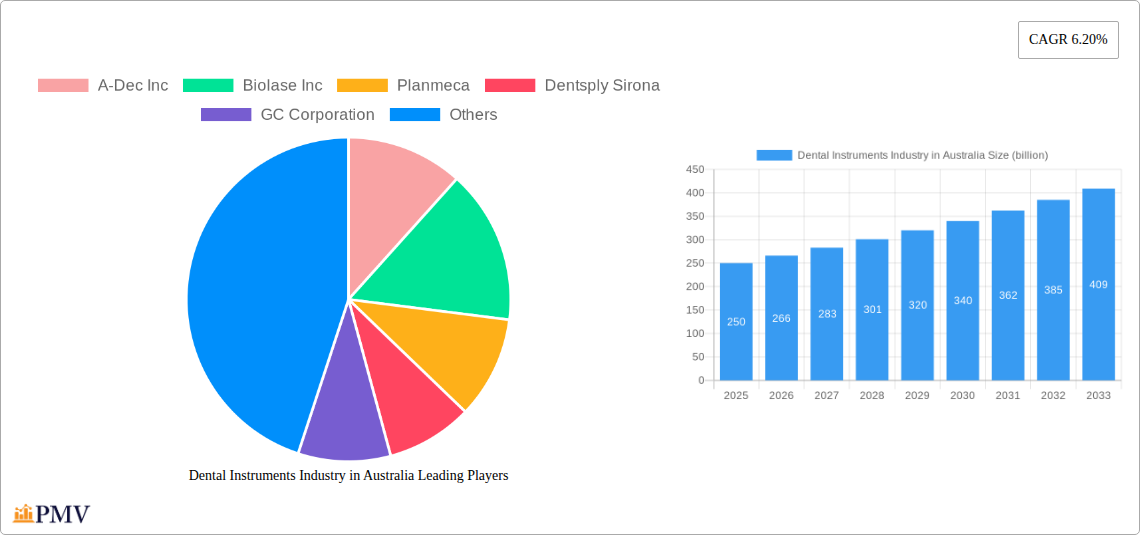
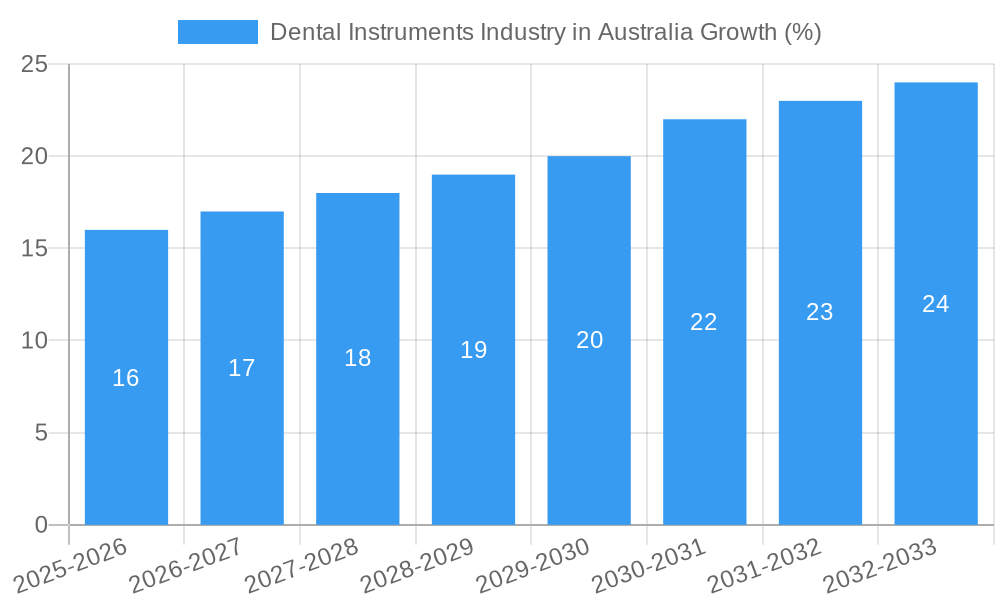
The Australian dental instruments market, valued at approximately $250 million in 2025, is projected to experience robust growth, exhibiting a Compound Annual Growth Rate (CAGR) of 6.2% from 2025 to 2033. This expansion is driven by several key factors. Firstly, the rising prevalence of dental diseases, coupled with an aging population requiring more extensive dental care, fuels demand for advanced instruments and procedures. Secondly, technological advancements, particularly in dental lasers (soft tissue and hard tissue) and digital imaging, are enhancing treatment efficiency and accuracy, leading to wider adoption. The increasing adoption of minimally invasive techniques and a growing preference for cosmetic dentistry further contribute to market growth. Growth is segmented across various product categories, including general and diagnostic equipment, dental consumables, and dental lasers. Orthodontics, endodontics, and periodontics represent significant treatment segments driving demand. Key players like A-Dec Inc, Biolase Inc, and Dentsply Sirona are strategically positioned to capitalize on this expanding market through innovation and distribution network expansion. However, factors such as high equipment costs and stringent regulatory requirements could pose some challenges to market expansion. The market is primarily driven by hospitals and clinics but is also seeing increasing demand from smaller private practices.
Despite the positive outlook, the market faces certain restraints. The relatively high cost of advanced dental instruments, especially lasers and digital imaging systems, can limit accessibility for smaller dental practices. Furthermore, strict regulatory approvals and compliance requirements for new technologies can slow down market penetration. Competitive pressures from both domestic and international players further shape the market landscape. Nevertheless, the long-term growth prospects remain promising, driven by an aging population, increasing dental awareness, and continuous technological improvements in dental instruments. The market segmentation across products (lasers, consumables, equipment) and treatments (orthodontics, endodontics, etc.) allows for targeted marketing strategies and the development of specific product offerings catering to the unique needs of diverse dental practices.
Dental Instruments Industry in Australia: A Comprehensive Market Report (2019-2033)
This comprehensive report provides a detailed analysis of the Australian dental instruments market, encompassing market size, segmentation, competitive landscape, and future growth projections. Valued at billions of AUD, the market presents significant opportunities for investors and industry participants. The study period covers 2019-2033, with 2025 as the base and estimated year. This report offers actionable insights and forecasts for the period 2025-2033, building upon historical data from 2019-2024.
Dental Instruments Industry in Australia Market Structure & Competitive Dynamics
The Australian dental instruments market exhibits a moderately concentrated structure, with key players like Dentsply Sirona, 3M Company, Planmeca, and KaVo Dental holding significant market share. The exact market share for each player is xx% in 2025, and the market concentration ratio (CR4) is estimated at xx%. Innovation within the sector is driven by technological advancements in digital dentistry, CAD/CAM technologies, and laser dentistry. The regulatory framework, governed by the Therapeutic Goods Administration (TGA), influences product approvals and market access. Product substitutes, such as less technologically advanced instruments, exist but face competition from higher-quality, efficient alternatives. End-user trends reveal a growing preference for minimally invasive procedures and advanced diagnostic tools. M&A activity within the Australian dental instruments market has been relatively moderate in recent years, with deal values totaling approximately xx billion AUD over the past five years. Key factors driving M&A activity include expansion into new segments, technological acquisition, and access to distribution networks.
Dental Instruments Industry in Australia Industry Trends & Insights
The Australian dental instruments market is experiencing robust growth, driven by several key factors. Increased awareness of oral health, a rising elderly population with greater dental needs, and rising disposable incomes are all contributing to market expansion. The Compound Annual Growth Rate (CAGR) is projected at xx% during the forecast period (2025-2033). Technological advancements, such as the adoption of digital dentistry and AI-powered diagnostic tools, are transforming the sector, improving efficiency, accuracy, and patient experience. Consumer preferences are shifting toward minimally invasive procedures, advanced materials, and aesthetically pleasing outcomes. Competitive dynamics are shaped by the ongoing innovation and the introduction of new products and technologies. Market penetration of digital dental technologies is increasing steadily, with an estimated xx% market penetration in 2025, projected to reach xx% by 2033.
Dominant Markets & Segments in Dental Instruments Industry in Australia
- Leading Product Segment: General and Diagnostics Equipment holds the largest market share, driven by high demand for routine dental procedures and diagnostic tools. This segment’s growth is further fueled by increasing dental tourism and the rising number of dental practices.
- Leading Treatment Segment: Orthodontics represents a significant segment due to the increasing prevalence of malocclusion and growing awareness of cosmetic dentistry. The segment benefits from technological advancements in clear aligners and other orthodontic solutions.
- Dominant End-User: Clinics constitute the largest end-user segment due to their widespread presence and the majority of dental treatments being conducted in them. This segment’s dominance is reinforced by increasing investments in the clinics’ infrastructure and technological advancement.
- Key Drivers:
- Growing government initiatives focusing on improving access to affordable dental care.
- Increasing investments in dental infrastructure.
- The rise in dental tourism within the country.
The dominance of these segments is attributed to factors like economic growth, increasing healthcare expenditure, and the rising prevalence of oral health issues.
Dental Instruments Industry in Australia Product Innovations
Recent innovations focus on digital dentistry, including CAD/CAM systems for creating custom restorations and intraoral scanners for precise imaging. These technologies improve accuracy, efficiency, and patient comfort. Laser dentistry, offering minimally invasive procedures, is gaining traction with the introduction of more versatile and user-friendly systems, including soft tissue and hard tissue lasers. The market is witnessing the emergence of smart dental instruments that incorporate data analytics and connectivity, thereby facilitating better treatment planning and monitoring. These innovations are driving market growth and enhancing competitive advantages for manufacturers.
Report Segmentation & Scope
This report segments the Australian dental instruments market by product (General and Diagnostics Equipment, Dental Lasers – Soft Tissue Lasers, Hard Tissue Lasers; Other General and Diagnostic Equipment; Dental Consumables; Other Dental Devices), treatment (Orthodontics, Endodontics, Periodontics, Prosthodontics, Other Treatments), and end-user (Hospitals, Clinics, Other End Users). Each segment’s market size, growth projections, and competitive dynamics are analyzed in detail. For example, the Dental Lasers segment shows a strong growth outlook driven by increasing adoption in minimally invasive procedures; the Dental Consumables segment displays steady growth mirroring overall market trends, whereas the Hospitals end-user segment shows comparatively slower growth compared to Clinics.
Key Drivers of Dental Instruments Industry in Australia Growth
Several factors are driving the growth of the Australian dental instruments market. Technological advancements, such as the adoption of digital dentistry and AI, are improving efficiency and patient outcomes. Economic factors, including rising disposable incomes and increased healthcare expenditure, are boosting demand. Government initiatives to improve oral healthcare access, including potential universal dental care, as demonstrated by the AUD 77.6 billion proposal by the Australian Greens, further propel market growth.
Challenges in the Dental Instruments Industry in Australia Sector
The Australian dental instruments market faces several challenges. Regulatory hurdles for product approval and reimbursement can delay market entry for new technologies. Supply chain disruptions, particularly in the wake of global events, can impact product availability and pricing. Intense competition, both domestic and international, necessitates continuous innovation and efficient cost management. These factors collectively affect the market’s overall growth and profitability.
Leading Players in the Dental Instruments Industry in Australia Market
- A-Dec Inc
- Biolase Inc
- Planmeca
- Dentsply Sirona
- GC Corporation
- 3M Company
- Envista Holdings Corporation
- Carestream Health Inc
- KaVo Dental
Key Developments in Dental Instruments Industry in Australia Sector
- April 2022: The Australian Greens proposed a universal dental policy with AUD 77.6 billion in funding, significantly impacting market potential and accessibility.
- March 2023: Dental Implants clinic in Joondalup launched a new user-friendly website, showcasing the growing focus on digital marketing and patient experience within the industry.
Strategic Dental Instruments Industry in Australia Market Outlook
The Australian dental instruments market exhibits substantial growth potential driven by ongoing technological advancements, rising awareness of oral health, and government support for accessible dental care. Strategic opportunities exist in developing innovative products addressing unmet needs, expanding distribution networks, and capitalizing on the growing adoption of digital dentistry and minimally invasive procedures. The market is poised for expansion, offering lucrative opportunities for both established players and new entrants alike.
Dental Instruments Industry in Australia Segmentation
-
1. Product
-
1.1. General and Diagnostics Equipment
-
1.1.1. Dental Lasers
- 1.1.1.1. Soft Tissue Lasers
- 1.1.1.2. Hard Tissue Lasers
- 1.1.2. Radiology Equipment
- 1.1.3. Dental Chair and Equipment
- 1.1.4. Other General and Diagnostic Equipment
-
1.1.1. Dental Lasers
-
1.2. Dental Consumables
- 1.2.1. Dental Biomaterial
- 1.2.2. Dental Implants
- 1.2.3. Crowns and Bridges
- 1.2.4. Other Dental Consumables
- 1.3. Other Dental Devices
-
1.1. General and Diagnostics Equipment
-
2. Treatment
- 2.1. Orthodontics
- 2.2. Endodontics
- 2.3. Periodontics
- 2.4. Prosthodontics
- 2.5. Other Treatments
-
3. End User
- 3.1. Hospitals
- 3.2. Clinics
- 3.3. Other End Users
Dental Instruments Industry in Australia Segmentation By Geography
-
1. North America
- 1.1. United States
- 1.2. Canada
- 1.3. Mexico
-
2. South America
- 2.1. Brazil
- 2.2. Argentina
- 2.3. Rest of South America
-
3. Europe
- 3.1. United Kingdom
- 3.2. Germany
- 3.3. France
- 3.4. Italy
- 3.5. Spain
- 3.6. Russia
- 3.7. Benelux
- 3.8. Nordics
- 3.9. Rest of Europe
-
4. Middle East & Africa
- 4.1. Turkey
- 4.2. Israel
- 4.3. GCC
- 4.4. North Africa
- 4.5. South Africa
- 4.6. Rest of Middle East & Africa
-
5. Asia Pacific
- 5.1. China
- 5.2. India
- 5.3. Japan
- 5.4. South Korea
- 5.5. ASEAN
- 5.6. Oceania
- 5.7. Rest of Asia Pacific
Dental Instruments Industry in Australia REPORT HIGHLIGHTS
| Aspects | Details |
|---|---|
| Study Period | 2019-2033 |
| Base Year | 2024 |
| Estimated Year | 2025 |
| Forecast Period | 2025-2033 |
| Historical Period | 2019-2024 |
| Growth Rate | CAGR of 6.20% from 2019-2033 |
| Segmentation |
|
Table of Contents
- 1. Introduction
- 1.1. Research Scope
- 1.2. Market Segmentation
- 1.3. Research Methodology
- 1.4. Definitions and Assumptions
- 2. Executive Summary
- 2.1. Introduction
- 3. Market Dynamics
- 3.1. Introduction
- 3.2. Market Drivers
- 3.2.1 Increasing awareness of oral hygiene and preventive dental care has led to more frequent dental visits in Australia. This has driven demand for high-quality dental instruments used in routine procedures such as cleanings
- 3.2.2 fillings
- 3.2.3 and extractions
- 3.3. Market Restrains
- 3.3.1 The cost of high-quality dental instruments can be a barrier for smaller dental practices. This is especially true for high-tech instruments such as lasers
- 3.3.2 CAD/CAM systems
- 3.3.3 and digital imaging tools
- 3.4. Market Trends
- 3.4.1 The adoption of digital tools such as intraoral scanners
- 3.4.2 CAD/CAM systems
- 3.4.3 and 3D printing is expected to grow. These tools enhance precision
- 3.4.4 efficiency
- 3.4.5 and patient outcomes
- 3.4.6 driving demand for compatible dental instrument
- 4. Market Factor Analysis
- 4.1. Porters Five Forces
- 4.2. Supply/Value Chain
- 4.3. PESTEL analysis
- 4.4. Market Entropy
- 4.5. Patent/Trademark Analysis
- 5. Global Dental Instruments Industry in Australia Analysis, Insights and Forecast, 2019-2031
- 5.1. Market Analysis, Insights and Forecast - by Product
- 5.1.1. General and Diagnostics Equipment
- 5.1.1.1. Dental Lasers
- 5.1.1.1.1. Soft Tissue Lasers
- 5.1.1.1.2. Hard Tissue Lasers
- 5.1.1.2. Radiology Equipment
- 5.1.1.3. Dental Chair and Equipment
- 5.1.1.4. Other General and Diagnostic Equipment
- 5.1.1.1. Dental Lasers
- 5.1.2. Dental Consumables
- 5.1.2.1. Dental Biomaterial
- 5.1.2.2. Dental Implants
- 5.1.2.3. Crowns and Bridges
- 5.1.2.4. Other Dental Consumables
- 5.1.3. Other Dental Devices
- 5.1.1. General and Diagnostics Equipment
- 5.2. Market Analysis, Insights and Forecast - by Treatment
- 5.2.1. Orthodontics
- 5.2.2. Endodontics
- 5.2.3. Periodontics
- 5.2.4. Prosthodontics
- 5.2.5. Other Treatments
- 5.3. Market Analysis, Insights and Forecast - by End User
- 5.3.1. Hospitals
- 5.3.2. Clinics
- 5.3.3. Other End Users
- 5.4. Market Analysis, Insights and Forecast - by Region
- 5.4.1. North America
- 5.4.2. South America
- 5.4.3. Europe
- 5.4.4. Middle East & Africa
- 5.4.5. Asia Pacific
- 5.1. Market Analysis, Insights and Forecast - by Product
- 6. North America Dental Instruments Industry in Australia Analysis, Insights and Forecast, 2019-2031
- 6.1. Market Analysis, Insights and Forecast - by Product
- 6.1.1. General and Diagnostics Equipment
- 6.1.1.1. Dental Lasers
- 6.1.1.1.1. Soft Tissue Lasers
- 6.1.1.1.2. Hard Tissue Lasers
- 6.1.1.2. Radiology Equipment
- 6.1.1.3. Dental Chair and Equipment
- 6.1.1.4. Other General and Diagnostic Equipment
- 6.1.1.1. Dental Lasers
- 6.1.2. Dental Consumables
- 6.1.2.1. Dental Biomaterial
- 6.1.2.2. Dental Implants
- 6.1.2.3. Crowns and Bridges
- 6.1.2.4. Other Dental Consumables
- 6.1.3. Other Dental Devices
- 6.1.1. General and Diagnostics Equipment
- 6.2. Market Analysis, Insights and Forecast - by Treatment
- 6.2.1. Orthodontics
- 6.2.2. Endodontics
- 6.2.3. Periodontics
- 6.2.4. Prosthodontics
- 6.2.5. Other Treatments
- 6.3. Market Analysis, Insights and Forecast - by End User
- 6.3.1. Hospitals
- 6.3.2. Clinics
- 6.3.3. Other End Users
- 6.1. Market Analysis, Insights and Forecast - by Product
- 7. South America Dental Instruments Industry in Australia Analysis, Insights and Forecast, 2019-2031
- 7.1. Market Analysis, Insights and Forecast - by Product
- 7.1.1. General and Diagnostics Equipment
- 7.1.1.1. Dental Lasers
- 7.1.1.1.1. Soft Tissue Lasers
- 7.1.1.1.2. Hard Tissue Lasers
- 7.1.1.2. Radiology Equipment
- 7.1.1.3. Dental Chair and Equipment
- 7.1.1.4. Other General and Diagnostic Equipment
- 7.1.1.1. Dental Lasers
- 7.1.2. Dental Consumables
- 7.1.2.1. Dental Biomaterial
- 7.1.2.2. Dental Implants
- 7.1.2.3. Crowns and Bridges
- 7.1.2.4. Other Dental Consumables
- 7.1.3. Other Dental Devices
- 7.1.1. General and Diagnostics Equipment
- 7.2. Market Analysis, Insights and Forecast - by Treatment
- 7.2.1. Orthodontics
- 7.2.2. Endodontics
- 7.2.3. Periodontics
- 7.2.4. Prosthodontics
- 7.2.5. Other Treatments
- 7.3. Market Analysis, Insights and Forecast - by End User
- 7.3.1. Hospitals
- 7.3.2. Clinics
- 7.3.3. Other End Users
- 7.1. Market Analysis, Insights and Forecast - by Product
- 8. Europe Dental Instruments Industry in Australia Analysis, Insights and Forecast, 2019-2031
- 8.1. Market Analysis, Insights and Forecast - by Product
- 8.1.1. General and Diagnostics Equipment
- 8.1.1.1. Dental Lasers
- 8.1.1.1.1. Soft Tissue Lasers
- 8.1.1.1.2. Hard Tissue Lasers
- 8.1.1.2. Radiology Equipment
- 8.1.1.3. Dental Chair and Equipment
- 8.1.1.4. Other General and Diagnostic Equipment
- 8.1.1.1. Dental Lasers
- 8.1.2. Dental Consumables
- 8.1.2.1. Dental Biomaterial
- 8.1.2.2. Dental Implants
- 8.1.2.3. Crowns and Bridges
- 8.1.2.4. Other Dental Consumables
- 8.1.3. Other Dental Devices
- 8.1.1. General and Diagnostics Equipment
- 8.2. Market Analysis, Insights and Forecast - by Treatment
- 8.2.1. Orthodontics
- 8.2.2. Endodontics
- 8.2.3. Periodontics
- 8.2.4. Prosthodontics
- 8.2.5. Other Treatments
- 8.3. Market Analysis, Insights and Forecast - by End User
- 8.3.1. Hospitals
- 8.3.2. Clinics
- 8.3.3. Other End Users
- 8.1. Market Analysis, Insights and Forecast - by Product
- 9. Middle East & Africa Dental Instruments Industry in Australia Analysis, Insights and Forecast, 2019-2031
- 9.1. Market Analysis, Insights and Forecast - by Product
- 9.1.1. General and Diagnostics Equipment
- 9.1.1.1. Dental Lasers
- 9.1.1.1.1. Soft Tissue Lasers
- 9.1.1.1.2. Hard Tissue Lasers
- 9.1.1.2. Radiology Equipment
- 9.1.1.3. Dental Chair and Equipment
- 9.1.1.4. Other General and Diagnostic Equipment
- 9.1.1.1. Dental Lasers
- 9.1.2. Dental Consumables
- 9.1.2.1. Dental Biomaterial
- 9.1.2.2. Dental Implants
- 9.1.2.3. Crowns and Bridges
- 9.1.2.4. Other Dental Consumables
- 9.1.3. Other Dental Devices
- 9.1.1. General and Diagnostics Equipment
- 9.2. Market Analysis, Insights and Forecast - by Treatment
- 9.2.1. Orthodontics
- 9.2.2. Endodontics
- 9.2.3. Periodontics
- 9.2.4. Prosthodontics
- 9.2.5. Other Treatments
- 9.3. Market Analysis, Insights and Forecast - by End User
- 9.3.1. Hospitals
- 9.3.2. Clinics
- 9.3.3. Other End Users
- 9.1. Market Analysis, Insights and Forecast - by Product
- 10. Asia Pacific Dental Instruments Industry in Australia Analysis, Insights and Forecast, 2019-2031
- 10.1. Market Analysis, Insights and Forecast - by Product
- 10.1.1. General and Diagnostics Equipment
- 10.1.1.1. Dental Lasers
- 10.1.1.1.1. Soft Tissue Lasers
- 10.1.1.1.2. Hard Tissue Lasers
- 10.1.1.2. Radiology Equipment
- 10.1.1.3. Dental Chair and Equipment
- 10.1.1.4. Other General and Diagnostic Equipment
- 10.1.1.1. Dental Lasers
- 10.1.2. Dental Consumables
- 10.1.2.1. Dental Biomaterial
- 10.1.2.2. Dental Implants
- 10.1.2.3. Crowns and Bridges
- 10.1.2.4. Other Dental Consumables
- 10.1.3. Other Dental Devices
- 10.1.1. General and Diagnostics Equipment
- 10.2. Market Analysis, Insights and Forecast - by Treatment
- 10.2.1. Orthodontics
- 10.2.2. Endodontics
- 10.2.3. Periodontics
- 10.2.4. Prosthodontics
- 10.2.5. Other Treatments
- 10.3. Market Analysis, Insights and Forecast - by End User
- 10.3.1. Hospitals
- 10.3.2. Clinics
- 10.3.3. Other End Users
- 10.1. Market Analysis, Insights and Forecast - by Product
- 11. Competitive Analysis
- 11.1. Global Market Share Analysis 2024
- 11.2. Company Profiles
- 11.2.1 A-Dec Inc
- 11.2.1.1. Overview
- 11.2.1.2. Products
- 11.2.1.3. SWOT Analysis
- 11.2.1.4. Recent Developments
- 11.2.1.5. Financials (Based on Availability)
- 11.2.2 Biolase Inc
- 11.2.2.1. Overview
- 11.2.2.2. Products
- 11.2.2.3. SWOT Analysis
- 11.2.2.4. Recent Developments
- 11.2.2.5. Financials (Based on Availability)
- 11.2.3 Planmeca
- 11.2.3.1. Overview
- 11.2.3.2. Products
- 11.2.3.3. SWOT Analysis
- 11.2.3.4. Recent Developments
- 11.2.3.5. Financials (Based on Availability)
- 11.2.4 Dentsply Sirona
- 11.2.4.1. Overview
- 11.2.4.2. Products
- 11.2.4.3. SWOT Analysis
- 11.2.4.4. Recent Developments
- 11.2.4.5. Financials (Based on Availability)
- 11.2.5 GC Corporation
- 11.2.5.1. Overview
- 11.2.5.2. Products
- 11.2.5.3. SWOT Analysis
- 11.2.5.4. Recent Developments
- 11.2.5.5. Financials (Based on Availability)
- 11.2.6 3M Company
- 11.2.6.1. Overview
- 11.2.6.2. Products
- 11.2.6.3. SWOT Analysis
- 11.2.6.4. Recent Developments
- 11.2.6.5. Financials (Based on Availability)
- 11.2.7 Envista Holdings Corporation
- 11.2.7.1. Overview
- 11.2.7.2. Products
- 11.2.7.3. SWOT Analysis
- 11.2.7.4. Recent Developments
- 11.2.7.5. Financials (Based on Availability)
- 11.2.8 Carestream Health Inc
- 11.2.8.1. Overview
- 11.2.8.2. Products
- 11.2.8.3. SWOT Analysis
- 11.2.8.4. Recent Developments
- 11.2.8.5. Financials (Based on Availability)
- 11.2.9 KaVo Dental
- 11.2.9.1. Overview
- 11.2.9.2. Products
- 11.2.9.3. SWOT Analysis
- 11.2.9.4. Recent Developments
- 11.2.9.5. Financials (Based on Availability)
- 11.2.1 A-Dec Inc
List of Figures
- Figure 1: Global Dental Instruments Industry in Australia Revenue Breakdown (billion, %) by Region 2024 & 2032
- Figure 2: Global Dental Instruments Industry in Australia Volume Breakdown (K Units, %) by Region 2024 & 2032
- Figure 3: Australia Dental Instruments Industry in Australia Revenue (billion), by Country 2024 & 2032
- Figure 4: Australia Dental Instruments Industry in Australia Volume (K Units), by Country 2024 & 2032
- Figure 5: Australia Dental Instruments Industry in Australia Revenue Share (%), by Country 2024 & 2032
- Figure 6: Australia Dental Instruments Industry in Australia Volume Share (%), by Country 2024 & 2032
- Figure 7: North America Dental Instruments Industry in Australia Revenue (billion), by Product 2024 & 2032
- Figure 8: North America Dental Instruments Industry in Australia Volume (K Units), by Product 2024 & 2032
- Figure 9: North America Dental Instruments Industry in Australia Revenue Share (%), by Product 2024 & 2032
- Figure 10: North America Dental Instruments Industry in Australia Volume Share (%), by Product 2024 & 2032
- Figure 11: North America Dental Instruments Industry in Australia Revenue (billion), by Treatment 2024 & 2032
- Figure 12: North America Dental Instruments Industry in Australia Volume (K Units), by Treatment 2024 & 2032
- Figure 13: North America Dental Instruments Industry in Australia Revenue Share (%), by Treatment 2024 & 2032
- Figure 14: North America Dental Instruments Industry in Australia Volume Share (%), by Treatment 2024 & 2032
- Figure 15: North America Dental Instruments Industry in Australia Revenue (billion), by End User 2024 & 2032
- Figure 16: North America Dental Instruments Industry in Australia Volume (K Units), by End User 2024 & 2032
- Figure 17: North America Dental Instruments Industry in Australia Revenue Share (%), by End User 2024 & 2032
- Figure 18: North America Dental Instruments Industry in Australia Volume Share (%), by End User 2024 & 2032
- Figure 19: North America Dental Instruments Industry in Australia Revenue (billion), by Country 2024 & 2032
- Figure 20: North America Dental Instruments Industry in Australia Volume (K Units), by Country 2024 & 2032
- Figure 21: North America Dental Instruments Industry in Australia Revenue Share (%), by Country 2024 & 2032
- Figure 22: North America Dental Instruments Industry in Australia Volume Share (%), by Country 2024 & 2032
- Figure 23: South America Dental Instruments Industry in Australia Revenue (billion), by Product 2024 & 2032
- Figure 24: South America Dental Instruments Industry in Australia Volume (K Units), by Product 2024 & 2032
- Figure 25: South America Dental Instruments Industry in Australia Revenue Share (%), by Product 2024 & 2032
- Figure 26: South America Dental Instruments Industry in Australia Volume Share (%), by Product 2024 & 2032
- Figure 27: South America Dental Instruments Industry in Australia Revenue (billion), by Treatment 2024 & 2032
- Figure 28: South America Dental Instruments Industry in Australia Volume (K Units), by Treatment 2024 & 2032
- Figure 29: South America Dental Instruments Industry in Australia Revenue Share (%), by Treatment 2024 & 2032
- Figure 30: South America Dental Instruments Industry in Australia Volume Share (%), by Treatment 2024 & 2032
- Figure 31: South America Dental Instruments Industry in Australia Revenue (billion), by End User 2024 & 2032
- Figure 32: South America Dental Instruments Industry in Australia Volume (K Units), by End User 2024 & 2032
- Figure 33: South America Dental Instruments Industry in Australia Revenue Share (%), by End User 2024 & 2032
- Figure 34: South America Dental Instruments Industry in Australia Volume Share (%), by End User 2024 & 2032
- Figure 35: South America Dental Instruments Industry in Australia Revenue (billion), by Country 2024 & 2032
- Figure 36: South America Dental Instruments Industry in Australia Volume (K Units), by Country 2024 & 2032
- Figure 37: South America Dental Instruments Industry in Australia Revenue Share (%), by Country 2024 & 2032
- Figure 38: South America Dental Instruments Industry in Australia Volume Share (%), by Country 2024 & 2032
- Figure 39: Europe Dental Instruments Industry in Australia Revenue (billion), by Product 2024 & 2032
- Figure 40: Europe Dental Instruments Industry in Australia Volume (K Units), by Product 2024 & 2032
- Figure 41: Europe Dental Instruments Industry in Australia Revenue Share (%), by Product 2024 & 2032
- Figure 42: Europe Dental Instruments Industry in Australia Volume Share (%), by Product 2024 & 2032
- Figure 43: Europe Dental Instruments Industry in Australia Revenue (billion), by Treatment 2024 & 2032
- Figure 44: Europe Dental Instruments Industry in Australia Volume (K Units), by Treatment 2024 & 2032
- Figure 45: Europe Dental Instruments Industry in Australia Revenue Share (%), by Treatment 2024 & 2032
- Figure 46: Europe Dental Instruments Industry in Australia Volume Share (%), by Treatment 2024 & 2032
- Figure 47: Europe Dental Instruments Industry in Australia Revenue (billion), by End User 2024 & 2032
- Figure 48: Europe Dental Instruments Industry in Australia Volume (K Units), by End User 2024 & 2032
- Figure 49: Europe Dental Instruments Industry in Australia Revenue Share (%), by End User 2024 & 2032
- Figure 50: Europe Dental Instruments Industry in Australia Volume Share (%), by End User 2024 & 2032
- Figure 51: Europe Dental Instruments Industry in Australia Revenue (billion), by Country 2024 & 2032
- Figure 52: Europe Dental Instruments Industry in Australia Volume (K Units), by Country 2024 & 2032
- Figure 53: Europe Dental Instruments Industry in Australia Revenue Share (%), by Country 2024 & 2032
- Figure 54: Europe Dental Instruments Industry in Australia Volume Share (%), by Country 2024 & 2032
- Figure 55: Middle East & Africa Dental Instruments Industry in Australia Revenue (billion), by Product 2024 & 2032
- Figure 56: Middle East & Africa Dental Instruments Industry in Australia Volume (K Units), by Product 2024 & 2032
- Figure 57: Middle East & Africa Dental Instruments Industry in Australia Revenue Share (%), by Product 2024 & 2032
- Figure 58: Middle East & Africa Dental Instruments Industry in Australia Volume Share (%), by Product 2024 & 2032
- Figure 59: Middle East & Africa Dental Instruments Industry in Australia Revenue (billion), by Treatment 2024 & 2032
- Figure 60: Middle East & Africa Dental Instruments Industry in Australia Volume (K Units), by Treatment 2024 & 2032
- Figure 61: Middle East & Africa Dental Instruments Industry in Australia Revenue Share (%), by Treatment 2024 & 2032
- Figure 62: Middle East & Africa Dental Instruments Industry in Australia Volume Share (%), by Treatment 2024 & 2032
- Figure 63: Middle East & Africa Dental Instruments Industry in Australia Revenue (billion), by End User 2024 & 2032
- Figure 64: Middle East & Africa Dental Instruments Industry in Australia Volume (K Units), by End User 2024 & 2032
- Figure 65: Middle East & Africa Dental Instruments Industry in Australia Revenue Share (%), by End User 2024 & 2032
- Figure 66: Middle East & Africa Dental Instruments Industry in Australia Volume Share (%), by End User 2024 & 2032
- Figure 67: Middle East & Africa Dental Instruments Industry in Australia Revenue (billion), by Country 2024 & 2032
- Figure 68: Middle East & Africa Dental Instruments Industry in Australia Volume (K Units), by Country 2024 & 2032
- Figure 69: Middle East & Africa Dental Instruments Industry in Australia Revenue Share (%), by Country 2024 & 2032
- Figure 70: Middle East & Africa Dental Instruments Industry in Australia Volume Share (%), by Country 2024 & 2032
- Figure 71: Asia Pacific Dental Instruments Industry in Australia Revenue (billion), by Product 2024 & 2032
- Figure 72: Asia Pacific Dental Instruments Industry in Australia Volume (K Units), by Product 2024 & 2032
- Figure 73: Asia Pacific Dental Instruments Industry in Australia Revenue Share (%), by Product 2024 & 2032
- Figure 74: Asia Pacific Dental Instruments Industry in Australia Volume Share (%), by Product 2024 & 2032
- Figure 75: Asia Pacific Dental Instruments Industry in Australia Revenue (billion), by Treatment 2024 & 2032
- Figure 76: Asia Pacific Dental Instruments Industry in Australia Volume (K Units), by Treatment 2024 & 2032
- Figure 77: Asia Pacific Dental Instruments Industry in Australia Revenue Share (%), by Treatment 2024 & 2032
- Figure 78: Asia Pacific Dental Instruments Industry in Australia Volume Share (%), by Treatment 2024 & 2032
- Figure 79: Asia Pacific Dental Instruments Industry in Australia Revenue (billion), by End User 2024 & 2032
- Figure 80: Asia Pacific Dental Instruments Industry in Australia Volume (K Units), by End User 2024 & 2032
- Figure 81: Asia Pacific Dental Instruments Industry in Australia Revenue Share (%), by End User 2024 & 2032
- Figure 82: Asia Pacific Dental Instruments Industry in Australia Volume Share (%), by End User 2024 & 2032
- Figure 83: Asia Pacific Dental Instruments Industry in Australia Revenue (billion), by Country 2024 & 2032
- Figure 84: Asia Pacific Dental Instruments Industry in Australia Volume (K Units), by Country 2024 & 2032
- Figure 85: Asia Pacific Dental Instruments Industry in Australia Revenue Share (%), by Country 2024 & 2032
- Figure 86: Asia Pacific Dental Instruments Industry in Australia Volume Share (%), by Country 2024 & 2032
List of Tables
- Table 1: Global Dental Instruments Industry in Australia Revenue billion Forecast, by Region 2019 & 2032
- Table 2: Global Dental Instruments Industry in Australia Volume K Units Forecast, by Region 2019 & 2032
- Table 3: Global Dental Instruments Industry in Australia Revenue billion Forecast, by Product 2019 & 2032
- Table 4: Global Dental Instruments Industry in Australia Volume K Units Forecast, by Product 2019 & 2032
- Table 5: Global Dental Instruments Industry in Australia Revenue billion Forecast, by Treatment 2019 & 2032
- Table 6: Global Dental Instruments Industry in Australia Volume K Units Forecast, by Treatment 2019 & 2032
- Table 7: Global Dental Instruments Industry in Australia Revenue billion Forecast, by End User 2019 & 2032
- Table 8: Global Dental Instruments Industry in Australia Volume K Units Forecast, by End User 2019 & 2032
- Table 9: Global Dental Instruments Industry in Australia Revenue billion Forecast, by Region 2019 & 2032
- Table 10: Global Dental Instruments Industry in Australia Volume K Units Forecast, by Region 2019 & 2032
- Table 11: Global Dental Instruments Industry in Australia Revenue billion Forecast, by Country 2019 & 2032
- Table 12: Global Dental Instruments Industry in Australia Volume K Units Forecast, by Country 2019 & 2032
- Table 13: Global Dental Instruments Industry in Australia Revenue billion Forecast, by Product 2019 & 2032
- Table 14: Global Dental Instruments Industry in Australia Volume K Units Forecast, by Product 2019 & 2032
- Table 15: Global Dental Instruments Industry in Australia Revenue billion Forecast, by Treatment 2019 & 2032
- Table 16: Global Dental Instruments Industry in Australia Volume K Units Forecast, by Treatment 2019 & 2032
- Table 17: Global Dental Instruments Industry in Australia Revenue billion Forecast, by End User 2019 & 2032
- Table 18: Global Dental Instruments Industry in Australia Volume K Units Forecast, by End User 2019 & 2032
- Table 19: Global Dental Instruments Industry in Australia Revenue billion Forecast, by Country 2019 & 2032
- Table 20: Global Dental Instruments Industry in Australia Volume K Units Forecast, by Country 2019 & 2032
- Table 21: United States Dental Instruments Industry in Australia Revenue (billion) Forecast, by Application 2019 & 2032
- Table 22: United States Dental Instruments Industry in Australia Volume (K Units) Forecast, by Application 2019 & 2032
- Table 23: Canada Dental Instruments Industry in Australia Revenue (billion) Forecast, by Application 2019 & 2032
- Table 24: Canada Dental Instruments Industry in Australia Volume (K Units) Forecast, by Application 2019 & 2032
- Table 25: Mexico Dental Instruments Industry in Australia Revenue (billion) Forecast, by Application 2019 & 2032
- Table 26: Mexico Dental Instruments Industry in Australia Volume (K Units) Forecast, by Application 2019 & 2032
- Table 27: Global Dental Instruments Industry in Australia Revenue billion Forecast, by Product 2019 & 2032
- Table 28: Global Dental Instruments Industry in Australia Volume K Units Forecast, by Product 2019 & 2032
- Table 29: Global Dental Instruments Industry in Australia Revenue billion Forecast, by Treatment 2019 & 2032
- Table 30: Global Dental Instruments Industry in Australia Volume K Units Forecast, by Treatment 2019 & 2032
- Table 31: Global Dental Instruments Industry in Australia Revenue billion Forecast, by End User 2019 & 2032
- Table 32: Global Dental Instruments Industry in Australia Volume K Units Forecast, by End User 2019 & 2032
- Table 33: Global Dental Instruments Industry in Australia Revenue billion Forecast, by Country 2019 & 2032
- Table 34: Global Dental Instruments Industry in Australia Volume K Units Forecast, by Country 2019 & 2032
- Table 35: Brazil Dental Instruments Industry in Australia Revenue (billion) Forecast, by Application 2019 & 2032
- Table 36: Brazil Dental Instruments Industry in Australia Volume (K Units) Forecast, by Application 2019 & 2032
- Table 37: Argentina Dental Instruments Industry in Australia Revenue (billion) Forecast, by Application 2019 & 2032
- Table 38: Argentina Dental Instruments Industry in Australia Volume (K Units) Forecast, by Application 2019 & 2032
- Table 39: Rest of South America Dental Instruments Industry in Australia Revenue (billion) Forecast, by Application 2019 & 2032
- Table 40: Rest of South America Dental Instruments Industry in Australia Volume (K Units) Forecast, by Application 2019 & 2032
- Table 41: Global Dental Instruments Industry in Australia Revenue billion Forecast, by Product 2019 & 2032
- Table 42: Global Dental Instruments Industry in Australia Volume K Units Forecast, by Product 2019 & 2032
- Table 43: Global Dental Instruments Industry in Australia Revenue billion Forecast, by Treatment 2019 & 2032
- Table 44: Global Dental Instruments Industry in Australia Volume K Units Forecast, by Treatment 2019 & 2032
- Table 45: Global Dental Instruments Industry in Australia Revenue billion Forecast, by End User 2019 & 2032
- Table 46: Global Dental Instruments Industry in Australia Volume K Units Forecast, by End User 2019 & 2032
- Table 47: Global Dental Instruments Industry in Australia Revenue billion Forecast, by Country 2019 & 2032
- Table 48: Global Dental Instruments Industry in Australia Volume K Units Forecast, by Country 2019 & 2032
- Table 49: United Kingdom Dental Instruments Industry in Australia Revenue (billion) Forecast, by Application 2019 & 2032
- Table 50: United Kingdom Dental Instruments Industry in Australia Volume (K Units) Forecast, by Application 2019 & 2032
- Table 51: Germany Dental Instruments Industry in Australia Revenue (billion) Forecast, by Application 2019 & 2032
- Table 52: Germany Dental Instruments Industry in Australia Volume (K Units) Forecast, by Application 2019 & 2032
- Table 53: France Dental Instruments Industry in Australia Revenue (billion) Forecast, by Application 2019 & 2032
- Table 54: France Dental Instruments Industry in Australia Volume (K Units) Forecast, by Application 2019 & 2032
- Table 55: Italy Dental Instruments Industry in Australia Revenue (billion) Forecast, by Application 2019 & 2032
- Table 56: Italy Dental Instruments Industry in Australia Volume (K Units) Forecast, by Application 2019 & 2032
- Table 57: Spain Dental Instruments Industry in Australia Revenue (billion) Forecast, by Application 2019 & 2032
- Table 58: Spain Dental Instruments Industry in Australia Volume (K Units) Forecast, by Application 2019 & 2032
- Table 59: Russia Dental Instruments Industry in Australia Revenue (billion) Forecast, by Application 2019 & 2032
- Table 60: Russia Dental Instruments Industry in Australia Volume (K Units) Forecast, by Application 2019 & 2032
- Table 61: Benelux Dental Instruments Industry in Australia Revenue (billion) Forecast, by Application 2019 & 2032
- Table 62: Benelux Dental Instruments Industry in Australia Volume (K Units) Forecast, by Application 2019 & 2032
- Table 63: Nordics Dental Instruments Industry in Australia Revenue (billion) Forecast, by Application 2019 & 2032
- Table 64: Nordics Dental Instruments Industry in Australia Volume (K Units) Forecast, by Application 2019 & 2032
- Table 65: Rest of Europe Dental Instruments Industry in Australia Revenue (billion) Forecast, by Application 2019 & 2032
- Table 66: Rest of Europe Dental Instruments Industry in Australia Volume (K Units) Forecast, by Application 2019 & 2032
- Table 67: Global Dental Instruments Industry in Australia Revenue billion Forecast, by Product 2019 & 2032
- Table 68: Global Dental Instruments Industry in Australia Volume K Units Forecast, by Product 2019 & 2032
- Table 69: Global Dental Instruments Industry in Australia Revenue billion Forecast, by Treatment 2019 & 2032
- Table 70: Global Dental Instruments Industry in Australia Volume K Units Forecast, by Treatment 2019 & 2032
- Table 71: Global Dental Instruments Industry in Australia Revenue billion Forecast, by End User 2019 & 2032
- Table 72: Global Dental Instruments Industry in Australia Volume K Units Forecast, by End User 2019 & 2032
- Table 73: Global Dental Instruments Industry in Australia Revenue billion Forecast, by Country 2019 & 2032
- Table 74: Global Dental Instruments Industry in Australia Volume K Units Forecast, by Country 2019 & 2032
- Table 75: Turkey Dental Instruments Industry in Australia Revenue (billion) Forecast, by Application 2019 & 2032
- Table 76: Turkey Dental Instruments Industry in Australia Volume (K Units) Forecast, by Application 2019 & 2032
- Table 77: Israel Dental Instruments Industry in Australia Revenue (billion) Forecast, by Application 2019 & 2032
- Table 78: Israel Dental Instruments Industry in Australia Volume (K Units) Forecast, by Application 2019 & 2032
- Table 79: GCC Dental Instruments Industry in Australia Revenue (billion) Forecast, by Application 2019 & 2032
- Table 80: GCC Dental Instruments Industry in Australia Volume (K Units) Forecast, by Application 2019 & 2032
- Table 81: North Africa Dental Instruments Industry in Australia Revenue (billion) Forecast, by Application 2019 & 2032
- Table 82: North Africa Dental Instruments Industry in Australia Volume (K Units) Forecast, by Application 2019 & 2032
- Table 83: South Africa Dental Instruments Industry in Australia Revenue (billion) Forecast, by Application 2019 & 2032
- Table 84: South Africa Dental Instruments Industry in Australia Volume (K Units) Forecast, by Application 2019 & 2032
- Table 85: Rest of Middle East & Africa Dental Instruments Industry in Australia Revenue (billion) Forecast, by Application 2019 & 2032
- Table 86: Rest of Middle East & Africa Dental Instruments Industry in Australia Volume (K Units) Forecast, by Application 2019 & 2032
- Table 87: Global Dental Instruments Industry in Australia Revenue billion Forecast, by Product 2019 & 2032
- Table 88: Global Dental Instruments Industry in Australia Volume K Units Forecast, by Product 2019 & 2032
- Table 89: Global Dental Instruments Industry in Australia Revenue billion Forecast, by Treatment 2019 & 2032
- Table 90: Global Dental Instruments Industry in Australia Volume K Units Forecast, by Treatment 2019 & 2032
- Table 91: Global Dental Instruments Industry in Australia Revenue billion Forecast, by End User 2019 & 2032
- Table 92: Global Dental Instruments Industry in Australia Volume K Units Forecast, by End User 2019 & 2032
- Table 93: Global Dental Instruments Industry in Australia Revenue billion Forecast, by Country 2019 & 2032
- Table 94: Global Dental Instruments Industry in Australia Volume K Units Forecast, by Country 2019 & 2032
- Table 95: China Dental Instruments Industry in Australia Revenue (billion) Forecast, by Application 2019 & 2032
- Table 96: China Dental Instruments Industry in Australia Volume (K Units) Forecast, by Application 2019 & 2032
- Table 97: India Dental Instruments Industry in Australia Revenue (billion) Forecast, by Application 2019 & 2032
- Table 98: India Dental Instruments Industry in Australia Volume (K Units) Forecast, by Application 2019 & 2032
- Table 99: Japan Dental Instruments Industry in Australia Revenue (billion) Forecast, by Application 2019 & 2032
- Table 100: Japan Dental Instruments Industry in Australia Volume (K Units) Forecast, by Application 2019 & 2032
- Table 101: South Korea Dental Instruments Industry in Australia Revenue (billion) Forecast, by Application 2019 & 2032
- Table 102: South Korea Dental Instruments Industry in Australia Volume (K Units) Forecast, by Application 2019 & 2032
- Table 103: ASEAN Dental Instruments Industry in Australia Revenue (billion) Forecast, by Application 2019 & 2032
- Table 104: ASEAN Dental Instruments Industry in Australia Volume (K Units) Forecast, by Application 2019 & 2032
- Table 105: Oceania Dental Instruments Industry in Australia Revenue (billion) Forecast, by Application 2019 & 2032
- Table 106: Oceania Dental Instruments Industry in Australia Volume (K Units) Forecast, by Application 2019 & 2032
- Table 107: Rest of Asia Pacific Dental Instruments Industry in Australia Revenue (billion) Forecast, by Application 2019 & 2032
- Table 108: Rest of Asia Pacific Dental Instruments Industry in Australia Volume (K Units) Forecast, by Application 2019 & 2032
Frequently Asked Questions
1. What is the projected Compound Annual Growth Rate (CAGR) of the Dental Instruments Industry in Australia?
The projected CAGR is approximately 6.20%.
2. Which companies are prominent players in the Dental Instruments Industry in Australia?
Key companies in the market include A-Dec Inc, Biolase Inc, Planmeca, Dentsply Sirona, GC Corporation, 3M Company, Envista Holdings Corporation, Carestream Health Inc, KaVo Dental.
3. What are the main segments of the Dental Instruments Industry in Australia?
The market segments include Product, Treatment, End User.
4. Can you provide details about the market size?
The market size is estimated to be USD XX billion as of 2022.
5. What are some drivers contributing to market growth?
Increasing awareness of oral hygiene and preventive dental care has led to more frequent dental visits in Australia. This has driven demand for high-quality dental instruments used in routine procedures such as cleanings. fillings. and extractions.
6. What are the notable trends driving market growth?
The adoption of digital tools such as intraoral scanners. CAD/CAM systems. and 3D printing is expected to grow. These tools enhance precision. efficiency. and patient outcomes. driving demand for compatible dental instrument.
7. Are there any restraints impacting market growth?
The cost of high-quality dental instruments can be a barrier for smaller dental practices. This is especially true for high-tech instruments such as lasers. CAD/CAM systems. and digital imaging tools.
8. Can you provide examples of recent developments in the market?
March 2023: Dental Implants, a trusted dental clinic in Joondalup, Australia, reported the launch of its new website that focuses on improving dental user experience through the inclusion of a more refined home page that shows prospective patients, an in-depth list of its current dental implant services, as well as the addition of an informative blog that shares the latest recovery and dental hygiene advice.
9. What pricing options are available for accessing the report?
Pricing options include single-user, multi-user, and enterprise licenses priced at USD 3800, USD 4500, and USD 5800 respectively.
10. Is the market size provided in terms of value or volume?
The market size is provided in terms of value, measured in billion and volume, measured in K Units.
11. Are there any specific market keywords associated with the report?
Yes, the market keyword associated with the report is "Dental Instruments Industry in Australia," which aids in identifying and referencing the specific market segment covered.
12. How do I determine which pricing option suits my needs best?
The pricing options vary based on user requirements and access needs. Individual users may opt for single-user licenses, while businesses requiring broader access may choose multi-user or enterprise licenses for cost-effective access to the report.
13. Are there any additional resources or data provided in the Dental Instruments Industry in Australia report?
While the report offers comprehensive insights, it's advisable to review the specific contents or supplementary materials provided to ascertain if additional resources or data are available.
14. How can I stay updated on further developments or reports in the Dental Instruments Industry in Australia?
To stay informed about further developments, trends, and reports in the Dental Instruments Industry in Australia, consider subscribing to industry newsletters, following relevant companies and organizations, or regularly checking reputable industry news sources and publications.
Methodology
Step 1 - Identification of Relevant Samples Size from Population Database


Step 2 - Approaches for Defining Global Market Size (Value, Volume* & Price*)

Note*: In applicable scenarios
Step 3 - Data Sources
Primary Research
- Web Analytics
- Survey Reports
- Research Institute
- Latest Research Reports
- Opinion Leaders
Secondary Research
- Annual Reports
- White Paper
- Latest Press Release
- Industry Association
- Paid Database
- Investor Presentations

Step 4 - Data Triangulation
Involves using different sources of information in order to increase the validity of a study
These sources are likely to be stakeholders in a program - participants, other researchers, program staff, other community members, and so on.
Then we put all data in single framework & apply various statistical tools to find out the dynamic on the market.
During the analysis stage, feedback from the stakeholder groups would be compared to determine areas of agreement as well as areas of divergence


