
Key Insights
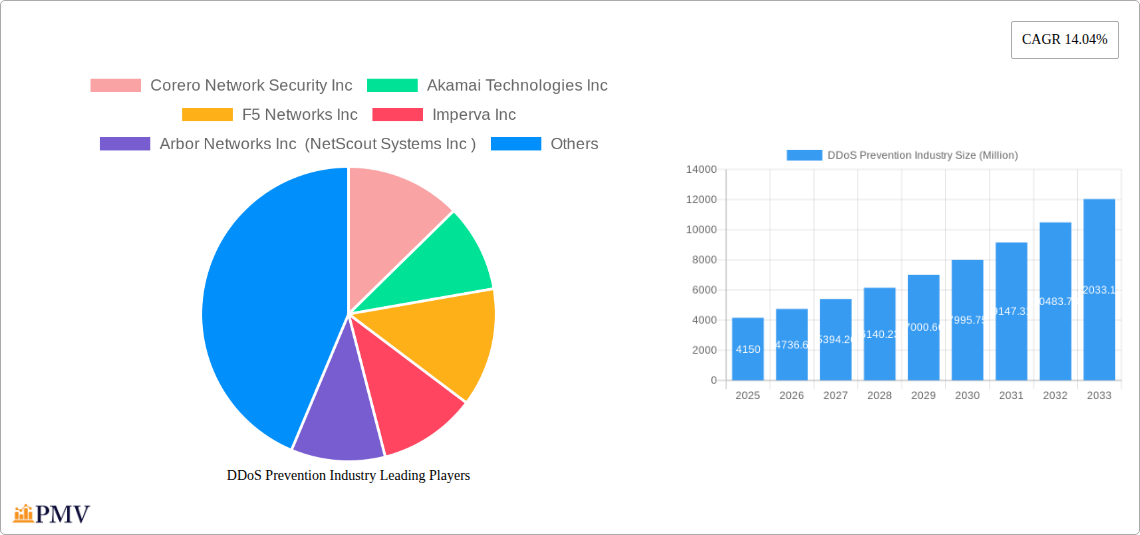
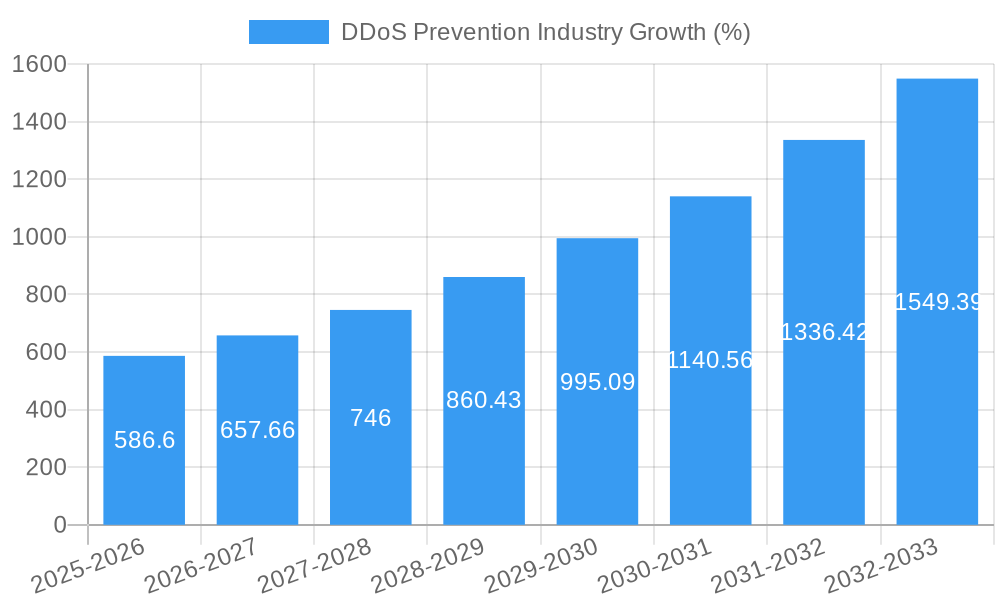
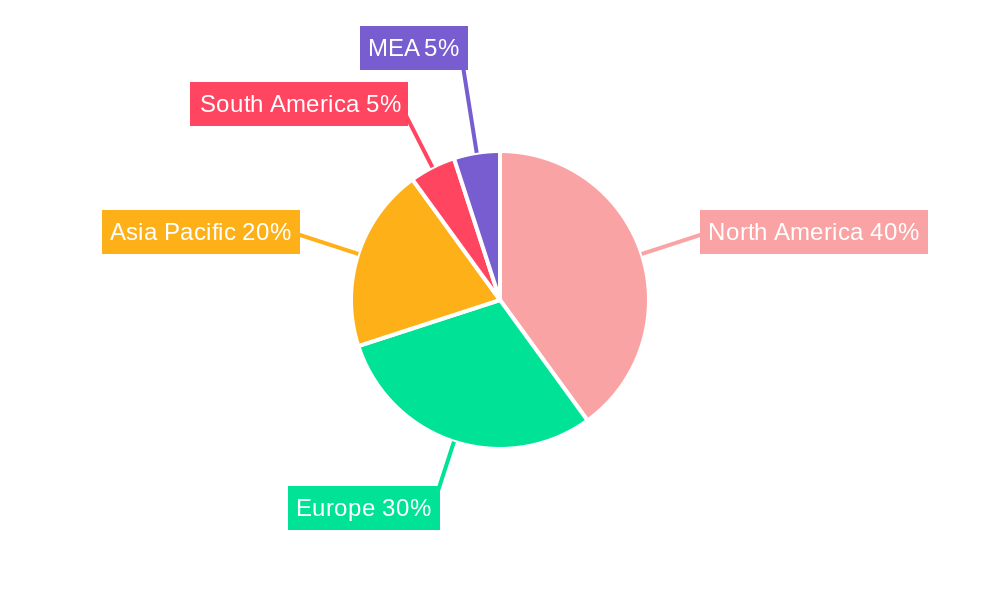
The DDoS prevention market, valued at $4.15 billion in 2025, is experiencing robust growth, projected to expand at a Compound Annual Growth Rate (CAGR) of 14.04% from 2025 to 2033. This significant expansion is driven by the increasing frequency and sophistication of Distributed Denial-of-Service (DDoS) attacks targeting businesses across diverse sectors. The rising adoption of cloud computing, coupled with the expanding digital landscape and the interconnectedness of critical infrastructure, fuels this demand for robust security solutions. Growth is further propelled by the increasing adoption of advanced DDoS mitigation techniques like AI-powered threat detection and automated response systems. While the on-premise deployment model still holds a significant market share, the cloud-based segment is exhibiting the fastest growth due to its scalability, cost-effectiveness, and ease of deployment. Large enterprises are currently the leading adopters, but the adoption rate is accelerating in the SME segment as awareness of cyber threats grows. Geographically, North America and Europe currently dominate the market, reflecting higher digital penetration and stringent data protection regulations. However, the Asia-Pacific region is expected to witness substantial growth in the coming years fueled by increasing internet usage and rising government investments in cybersecurity infrastructure. The BFSI, IT & Telecommunications and Government & Defense sectors represent key end-user industries due to their critical infrastructure and reliance on constant uptime.
The market's growth trajectory, however, faces certain challenges. High initial investment costs for robust DDoS protection systems and a perceived lack of expertise in implementing and managing these solutions can hinder adoption, particularly among smaller enterprises. Furthermore, the constant evolution of DDoS attack techniques demands continuous innovation in mitigation strategies, placing pressure on vendors to stay ahead of the curve. Nevertheless, the escalating financial and reputational risks associated with successful DDoS attacks are overriding these challenges, prompting organizations to prioritize proactive security measures. The market's future will be shaped by advancements in AI and machine learning for threat prediction, increased automation of response mechanisms, and the development of more integrated security solutions that address DDoS attacks as part of a broader cybersecurity strategy. The continued expansion of cloud computing and the IoT will also drive continued growth within the market.
DDoS Prevention Industry Market Report: 2019-2033
This comprehensive report provides a detailed analysis of the DDoS Prevention industry, encompassing market size, growth projections, competitive landscape, and key technological advancements from 2019 to 2033. The study period covers the historical period (2019-2024), the base year (2025), and the forecast period (2025-2033), with a focus on the estimated year 2025. The report offers actionable insights for industry stakeholders, including vendors, investors, and technology enthusiasts, valuing the market at Millions USD across various segments.
DDoS Prevention Industry Market Structure & Competitive Dynamics
The DDoS prevention market exhibits a moderately concentrated structure, with several key players holding significant market share. The industry is characterized by intense competition, driven by continuous innovation and a rapid evolution of DDoS attack vectors. The leading companies, including Corero Network Security Inc, Akamai Technologies Inc, F5 Networks Inc, Imperva Inc, Arbor Networks Inc (NetScout Systems Inc), Neustar Inc, Radware Ltd, Cloudflare Inc, Verisign Inc, Nexusguard Ltd, and Dosarrest Internet Security Ltd, are actively engaged in developing advanced solutions and expanding their market reach through strategic partnerships and acquisitions.
- Market Concentration: The top 5 players account for approximately xx% of the global market share in 2025.
- Innovation Ecosystems: Significant investments in R&D are fueling innovation in areas like AI-powered threat detection and automation.
- Regulatory Frameworks: Government regulations regarding data protection and cybersecurity are driving demand for robust DDoS prevention solutions.
- Product Substitutes: While specialized DDoS prevention solutions are dominant, alternative security measures, such as firewalls and intrusion detection systems, partially address some aspects of DDoS mitigation.
- End-User Trends: The increasing adoption of cloud services and the growing sophistication of DDoS attacks are key factors driving market growth.
- M&A Activities: The industry has witnessed several mergers and acquisitions in recent years, with deal values exceeding xx Million USD in the past five years, resulting in consolidation and expansion of capabilities.
DDoS Prevention Industry Industry Trends & Insights
The DDoS prevention market is experiencing significant growth, driven by several factors. The rising frequency and severity of DDoS attacks targeting businesses and critical infrastructure are compelling organizations to invest heavily in robust mitigation solutions. The increasing adoption of cloud services, IoT devices, and remote work models expands the attack surface and increases vulnerability. Technological advancements, such as AI and machine learning, are improving the accuracy and speed of DDoS detection and mitigation. The market is also witnessing a shift towards cloud-based DDoS prevention solutions due to their scalability, cost-effectiveness, and ease of deployment. The compound annual growth rate (CAGR) for the DDoS prevention market is projected to be xx% during the forecast period (2025-2033), with market penetration reaching xx% by 2033. This growth is fueled by increasing adoption across various sectors, including BFSI, government, and healthcare, where data security and operational uptime are paramount. Competitive dynamics remain intense, with companies constantly striving to improve their solutions' performance, features, and scalability.
Dominant Markets & Segments in DDoS Prevention Industry
The North American region currently holds the largest market share in the DDoS prevention industry, driven by factors such as robust IT infrastructure, high adoption of cloud services, and stringent data security regulations. However, the Asia-Pacific region is projected to witness significant growth in the coming years due to increased internet penetration and rising digitalization initiatives.
- Component: The solution segment holds a larger market share compared to the service segment, driven by a demand for comprehensive and tailored security tools.
- Deployment Type: Cloud-based deployments are experiencing the highest growth rate, as organizations seek scalable and cost-effective solutions.
- Size of Enterprise: Large enterprises dominate the market currently, but the SME segment is showing substantial growth potential.
- End-user Industry: The BFSI, government & defense, and IT & telecommunication sectors are the leading consumers of DDoS prevention solutions due to their critical reliance on secure network infrastructure and data integrity. Key drivers include:
- Government and Defense: Stringent security regulations and the need to protect critical infrastructure.
- IT and Telecommunication: Protecting network infrastructure and customer data from attacks.
- Healthcare: Protecting sensitive patient data and ensuring uninterrupted operation of healthcare systems.
- Retail: Safeguarding online transactions and customer data.
- BFSI: Protecting financial transactions and customer accounts.
- Media and Entertainment: Protecting online services and streaming platforms.
DDoS Prevention Industry Product Innovations
Recent advancements in DDoS prevention technology include AI-powered threat detection, automated mitigation systems, and advanced analytics capabilities. These innovations are enhancing the speed and accuracy of attack detection, improving mitigation effectiveness, and reducing the impact of DDoS attacks on businesses. The market is witnessing a shift towards integrated security platforms that combine DDoS prevention with other security functionalities, offering a more holistic approach to cybersecurity.
Report Segmentation & Scope
This report segments the DDoS prevention market by component (solution, service), deployment type (cloud, on-premise, hybrid), enterprise size (SMEs, large enterprises), and end-user industry (government & defense, IT & telecommunication, healthcare, retail, BFSI, media & entertainment, others). Each segment’s market size, growth projections, and competitive dynamics are thoroughly analyzed. For example, the cloud-based deployment segment is expected to witness significant growth due to its scalability and ease of management. Similarly, the BFSI sector is expected to see high demand due to the increasing threat landscape and regulatory pressure.
Key Drivers of DDoS Prevention Industry Growth
The growth of the DDoS prevention industry is primarily driven by the rising frequency and sophistication of DDoS attacks, the increasing adoption of cloud computing and IoT devices, and the growing need for robust cybersecurity measures across various industries. Stringent data privacy regulations and government initiatives promoting cybersecurity awareness further fuel market expansion.
Challenges in the DDoS Prevention Industry Sector
The DDoS prevention industry faces several challenges, including the ever-evolving nature of DDoS attacks, the need for continuous innovation to stay ahead of sophisticated threat actors, and the complexity of implementing and managing effective DDoS mitigation solutions. High initial investment costs and the need for specialized expertise can also hinder market growth, particularly among SMEs.
Leading Players in the DDoS Prevention Industry Market
- Corero Network Security Inc
- Akamai Technologies Inc
- F5 Networks Inc
- Imperva Inc
- Arbor Networks Inc (NetScout Systems Inc)
- Neustar Inc
- Radware Ltd
- Cloudflare Inc
- Verisign Inc
- Nexusguard Ltd
- Dosarrest Internet Security Ltd
Key Developments in DDoS Prevention Industry Sector
- September 2022: Liquid Networks launched a DDoS Secure offering, expanding service availability in Africa.
- April 2022: MazeBolt Technologies secured USD 10 Million in funding for its RADAR solution.
- January 2022: Bigleaf Networks launched an automated DDoS mitigation service.
Strategic DDoS Prevention Industry Market Outlook
The DDoS prevention market is poised for continued growth, driven by escalating cyber threats and increasing digitalization across various industries. Strategic opportunities exist for vendors to develop advanced solutions leveraging AI and machine learning, focusing on cloud-based deployments, and expanding their reach into emerging markets. The focus on proactive threat intelligence and automated response mechanisms will further shape the industry's future.
DDoS Prevention Industry Segmentation
-
1. Component
- 1.1. Solution
- 1.2. Service
-
2. Deployment Type
- 2.1. Cloud
- 2.2. On-premise
- 2.3. Hybrid
-
3. Size of Enterprise
- 3.1. Small and Medium Enterprises
- 3.2. Large Enterprises
-
4. End-user Industry
- 4.1. Government and Defense
- 4.2. IT and Telecommunication
- 4.3. Healthcare
- 4.4. Retail
- 4.5. BFSI
- 4.6. Media and Entertainment
- 4.7. Other End-user Industries
DDoS Prevention Industry Segmentation By Geography
- 1. North America
- 2. Europe
- 3. Asia Pacific
- 4. Rest of the World
DDoS Prevention Industry REPORT HIGHLIGHTS
| Aspects | Details |
|---|---|
| Study Period | 2019-2033 |
| Base Year | 2024 |
| Estimated Year | 2025 |
| Forecast Period | 2025-2033 |
| Historical Period | 2019-2024 |
| Growth Rate | CAGR of 14.04% from 2019-2033 |
| Segmentation |
|
Table of Contents
- 1. Introduction
- 1.1. Research Scope
- 1.2. Market Segmentation
- 1.3. Research Methodology
- 1.4. Definitions and Assumptions
- 2. Executive Summary
- 2.1. Introduction
- 3. Market Dynamics
- 3.1. Introduction
- 3.2. Market Drivers
- 3.2.1. Increasing Instances of Sophisticated DDoS Attacks; Introduction of Cost-effective Cloud-based and Hybrid Solutions; Proliferation of Technology and Adoption of IoT across Various Verticals
- 3.3. Market Restrains
- 3.3.1. Lack of Skilled and Trained Personnel
- 3.4. Market Trends
- 3.4.1. Increasing Instances of Sophisticated DDoS Attacks to Drive the Market
- 4. Market Factor Analysis
- 4.1. Porters Five Forces
- 4.2. Supply/Value Chain
- 4.3. PESTEL analysis
- 4.4. Market Entropy
- 4.5. Patent/Trademark Analysis
- 5. Global DDoS Prevention Industry Analysis, Insights and Forecast, 2019-2031
- 5.1. Market Analysis, Insights and Forecast - by Component
- 5.1.1. Solution
- 5.1.2. Service
- 5.2. Market Analysis, Insights and Forecast - by Deployment Type
- 5.2.1. Cloud
- 5.2.2. On-premise
- 5.2.3. Hybrid
- 5.3. Market Analysis, Insights and Forecast - by Size of Enterprise
- 5.3.1. Small and Medium Enterprises
- 5.3.2. Large Enterprises
- 5.4. Market Analysis, Insights and Forecast - by End-user Industry
- 5.4.1. Government and Defense
- 5.4.2. IT and Telecommunication
- 5.4.3. Healthcare
- 5.4.4. Retail
- 5.4.5. BFSI
- 5.4.6. Media and Entertainment
- 5.4.7. Other End-user Industries
- 5.5. Market Analysis, Insights and Forecast - by Region
- 5.5.1. North America
- 5.5.2. Europe
- 5.5.3. Asia Pacific
- 5.5.4. Rest of the World
- 5.1. Market Analysis, Insights and Forecast - by Component
- 6. North America DDoS Prevention Industry Analysis, Insights and Forecast, 2019-2031
- 6.1. Market Analysis, Insights and Forecast - by Component
- 6.1.1. Solution
- 6.1.2. Service
- 6.2. Market Analysis, Insights and Forecast - by Deployment Type
- 6.2.1. Cloud
- 6.2.2. On-premise
- 6.2.3. Hybrid
- 6.3. Market Analysis, Insights and Forecast - by Size of Enterprise
- 6.3.1. Small and Medium Enterprises
- 6.3.2. Large Enterprises
- 6.4. Market Analysis, Insights and Forecast - by End-user Industry
- 6.4.1. Government and Defense
- 6.4.2. IT and Telecommunication
- 6.4.3. Healthcare
- 6.4.4. Retail
- 6.4.5. BFSI
- 6.4.6. Media and Entertainment
- 6.4.7. Other End-user Industries
- 6.1. Market Analysis, Insights and Forecast - by Component
- 7. Europe DDoS Prevention Industry Analysis, Insights and Forecast, 2019-2031
- 7.1. Market Analysis, Insights and Forecast - by Component
- 7.1.1. Solution
- 7.1.2. Service
- 7.2. Market Analysis, Insights and Forecast - by Deployment Type
- 7.2.1. Cloud
- 7.2.2. On-premise
- 7.2.3. Hybrid
- 7.3. Market Analysis, Insights and Forecast - by Size of Enterprise
- 7.3.1. Small and Medium Enterprises
- 7.3.2. Large Enterprises
- 7.4. Market Analysis, Insights and Forecast - by End-user Industry
- 7.4.1. Government and Defense
- 7.4.2. IT and Telecommunication
- 7.4.3. Healthcare
- 7.4.4. Retail
- 7.4.5. BFSI
- 7.4.6. Media and Entertainment
- 7.4.7. Other End-user Industries
- 7.1. Market Analysis, Insights and Forecast - by Component
- 8. Asia Pacific DDoS Prevention Industry Analysis, Insights and Forecast, 2019-2031
- 8.1. Market Analysis, Insights and Forecast - by Component
- 8.1.1. Solution
- 8.1.2. Service
- 8.2. Market Analysis, Insights and Forecast - by Deployment Type
- 8.2.1. Cloud
- 8.2.2. On-premise
- 8.2.3. Hybrid
- 8.3. Market Analysis, Insights and Forecast - by Size of Enterprise
- 8.3.1. Small and Medium Enterprises
- 8.3.2. Large Enterprises
- 8.4. Market Analysis, Insights and Forecast - by End-user Industry
- 8.4.1. Government and Defense
- 8.4.2. IT and Telecommunication
- 8.4.3. Healthcare
- 8.4.4. Retail
- 8.4.5. BFSI
- 8.4.6. Media and Entertainment
- 8.4.7. Other End-user Industries
- 8.1. Market Analysis, Insights and Forecast - by Component
- 9. Rest of the World DDoS Prevention Industry Analysis, Insights and Forecast, 2019-2031
- 9.1. Market Analysis, Insights and Forecast - by Component
- 9.1.1. Solution
- 9.1.2. Service
- 9.2. Market Analysis, Insights and Forecast - by Deployment Type
- 9.2.1. Cloud
- 9.2.2. On-premise
- 9.2.3. Hybrid
- 9.3. Market Analysis, Insights and Forecast - by Size of Enterprise
- 9.3.1. Small and Medium Enterprises
- 9.3.2. Large Enterprises
- 9.4. Market Analysis, Insights and Forecast - by End-user Industry
- 9.4.1. Government and Defense
- 9.4.2. IT and Telecommunication
- 9.4.3. Healthcare
- 9.4.4. Retail
- 9.4.5. BFSI
- 9.4.6. Media and Entertainment
- 9.4.7. Other End-user Industries
- 9.1. Market Analysis, Insights and Forecast - by Component
- 10. North America DDoS Prevention Industry Analysis, Insights and Forecast, 2019-2031
- 10.1. Market Analysis, Insights and Forecast - By Country/Sub-region
- 10.1.1 United States
- 10.1.2 Canada
- 10.1.3 Mexico
- 11. Europe DDoS Prevention Industry Analysis, Insights and Forecast, 2019-2031
- 11.1. Market Analysis, Insights and Forecast - By Country/Sub-region
- 11.1.1 Germany
- 11.1.2 United Kingdom
- 11.1.3 France
- 11.1.4 Spain
- 11.1.5 Italy
- 11.1.6 Spain
- 11.1.7 Belgium
- 11.1.8 Netherland
- 11.1.9 Nordics
- 11.1.10 Rest of Europe
- 12. Asia Pacific DDoS Prevention Industry Analysis, Insights and Forecast, 2019-2031
- 12.1. Market Analysis, Insights and Forecast - By Country/Sub-region
- 12.1.1 China
- 12.1.2 Japan
- 12.1.3 India
- 12.1.4 South Korea
- 12.1.5 Southeast Asia
- 12.1.6 Australia
- 12.1.7 Indonesia
- 12.1.8 Phillipes
- 12.1.9 Singapore
- 12.1.10 Thailandc
- 12.1.11 Rest of Asia Pacific
- 13. South America DDoS Prevention Industry Analysis, Insights and Forecast, 2019-2031
- 13.1. Market Analysis, Insights and Forecast - By Country/Sub-region
- 13.1.1 Brazil
- 13.1.2 Argentina
- 13.1.3 Peru
- 13.1.4 Chile
- 13.1.5 Colombia
- 13.1.6 Ecuador
- 13.1.7 Venezuela
- 13.1.8 Rest of South America
- 14. North America DDoS Prevention Industry Analysis, Insights and Forecast, 2019-2031
- 14.1. Market Analysis, Insights and Forecast - By Country/Sub-region
- 14.1.1 United States
- 14.1.2 Canada
- 14.1.3 Mexico
- 15. MEA DDoS Prevention Industry Analysis, Insights and Forecast, 2019-2031
- 15.1. Market Analysis, Insights and Forecast - By Country/Sub-region
- 15.1.1 United Arab Emirates
- 15.1.2 Saudi Arabia
- 15.1.3 South Africa
- 15.1.4 Rest of Middle East and Africa
- 16. Competitive Analysis
- 16.1. Global Market Share Analysis 2024
- 16.2. Company Profiles
- 16.2.1 Corero Network Security Inc
- 16.2.1.1. Overview
- 16.2.1.2. Products
- 16.2.1.3. SWOT Analysis
- 16.2.1.4. Recent Developments
- 16.2.1.5. Financials (Based on Availability)
- 16.2.2 Akamai Technologies Inc
- 16.2.2.1. Overview
- 16.2.2.2. Products
- 16.2.2.3. SWOT Analysis
- 16.2.2.4. Recent Developments
- 16.2.2.5. Financials (Based on Availability)
- 16.2.3 F5 Networks Inc
- 16.2.3.1. Overview
- 16.2.3.2. Products
- 16.2.3.3. SWOT Analysis
- 16.2.3.4. Recent Developments
- 16.2.3.5. Financials (Based on Availability)
- 16.2.4 Imperva Inc
- 16.2.4.1. Overview
- 16.2.4.2. Products
- 16.2.4.3. SWOT Analysis
- 16.2.4.4. Recent Developments
- 16.2.4.5. Financials (Based on Availability)
- 16.2.5 Arbor Networks Inc (NetScout Systems Inc )
- 16.2.5.1. Overview
- 16.2.5.2. Products
- 16.2.5.3. SWOT Analysis
- 16.2.5.4. Recent Developments
- 16.2.5.5. Financials (Based on Availability)
- 16.2.6 Neustar Inc
- 16.2.6.1. Overview
- 16.2.6.2. Products
- 16.2.6.3. SWOT Analysis
- 16.2.6.4. Recent Developments
- 16.2.6.5. Financials (Based on Availability)
- 16.2.7 Radware Ltd
- 16.2.7.1. Overview
- 16.2.7.2. Products
- 16.2.7.3. SWOT Analysis
- 16.2.7.4. Recent Developments
- 16.2.7.5. Financials (Based on Availability)
- 16.2.8 Cloudflare Inc
- 16.2.8.1. Overview
- 16.2.8.2. Products
- 16.2.8.3. SWOT Analysis
- 16.2.8.4. Recent Developments
- 16.2.8.5. Financials (Based on Availability)
- 16.2.9 Verisign Inc
- 16.2.9.1. Overview
- 16.2.9.2. Products
- 16.2.9.3. SWOT Analysis
- 16.2.9.4. Recent Developments
- 16.2.9.5. Financials (Based on Availability)
- 16.2.10 Nexusguard Ltd
- 16.2.10.1. Overview
- 16.2.10.2. Products
- 16.2.10.3. SWOT Analysis
- 16.2.10.4. Recent Developments
- 16.2.10.5. Financials (Based on Availability)
- 16.2.11 Dosarrest Internet Security Ltd
- 16.2.11.1. Overview
- 16.2.11.2. Products
- 16.2.11.3. SWOT Analysis
- 16.2.11.4. Recent Developments
- 16.2.11.5. Financials (Based on Availability)
- 16.2.1 Corero Network Security Inc
List of Figures
- Figure 1: Global DDoS Prevention Industry Revenue Breakdown (Million, %) by Region 2024 & 2032
- Figure 2: North America DDoS Prevention Industry Revenue (Million), by Country 2024 & 2032
- Figure 3: North America DDoS Prevention Industry Revenue Share (%), by Country 2024 & 2032
- Figure 4: Europe DDoS Prevention Industry Revenue (Million), by Country 2024 & 2032
- Figure 5: Europe DDoS Prevention Industry Revenue Share (%), by Country 2024 & 2032
- Figure 6: Asia Pacific DDoS Prevention Industry Revenue (Million), by Country 2024 & 2032
- Figure 7: Asia Pacific DDoS Prevention Industry Revenue Share (%), by Country 2024 & 2032
- Figure 8: South America DDoS Prevention Industry Revenue (Million), by Country 2024 & 2032
- Figure 9: South America DDoS Prevention Industry Revenue Share (%), by Country 2024 & 2032
- Figure 10: North America DDoS Prevention Industry Revenue (Million), by Country 2024 & 2032
- Figure 11: North America DDoS Prevention Industry Revenue Share (%), by Country 2024 & 2032
- Figure 12: MEA DDoS Prevention Industry Revenue (Million), by Country 2024 & 2032
- Figure 13: MEA DDoS Prevention Industry Revenue Share (%), by Country 2024 & 2032
- Figure 14: North America DDoS Prevention Industry Revenue (Million), by Component 2024 & 2032
- Figure 15: North America DDoS Prevention Industry Revenue Share (%), by Component 2024 & 2032
- Figure 16: North America DDoS Prevention Industry Revenue (Million), by Deployment Type 2024 & 2032
- Figure 17: North America DDoS Prevention Industry Revenue Share (%), by Deployment Type 2024 & 2032
- Figure 18: North America DDoS Prevention Industry Revenue (Million), by Size of Enterprise 2024 & 2032
- Figure 19: North America DDoS Prevention Industry Revenue Share (%), by Size of Enterprise 2024 & 2032
- Figure 20: North America DDoS Prevention Industry Revenue (Million), by End-user Industry 2024 & 2032
- Figure 21: North America DDoS Prevention Industry Revenue Share (%), by End-user Industry 2024 & 2032
- Figure 22: North America DDoS Prevention Industry Revenue (Million), by Country 2024 & 2032
- Figure 23: North America DDoS Prevention Industry Revenue Share (%), by Country 2024 & 2032
- Figure 24: Europe DDoS Prevention Industry Revenue (Million), by Component 2024 & 2032
- Figure 25: Europe DDoS Prevention Industry Revenue Share (%), by Component 2024 & 2032
- Figure 26: Europe DDoS Prevention Industry Revenue (Million), by Deployment Type 2024 & 2032
- Figure 27: Europe DDoS Prevention Industry Revenue Share (%), by Deployment Type 2024 & 2032
- Figure 28: Europe DDoS Prevention Industry Revenue (Million), by Size of Enterprise 2024 & 2032
- Figure 29: Europe DDoS Prevention Industry Revenue Share (%), by Size of Enterprise 2024 & 2032
- Figure 30: Europe DDoS Prevention Industry Revenue (Million), by End-user Industry 2024 & 2032
- Figure 31: Europe DDoS Prevention Industry Revenue Share (%), by End-user Industry 2024 & 2032
- Figure 32: Europe DDoS Prevention Industry Revenue (Million), by Country 2024 & 2032
- Figure 33: Europe DDoS Prevention Industry Revenue Share (%), by Country 2024 & 2032
- Figure 34: Asia Pacific DDoS Prevention Industry Revenue (Million), by Component 2024 & 2032
- Figure 35: Asia Pacific DDoS Prevention Industry Revenue Share (%), by Component 2024 & 2032
- Figure 36: Asia Pacific DDoS Prevention Industry Revenue (Million), by Deployment Type 2024 & 2032
- Figure 37: Asia Pacific DDoS Prevention Industry Revenue Share (%), by Deployment Type 2024 & 2032
- Figure 38: Asia Pacific DDoS Prevention Industry Revenue (Million), by Size of Enterprise 2024 & 2032
- Figure 39: Asia Pacific DDoS Prevention Industry Revenue Share (%), by Size of Enterprise 2024 & 2032
- Figure 40: Asia Pacific DDoS Prevention Industry Revenue (Million), by End-user Industry 2024 & 2032
- Figure 41: Asia Pacific DDoS Prevention Industry Revenue Share (%), by End-user Industry 2024 & 2032
- Figure 42: Asia Pacific DDoS Prevention Industry Revenue (Million), by Country 2024 & 2032
- Figure 43: Asia Pacific DDoS Prevention Industry Revenue Share (%), by Country 2024 & 2032
- Figure 44: Rest of the World DDoS Prevention Industry Revenue (Million), by Component 2024 & 2032
- Figure 45: Rest of the World DDoS Prevention Industry Revenue Share (%), by Component 2024 & 2032
- Figure 46: Rest of the World DDoS Prevention Industry Revenue (Million), by Deployment Type 2024 & 2032
- Figure 47: Rest of the World DDoS Prevention Industry Revenue Share (%), by Deployment Type 2024 & 2032
- Figure 48: Rest of the World DDoS Prevention Industry Revenue (Million), by Size of Enterprise 2024 & 2032
- Figure 49: Rest of the World DDoS Prevention Industry Revenue Share (%), by Size of Enterprise 2024 & 2032
- Figure 50: Rest of the World DDoS Prevention Industry Revenue (Million), by End-user Industry 2024 & 2032
- Figure 51: Rest of the World DDoS Prevention Industry Revenue Share (%), by End-user Industry 2024 & 2032
- Figure 52: Rest of the World DDoS Prevention Industry Revenue (Million), by Country 2024 & 2032
- Figure 53: Rest of the World DDoS Prevention Industry Revenue Share (%), by Country 2024 & 2032
List of Tables
- Table 1: Global DDoS Prevention Industry Revenue Million Forecast, by Region 2019 & 2032
- Table 2: Global DDoS Prevention Industry Revenue Million Forecast, by Component 2019 & 2032
- Table 3: Global DDoS Prevention Industry Revenue Million Forecast, by Deployment Type 2019 & 2032
- Table 4: Global DDoS Prevention Industry Revenue Million Forecast, by Size of Enterprise 2019 & 2032
- Table 5: Global DDoS Prevention Industry Revenue Million Forecast, by End-user Industry 2019 & 2032
- Table 6: Global DDoS Prevention Industry Revenue Million Forecast, by Region 2019 & 2032
- Table 7: Global DDoS Prevention Industry Revenue Million Forecast, by Country 2019 & 2032
- Table 8: United States DDoS Prevention Industry Revenue (Million) Forecast, by Application 2019 & 2032
- Table 9: Canada DDoS Prevention Industry Revenue (Million) Forecast, by Application 2019 & 2032
- Table 10: Mexico DDoS Prevention Industry Revenue (Million) Forecast, by Application 2019 & 2032
- Table 11: Global DDoS Prevention Industry Revenue Million Forecast, by Country 2019 & 2032
- Table 12: Germany DDoS Prevention Industry Revenue (Million) Forecast, by Application 2019 & 2032
- Table 13: United Kingdom DDoS Prevention Industry Revenue (Million) Forecast, by Application 2019 & 2032
- Table 14: France DDoS Prevention Industry Revenue (Million) Forecast, by Application 2019 & 2032
- Table 15: Spain DDoS Prevention Industry Revenue (Million) Forecast, by Application 2019 & 2032
- Table 16: Italy DDoS Prevention Industry Revenue (Million) Forecast, by Application 2019 & 2032
- Table 17: Spain DDoS Prevention Industry Revenue (Million) Forecast, by Application 2019 & 2032
- Table 18: Belgium DDoS Prevention Industry Revenue (Million) Forecast, by Application 2019 & 2032
- Table 19: Netherland DDoS Prevention Industry Revenue (Million) Forecast, by Application 2019 & 2032
- Table 20: Nordics DDoS Prevention Industry Revenue (Million) Forecast, by Application 2019 & 2032
- Table 21: Rest of Europe DDoS Prevention Industry Revenue (Million) Forecast, by Application 2019 & 2032
- Table 22: Global DDoS Prevention Industry Revenue Million Forecast, by Country 2019 & 2032
- Table 23: China DDoS Prevention Industry Revenue (Million) Forecast, by Application 2019 & 2032
- Table 24: Japan DDoS Prevention Industry Revenue (Million) Forecast, by Application 2019 & 2032
- Table 25: India DDoS Prevention Industry Revenue (Million) Forecast, by Application 2019 & 2032
- Table 26: South Korea DDoS Prevention Industry Revenue (Million) Forecast, by Application 2019 & 2032
- Table 27: Southeast Asia DDoS Prevention Industry Revenue (Million) Forecast, by Application 2019 & 2032
- Table 28: Australia DDoS Prevention Industry Revenue (Million) Forecast, by Application 2019 & 2032
- Table 29: Indonesia DDoS Prevention Industry Revenue (Million) Forecast, by Application 2019 & 2032
- Table 30: Phillipes DDoS Prevention Industry Revenue (Million) Forecast, by Application 2019 & 2032
- Table 31: Singapore DDoS Prevention Industry Revenue (Million) Forecast, by Application 2019 & 2032
- Table 32: Thailandc DDoS Prevention Industry Revenue (Million) Forecast, by Application 2019 & 2032
- Table 33: Rest of Asia Pacific DDoS Prevention Industry Revenue (Million) Forecast, by Application 2019 & 2032
- Table 34: Global DDoS Prevention Industry Revenue Million Forecast, by Country 2019 & 2032
- Table 35: Brazil DDoS Prevention Industry Revenue (Million) Forecast, by Application 2019 & 2032
- Table 36: Argentina DDoS Prevention Industry Revenue (Million) Forecast, by Application 2019 & 2032
- Table 37: Peru DDoS Prevention Industry Revenue (Million) Forecast, by Application 2019 & 2032
- Table 38: Chile DDoS Prevention Industry Revenue (Million) Forecast, by Application 2019 & 2032
- Table 39: Colombia DDoS Prevention Industry Revenue (Million) Forecast, by Application 2019 & 2032
- Table 40: Ecuador DDoS Prevention Industry Revenue (Million) Forecast, by Application 2019 & 2032
- Table 41: Venezuela DDoS Prevention Industry Revenue (Million) Forecast, by Application 2019 & 2032
- Table 42: Rest of South America DDoS Prevention Industry Revenue (Million) Forecast, by Application 2019 & 2032
- Table 43: Global DDoS Prevention Industry Revenue Million Forecast, by Country 2019 & 2032
- Table 44: United States DDoS Prevention Industry Revenue (Million) Forecast, by Application 2019 & 2032
- Table 45: Canada DDoS Prevention Industry Revenue (Million) Forecast, by Application 2019 & 2032
- Table 46: Mexico DDoS Prevention Industry Revenue (Million) Forecast, by Application 2019 & 2032
- Table 47: Global DDoS Prevention Industry Revenue Million Forecast, by Country 2019 & 2032
- Table 48: United Arab Emirates DDoS Prevention Industry Revenue (Million) Forecast, by Application 2019 & 2032
- Table 49: Saudi Arabia DDoS Prevention Industry Revenue (Million) Forecast, by Application 2019 & 2032
- Table 50: South Africa DDoS Prevention Industry Revenue (Million) Forecast, by Application 2019 & 2032
- Table 51: Rest of Middle East and Africa DDoS Prevention Industry Revenue (Million) Forecast, by Application 2019 & 2032
- Table 52: Global DDoS Prevention Industry Revenue Million Forecast, by Component 2019 & 2032
- Table 53: Global DDoS Prevention Industry Revenue Million Forecast, by Deployment Type 2019 & 2032
- Table 54: Global DDoS Prevention Industry Revenue Million Forecast, by Size of Enterprise 2019 & 2032
- Table 55: Global DDoS Prevention Industry Revenue Million Forecast, by End-user Industry 2019 & 2032
- Table 56: Global DDoS Prevention Industry Revenue Million Forecast, by Country 2019 & 2032
- Table 57: Global DDoS Prevention Industry Revenue Million Forecast, by Component 2019 & 2032
- Table 58: Global DDoS Prevention Industry Revenue Million Forecast, by Deployment Type 2019 & 2032
- Table 59: Global DDoS Prevention Industry Revenue Million Forecast, by Size of Enterprise 2019 & 2032
- Table 60: Global DDoS Prevention Industry Revenue Million Forecast, by End-user Industry 2019 & 2032
- Table 61: Global DDoS Prevention Industry Revenue Million Forecast, by Country 2019 & 2032
- Table 62: Global DDoS Prevention Industry Revenue Million Forecast, by Component 2019 & 2032
- Table 63: Global DDoS Prevention Industry Revenue Million Forecast, by Deployment Type 2019 & 2032
- Table 64: Global DDoS Prevention Industry Revenue Million Forecast, by Size of Enterprise 2019 & 2032
- Table 65: Global DDoS Prevention Industry Revenue Million Forecast, by End-user Industry 2019 & 2032
- Table 66: Global DDoS Prevention Industry Revenue Million Forecast, by Country 2019 & 2032
- Table 67: Global DDoS Prevention Industry Revenue Million Forecast, by Component 2019 & 2032
- Table 68: Global DDoS Prevention Industry Revenue Million Forecast, by Deployment Type 2019 & 2032
- Table 69: Global DDoS Prevention Industry Revenue Million Forecast, by Size of Enterprise 2019 & 2032
- Table 70: Global DDoS Prevention Industry Revenue Million Forecast, by End-user Industry 2019 & 2032
- Table 71: Global DDoS Prevention Industry Revenue Million Forecast, by Country 2019 & 2032
Frequently Asked Questions
1. What is the projected Compound Annual Growth Rate (CAGR) of the DDoS Prevention Industry?
The projected CAGR is approximately 14.04%.
2. Which companies are prominent players in the DDoS Prevention Industry?
Key companies in the market include Corero Network Security Inc, Akamai Technologies Inc, F5 Networks Inc, Imperva Inc, Arbor Networks Inc (NetScout Systems Inc ), Neustar Inc, Radware Ltd, Cloudflare Inc, Verisign Inc, Nexusguard Ltd, Dosarrest Internet Security Ltd.
3. What are the main segments of the DDoS Prevention Industry?
The market segments include Component, Deployment Type, Size of Enterprise, End-user Industry.
4. Can you provide details about the market size?
The market size is estimated to be USD 4.15 Million as of 2022.
5. What are some drivers contributing to market growth?
Increasing Instances of Sophisticated DDoS Attacks; Introduction of Cost-effective Cloud-based and Hybrid Solutions; Proliferation of Technology and Adoption of IoT across Various Verticals.
6. What are the notable trends driving market growth?
Increasing Instances of Sophisticated DDoS Attacks to Drive the Market.
7. Are there any restraints impacting market growth?
Lack of Skilled and Trained Personnel.
8. Can you provide examples of recent developments in the market?
September 2022 - Liquid Networks, a business of Cassava Technologies, launched a Distributed Denial of Service (DDoS) Secure offering to its customers. The company announced that the service is offered to all potential Internet & IP transit clients and will provide these services to existing customers in the African region.
9. What pricing options are available for accessing the report?
Pricing options include single-user, multi-user, and enterprise licenses priced at USD 4750, USD 5250, and USD 8750 respectively.
10. Is the market size provided in terms of value or volume?
The market size is provided in terms of value, measured in Million.
11. Are there any specific market keywords associated with the report?
Yes, the market keyword associated with the report is "DDoS Prevention Industry," which aids in identifying and referencing the specific market segment covered.
12. How do I determine which pricing option suits my needs best?
The pricing options vary based on user requirements and access needs. Individual users may opt for single-user licenses, while businesses requiring broader access may choose multi-user or enterprise licenses for cost-effective access to the report.
13. Are there any additional resources or data provided in the DDoS Prevention Industry report?
While the report offers comprehensive insights, it's advisable to review the specific contents or supplementary materials provided to ascertain if additional resources or data are available.
14. How can I stay updated on further developments or reports in the DDoS Prevention Industry?
To stay informed about further developments, trends, and reports in the DDoS Prevention Industry, consider subscribing to industry newsletters, following relevant companies and organizations, or regularly checking reputable industry news sources and publications.
Methodology
Step 1 - Identification of Relevant Samples Size from Population Database


Step 2 - Approaches for Defining Global Market Size (Value, Volume* & Price*)

Note*: In applicable scenarios
Step 3 - Data Sources
Primary Research
- Web Analytics
- Survey Reports
- Research Institute
- Latest Research Reports
- Opinion Leaders
Secondary Research
- Annual Reports
- White Paper
- Latest Press Release
- Industry Association
- Paid Database
- Investor Presentations

Step 4 - Data Triangulation
Involves using different sources of information in order to increase the validity of a study
These sources are likely to be stakeholders in a program - participants, other researchers, program staff, other community members, and so on.
Then we put all data in single framework & apply various statistical tools to find out the dynamic on the market.
During the analysis stage, feedback from the stakeholder groups would be compared to determine areas of agreement as well as areas of divergence


