
Key Insights
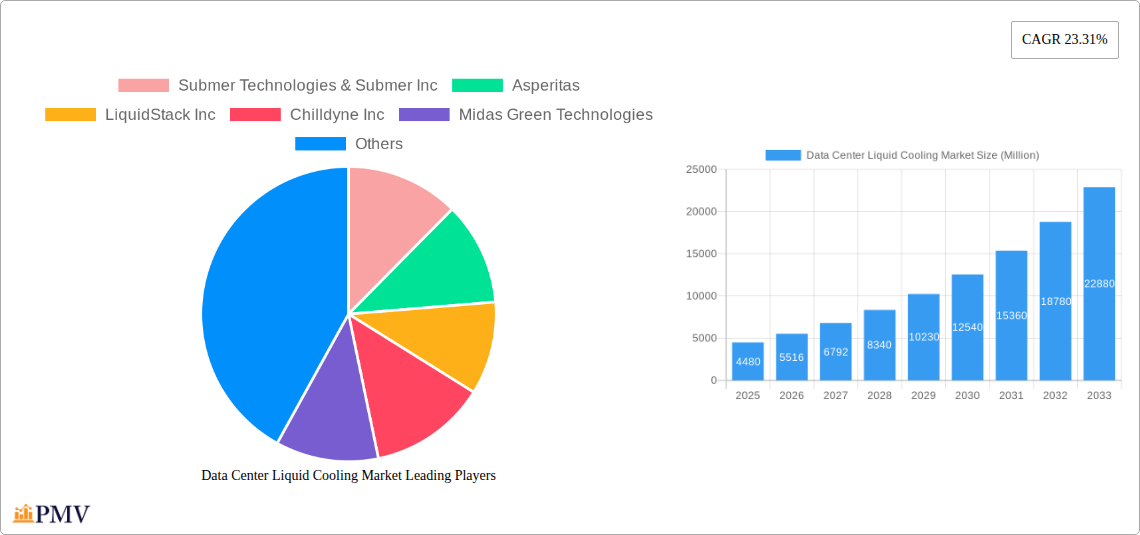
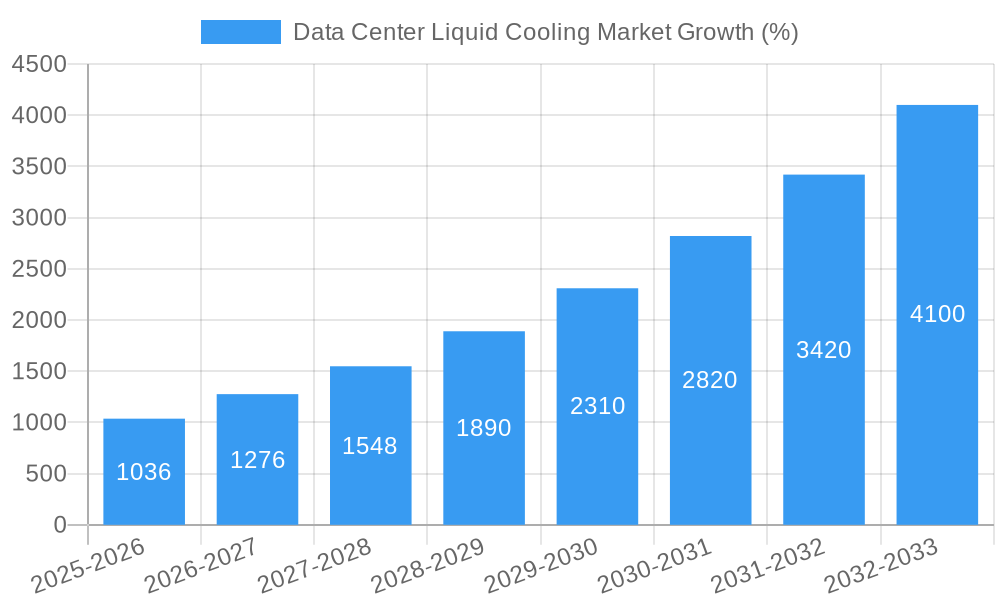
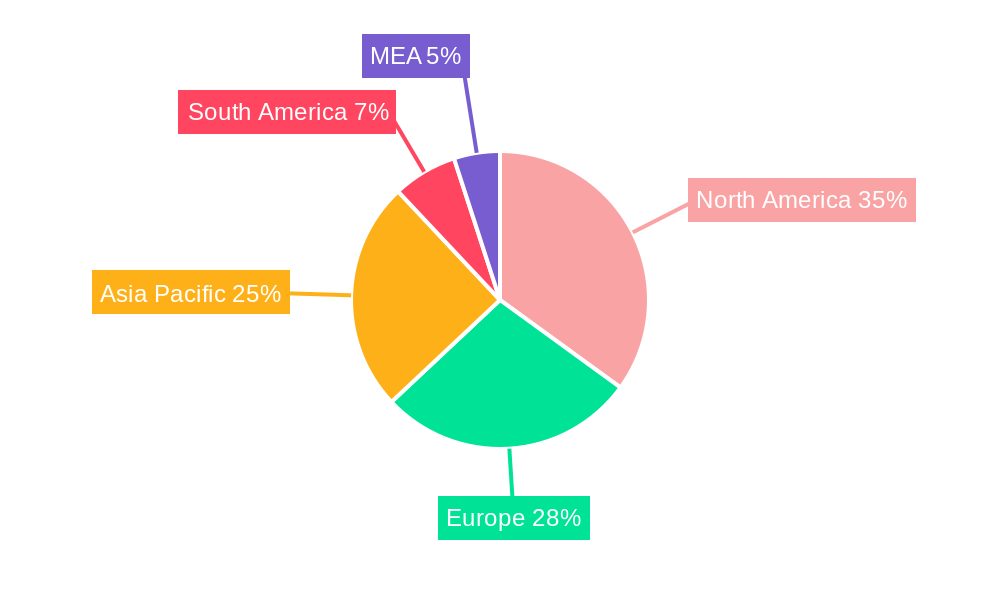
The Data Center Liquid Cooling market is experiencing robust growth, projected to reach a market size of $4.48 billion in 2025 and exhibiting a Compound Annual Growth Rate (CAGR) of 23.31% from 2025 to 2033. This surge is driven primarily by the increasing heat generated by high-density computing environments and the rising demand for energy-efficient cooling solutions within data centers. The escalating adoption of cloud computing and the expanding Big Data analytics sector further contribute to this market expansion. Key trends include a shift towards more sustainable and environmentally friendly cooling technologies, with companies investing heavily in research and development of advanced immersion cooling and rack-level liquid cooling systems. Furthermore, the market is witnessing increasing demand for managed services, simplifying deployment and maintenance for data center operators. While high initial investment costs for liquid cooling infrastructure can act as a restraint, the long-term operational cost savings and improved cooling efficiency are proving to be compelling factors for adoption. The segmentation reveals significant contributions from various deployment models (on-premise and managed services), cooling types (immersion, rack, server), and end-user industries (IT & Telecom, BFSI, Healthcare, Retail). North America and Asia Pacific are currently leading regions, fueled by strong technological advancements and high data center density. However, growth potential is significant across all regions as awareness of the benefits of liquid cooling continues to spread.
The competitive landscape is characterized by a mix of established players and emerging innovative companies. Major vendors like Submer Technologies, Asperitas, LiquidStack, and others are actively engaged in developing and deploying advanced liquid cooling technologies. The market is also witnessing significant participation from major IT hardware manufacturers like Lenovo and Fujitsu, integrating liquid cooling solutions into their server offerings. The increasing collaboration between cooling technology providers and data center operators will further accelerate market growth in the coming years. Continuous innovation in materials, designs, and management systems are key factors that will shape the future of the data center liquid cooling market, ensuring its continued expansion and wider adoption across various industries. The ongoing focus on energy efficiency and sustainability will play a crucial role in driving market demand and shaping product development strategies.
This comprehensive report provides an in-depth analysis of the Data Center Liquid Cooling Market, offering valuable insights for stakeholders across the industry value chain. Covering the period from 2019 to 2033, with a focus on 2025, this report meticulously examines market dynamics, competitive landscapes, technological advancements, and future growth prospects. The report incorporates extensive data analysis to forecast market size and growth, providing actionable intelligence for strategic decision-making. The total market size is predicted to reach xx Million by 2033.
Data Center Liquid Cooling Market Structure & Competitive Dynamics
This section analyzes the competitive landscape of the data center liquid cooling market, examining market concentration, innovation ecosystems, regulatory frameworks, product substitutes, end-user trends, and merger and acquisition (M&A) activities. The market is characterized by a mix of established players and emerging innovators, leading to a dynamic competitive landscape.
The market share is largely fragmented, with no single company holding a dominant position. However, key players like Submer Technologies & Submer Inc, Schneider Electric, and Vertiv Group Corp hold significant market share due to their established brand presence and extensive product portfolios. Smaller companies are focusing on niche segments, such as immersion cooling, to differentiate themselves.
Recent M&A activities, such as the acquisition of AIRCALO by Mitsubishi Electric in April 2024, signal a growing trend of consolidation in the industry. While exact deal values are not publicly disclosed for many transactions, these acquisitions often indicate a push to expand product portfolios and geographic reach. The average deal value for M&A activity within the last five years is estimated to be approximately xx Million.
- Market Concentration: Moderately fragmented.
- Innovation Ecosystems: Robust, with continuous development in immersion cooling and other advanced techniques.
- Regulatory Frameworks: Varying by region, impacting adoption rates and investment strategies.
- Product Substitutes: Air cooling systems, but liquid cooling offers significant advantages in terms of efficiency and sustainability.
- End-User Trends: Increasing demand driven by the growing need for higher computing power and energy efficiency in data centers.
Data Center Liquid Cooling Market Industry Trends & Insights
The data center liquid cooling market is experiencing robust growth, driven by several factors. The rising adoption of high-performance computing (HPC) systems and the increasing demand for energy-efficient data center infrastructure are major contributors to this growth. The global market is estimated to have a Compound Annual Growth Rate (CAGR) of xx% during the forecast period (2025-2033). Market penetration of liquid cooling systems is steadily increasing, with a projected xx% penetration by 2033, up from xx% in 2024. This growth is fueled by advancements in liquid cooling technologies, including immersion cooling, which offer significant improvements in cooling efficiency and reduced energy consumption compared to traditional air cooling methods.
Consumer preferences are shifting towards sustainable and environmentally friendly data center solutions, aligning with global efforts towards carbon neutrality. This trend boosts the demand for energy-efficient liquid cooling systems. Competitive dynamics are characterized by continuous innovation, strategic partnerships, and acquisitions. Companies are investing heavily in research and development to improve the efficiency, scalability, and reliability of their liquid cooling solutions.
Dominant Markets & Segments in Data Center Liquid Cooling Market
The North American market currently holds the largest share of the global data center liquid cooling market, driven by the region's high concentration of hyperscale data centers and robust technological advancements. However, the Asia-Pacific region is expected to witness the fastest growth during the forecast period, propelled by rapid economic development and increasing data center construction.
- Deployment Model: On-premise deployments currently dominate, but managed services are gaining traction due to their cost-effectiveness and scalability. Growth is expected to be higher for the managed service model.
- Type: Immersion cooling is experiencing rapid growth due to its superior cooling capabilities, followed by rack cooling and server cooling.
- End-User Industry: The IT & Telecom sector is the largest end-user, followed by BFSI and Healthcare. Growth is projected to be strongest in the IT & Telecom and BFSI sectors.
- Component: Chillers, heat exchangers, and pumps are the major components driving market demand. Growth is seen across all components.
Key Drivers:
- North America: High concentration of hyperscale data centers, strong technological innovation, and stringent environmental regulations.
- Asia-Pacific: Rapid economic growth, increasing data center construction, and government initiatives promoting digital transformation.
Data Center Liquid Cooling Market Product Innovations
Recent innovations focus on enhancing cooling efficiency, reducing costs, and improving scalability. The development of the Forced Convection Heat Sink (FCHS) package by Intel and Submer represents a significant breakthrough in single-phase immersion technology, enabling efficient cooling of high-power chips. This and other similar advancements are driving wider adoption of liquid cooling technologies across various data center applications. The market is witnessing a shift towards more sustainable and environmentally friendly designs, aligning with global sustainability initiatives.
Report Segmentation & Scope
This report segments the data center liquid cooling market based on deployment model (on-premise and managed services), type (immersion cooling, rack cooling, server cooling, and others), end-user industry (IT & Telecom, BFSI, Healthcare, Retail, and others), and component (Chillers, Heat Exchangers, Pumps, and Others). Each segment's market size, growth projections, and competitive dynamics are analyzed in detail.
Deployment Model: The on-premise segment holds a larger market share currently, but the managed services segment exhibits faster growth due to its scalability and cost-effectiveness.
Type: Immersion cooling is the fastest-growing segment due to its superior cooling capacity, while rack and server cooling segments maintain significant market shares.
End-User Industry: The IT & Telecom industry is the largest market segment, but BFSI and Healthcare are exhibiting strong growth potential.
Component: Chillers and heat exchangers hold the largest market share, and pumps are growing alongside the immersion cooling solutions.
Key Drivers of Data Center Liquid Cooling Market Growth
The key drivers for the growth of the data center liquid cooling market are:
- Increased demand for high-density computing: The need for efficient cooling solutions to support the rising density of servers in data centers.
- Rising energy costs: Liquid cooling offers substantial energy savings compared to traditional air cooling methods.
- Stringent environmental regulations: Growing focus on reducing carbon emissions is pushing data centers towards more sustainable solutions.
- Technological advancements: Innovations in immersion cooling and other liquid cooling technologies are improving efficiency and lowering costs.
Challenges in the Data Center Liquid Cooling Market Sector
The data center liquid cooling market faces some key challenges:
- High initial investment costs: The upfront investment for liquid cooling systems can be substantial, hindering adoption in smaller data centers.
- Maintenance and operational complexities: Liquid cooling systems can require specialized maintenance and operational expertise.
- Limited availability of skilled labor: A shortage of professionals with expertise in designing, installing, and maintaining liquid cooling systems.
- Potential environmental concerns: Concerns about the environmental impact of the coolants used in liquid cooling systems, despite improvements in fluid selection.
Leading Players in the Data Center Liquid Cooling Market Market
- Submer Technologies & Submer Inc
- Asperitas
- LiquidStack Inc
- Chilldyne Inc
- Midas Green Technologies
- USystems Ltd (Legrand Group)
- LiquidCool Solutions Inc
- Lenovo Group Limited
- Fujitsu Ltd
- Kaori Heat Treatment Co Ltd
- Iceotope Technologies Ltd
- Alfa Laval Corporate AB
- CoolIT Systems Inc
- Engineered Fluids Inc
- Asetek Inc A/S
- Wakefield Thermal Solutions Inc
- 3M Company
- Rittal GmbH & Co KG
- Solvay S.A.
- Schneider Electric
- Vertiv Group Corp
- Wiwynn Corporation
- Mikros Technologies
- Green Revolution Cooling Inc
Key Developments in Data Center Liquid Cooling Market Sector
- October 2023: Intel and Submer collaborated to develop the Forced Convection Heat Sink (FCHS) package, a breakthrough in single-phase immersion technology.
- April 2024: Mitsubishi Electric acquired AIRCALO, expanding its hydronic HVAC systems business in Europe.
Strategic Data Center Liquid Cooling Market Outlook
The data center liquid cooling market is poised for significant growth, driven by increasing demand for energy-efficient and high-performance computing solutions. Strategic opportunities exist for companies that can innovate in areas such as immersion cooling, develop sustainable coolants, and offer comprehensive managed services. Further advancements in heat transfer technologies and integration with AI-powered management systems will play a critical role in shaping the future of the market. The market's growth will be strongly correlated with the overall expansion of data center infrastructure globally, indicating strong potential for continued expansion in the coming years.
Data Center Liquid Cooling Market Segmentation
-
1. Deployment Model
- 1.1. On-premise
- 1.2. Managed Services
-
2. Type
- 2.1. Immersion Cooling
- 2.2. Rack Cooling
- 2.3. Server Cooling
- 2.4. Others
-
3. End-User Industry
- 3.1. IT & Telecom
- 3.2. BFSI
- 3.3. Healthcare
- 3.4. Retail
- 3.5. Others
-
4. Component
- 4.1. Chillers
- 4.2. Heat Exchangers
- 4.3. Pumps
- 4.4. Others
Data Center Liquid Cooling Market Segmentation By Geography
- 1. North America
- 2. Europe
- 3. Asia
- 4. Australia and New Zealand
- 5. Latin America
- 6. Middle East and Africa
Data Center Liquid Cooling Market REPORT HIGHLIGHTS
| Aspects | Details |
|---|---|
| Study Period | 2019-2033 |
| Base Year | 2024 |
| Estimated Year | 2025 |
| Forecast Period | 2025-2033 |
| Historical Period | 2019-2024 |
| Growth Rate | CAGR of 23.31% from 2019-2033 |
| Segmentation |
|
Table of Contents
- 1. Introduction
- 1.1. Research Scope
- 1.2. Market Segmentation
- 1.3. Research Methodology
- 1.4. Definitions and Assumptions
- 2. Executive Summary
- 2.1. Introduction
- 3. Market Dynamics
- 3.1. Introduction
- 3.2. Market Drivers
- 3.2.1. Development of IT Infrastructure in the Region; Emergence of Green Data Centers
- 3.3. Market Restrains
- 3.3.1 Costs
- 3.3.2 Adaptability Requirements
- 3.3.3 and Power Outages
- 3.4. Market Trends
- 3.4.1. Edge Computing to Witness Significant Growth
- 4. Market Factor Analysis
- 4.1. Porters Five Forces
- 4.2. Supply/Value Chain
- 4.3. PESTEL analysis
- 4.4. Market Entropy
- 4.5. Patent/Trademark Analysis
- 5. Global Data Center Liquid Cooling Market Analysis, Insights and Forecast, 2019-2031
- 5.1. Market Analysis, Insights and Forecast - by Deployment Model
- 5.1.1. On-premise
- 5.1.2. Managed Services
- 5.2. Market Analysis, Insights and Forecast - by Type
- 5.2.1. Immersion Cooling
- 5.2.2. Rack Cooling
- 5.2.3. Server Cooling
- 5.2.4. Others
- 5.3. Market Analysis, Insights and Forecast - by End-User Industry
- 5.3.1. IT & Telecom
- 5.3.2. BFSI
- 5.3.3. Healthcare
- 5.3.4. Retail
- 5.3.5. Others
- 5.4. Market Analysis, Insights and Forecast - by Component
- 5.4.1. Chillers
- 5.4.2. Heat Exchangers
- 5.4.3. Pumps
- 5.4.4. Others
- 5.5. Market Analysis, Insights and Forecast - by Region
- 5.5.1. North America
- 5.5.2. Europe
- 5.5.3. Asia
- 5.5.4. Australia and New Zealand
- 5.5.5. Latin America
- 5.5.6. Middle East and Africa
- 5.1. Market Analysis, Insights and Forecast - by Deployment Model
- 6. North America Data Center Liquid Cooling Market Analysis, Insights and Forecast, 2019-2031
- 6.1. Market Analysis, Insights and Forecast - by Deployment Model
- 6.1.1. On-premise
- 6.1.2. Managed Services
- 6.2. Market Analysis, Insights and Forecast - by Type
- 6.2.1. Immersion Cooling
- 6.2.2. Rack Cooling
- 6.2.3. Server Cooling
- 6.2.4. Others
- 6.3. Market Analysis, Insights and Forecast - by End-User Industry
- 6.3.1. IT & Telecom
- 6.3.2. BFSI
- 6.3.3. Healthcare
- 6.3.4. Retail
- 6.3.5. Others
- 6.4. Market Analysis, Insights and Forecast - by Component
- 6.4.1. Chillers
- 6.4.2. Heat Exchangers
- 6.4.3. Pumps
- 6.4.4. Others
- 6.1. Market Analysis, Insights and Forecast - by Deployment Model
- 7. Europe Data Center Liquid Cooling Market Analysis, Insights and Forecast, 2019-2031
- 7.1. Market Analysis, Insights and Forecast - by Deployment Model
- 7.1.1. On-premise
- 7.1.2. Managed Services
- 7.2. Market Analysis, Insights and Forecast - by Type
- 7.2.1. Immersion Cooling
- 7.2.2. Rack Cooling
- 7.2.3. Server Cooling
- 7.2.4. Others
- 7.3. Market Analysis, Insights and Forecast - by End-User Industry
- 7.3.1. IT & Telecom
- 7.3.2. BFSI
- 7.3.3. Healthcare
- 7.3.4. Retail
- 7.3.5. Others
- 7.4. Market Analysis, Insights and Forecast - by Component
- 7.4.1. Chillers
- 7.4.2. Heat Exchangers
- 7.4.3. Pumps
- 7.4.4. Others
- 7.1. Market Analysis, Insights and Forecast - by Deployment Model
- 8. Asia Data Center Liquid Cooling Market Analysis, Insights and Forecast, 2019-2031
- 8.1. Market Analysis, Insights and Forecast - by Deployment Model
- 8.1.1. On-premise
- 8.1.2. Managed Services
- 8.2. Market Analysis, Insights and Forecast - by Type
- 8.2.1. Immersion Cooling
- 8.2.2. Rack Cooling
- 8.2.3. Server Cooling
- 8.2.4. Others
- 8.3. Market Analysis, Insights and Forecast - by End-User Industry
- 8.3.1. IT & Telecom
- 8.3.2. BFSI
- 8.3.3. Healthcare
- 8.3.4. Retail
- 8.3.5. Others
- 8.4. Market Analysis, Insights and Forecast - by Component
- 8.4.1. Chillers
- 8.4.2. Heat Exchangers
- 8.4.3. Pumps
- 8.4.4. Others
- 8.1. Market Analysis, Insights and Forecast - by Deployment Model
- 9. Australia and New Zealand Data Center Liquid Cooling Market Analysis, Insights and Forecast, 2019-2031
- 9.1. Market Analysis, Insights and Forecast - by Deployment Model
- 9.1.1. On-premise
- 9.1.2. Managed Services
- 9.2. Market Analysis, Insights and Forecast - by Type
- 9.2.1. Immersion Cooling
- 9.2.2. Rack Cooling
- 9.2.3. Server Cooling
- 9.2.4. Others
- 9.3. Market Analysis, Insights and Forecast - by End-User Industry
- 9.3.1. IT & Telecom
- 9.3.2. BFSI
- 9.3.3. Healthcare
- 9.3.4. Retail
- 9.3.5. Others
- 9.4. Market Analysis, Insights and Forecast - by Component
- 9.4.1. Chillers
- 9.4.2. Heat Exchangers
- 9.4.3. Pumps
- 9.4.4. Others
- 9.1. Market Analysis, Insights and Forecast - by Deployment Model
- 10. Latin America Data Center Liquid Cooling Market Analysis, Insights and Forecast, 2019-2031
- 10.1. Market Analysis, Insights and Forecast - by Deployment Model
- 10.1.1. On-premise
- 10.1.2. Managed Services
- 10.2. Market Analysis, Insights and Forecast - by Type
- 10.2.1. Immersion Cooling
- 10.2.2. Rack Cooling
- 10.2.3. Server Cooling
- 10.2.4. Others
- 10.3. Market Analysis, Insights and Forecast - by End-User Industry
- 10.3.1. IT & Telecom
- 10.3.2. BFSI
- 10.3.3. Healthcare
- 10.3.4. Retail
- 10.3.5. Others
- 10.4. Market Analysis, Insights and Forecast - by Component
- 10.4.1. Chillers
- 10.4.2. Heat Exchangers
- 10.4.3. Pumps
- 10.4.4. Others
- 10.1. Market Analysis, Insights and Forecast - by Deployment Model
- 11. Middle East and Africa Data Center Liquid Cooling Market Analysis, Insights and Forecast, 2019-2031
- 11.1. Market Analysis, Insights and Forecast - by Deployment Model
- 11.1.1. On-premise
- 11.1.2. Managed Services
- 11.2. Market Analysis, Insights and Forecast - by Type
- 11.2.1. Immersion Cooling
- 11.2.2. Rack Cooling
- 11.2.3. Server Cooling
- 11.2.4. Others
- 11.3. Market Analysis, Insights and Forecast - by End-User Industry
- 11.3.1. IT & Telecom
- 11.3.2. BFSI
- 11.3.3. Healthcare
- 11.3.4. Retail
- 11.3.5. Others
- 11.4. Market Analysis, Insights and Forecast - by Component
- 11.4.1. Chillers
- 11.4.2. Heat Exchangers
- 11.4.3. Pumps
- 11.4.4. Others
- 11.1. Market Analysis, Insights and Forecast - by Deployment Model
- 12. North America Data Center Liquid Cooling Market Analysis, Insights and Forecast, 2019-2031
- 12.1. Market Analysis, Insights and Forecast - By Country/Sub-region
- 12.1.1 United States
- 12.1.2 Canada
- 12.1.3 Mexico
- 13. Europe Data Center Liquid Cooling Market Analysis, Insights and Forecast, 2019-2031
- 13.1. Market Analysis, Insights and Forecast - By Country/Sub-region
- 13.1.1 Germany
- 13.1.2 United Kingdom
- 13.1.3 France
- 13.1.4 Spain
- 13.1.5 Italy
- 13.1.6 Spain
- 13.1.7 Belgium
- 13.1.8 Netherland
- 13.1.9 Nordics
- 13.1.10 Rest of Europe
- 14. Asia Pacific Data Center Liquid Cooling Market Analysis, Insights and Forecast, 2019-2031
- 14.1. Market Analysis, Insights and Forecast - By Country/Sub-region
- 14.1.1 China
- 14.1.2 Japan
- 14.1.3 India
- 14.1.4 South Korea
- 14.1.5 Southeast Asia
- 14.1.6 Australia
- 14.1.7 Indonesia
- 14.1.8 Phillipes
- 14.1.9 Singapore
- 14.1.10 Thailandc
- 14.1.11 Rest of Asia Pacific
- 15. South America Data Center Liquid Cooling Market Analysis, Insights and Forecast, 2019-2031
- 15.1. Market Analysis, Insights and Forecast - By Country/Sub-region
- 15.1.1 Brazil
- 15.1.2 Argentina
- 15.1.3 Peru
- 15.1.4 Chile
- 15.1.5 Colombia
- 15.1.6 Ecuador
- 15.1.7 Venezuela
- 15.1.8 Rest of South America
- 16. MEA Data Center Liquid Cooling Market Analysis, Insights and Forecast, 2019-2031
- 16.1. Market Analysis, Insights and Forecast - By Country/Sub-region
- 16.1.1 United Arab Emirates
- 16.1.2 Saudi Arabia
- 16.1.3 South Africa
- 16.1.4 Rest of Middle East and Africa
- 17. Competitive Analysis
- 17.1. Global Market Share Analysis 2024
- 17.2. Company Profiles
- 17.2.1 Submer Technologies & Submer Inc
- 17.2.1.1. Overview
- 17.2.1.2. Products
- 17.2.1.3. SWOT Analysis
- 17.2.1.4. Recent Developments
- 17.2.1.5. Financials (Based on Availability)
- 17.2.2 Asperitas
- 17.2.2.1. Overview
- 17.2.2.2. Products
- 17.2.2.3. SWOT Analysis
- 17.2.2.4. Recent Developments
- 17.2.2.5. Financials (Based on Availability)
- 17.2.3 LiquidStack Inc
- 17.2.3.1. Overview
- 17.2.3.2. Products
- 17.2.3.3. SWOT Analysis
- 17.2.3.4. Recent Developments
- 17.2.3.5. Financials (Based on Availability)
- 17.2.4 Chilldyne Inc
- 17.2.4.1. Overview
- 17.2.4.2. Products
- 17.2.4.3. SWOT Analysis
- 17.2.4.4. Recent Developments
- 17.2.4.5. Financials (Based on Availability)
- 17.2.5 Midas Green Technologies
- 17.2.5.1. Overview
- 17.2.5.2. Products
- 17.2.5.3. SWOT Analysis
- 17.2.5.4. Recent Developments
- 17.2.5.5. Financials (Based on Availability)
- 17.2.6 USystems Ltd (Legrand Group)
- 17.2.6.1. Overview
- 17.2.6.2. Products
- 17.2.6.3. SWOT Analysis
- 17.2.6.4. Recent Developments
- 17.2.6.5. Financials (Based on Availability)
- 17.2.7 LiquidCool Solutions Inc
- 17.2.7.1. Overview
- 17.2.7.2. Products
- 17.2.7.3. SWOT Analysis
- 17.2.7.4. Recent Developments
- 17.2.7.5. Financials (Based on Availability)
- 17.2.8 Lenovo Group Limited
- 17.2.8.1. Overview
- 17.2.8.2. Products
- 17.2.8.3. SWOT Analysis
- 17.2.8.4. Recent Developments
- 17.2.8.5. Financials (Based on Availability)
- 17.2.9 Fujitsu Ltd
- 17.2.9.1. Overview
- 17.2.9.2. Products
- 17.2.9.3. SWOT Analysis
- 17.2.9.4. Recent Developments
- 17.2.9.5. Financials (Based on Availability)
- 17.2.10 Kaori Heat Treatment Co Ltd
- 17.2.10.1. Overview
- 17.2.10.2. Products
- 17.2.10.3. SWOT Analysis
- 17.2.10.4. Recent Developments
- 17.2.10.5. Financials (Based on Availability)
- 17.2.11 Iceotope Technologies Ltd
- 17.2.11.1. Overview
- 17.2.11.2. Products
- 17.2.11.3. SWOT Analysis
- 17.2.11.4. Recent Developments
- 17.2.11.5. Financials (Based on Availability)
- 17.2.12 Alfa Laval Corporate AB
- 17.2.12.1. Overview
- 17.2.12.2. Products
- 17.2.12.3. SWOT Analysis
- 17.2.12.4. Recent Developments
- 17.2.12.5. Financials (Based on Availability)
- 17.2.13 CoolIT Systems Inc
- 17.2.13.1. Overview
- 17.2.13.2. Products
- 17.2.13.3. SWOT Analysis
- 17.2.13.4. Recent Developments
- 17.2.13.5. Financials (Based on Availability)
- 17.2.14 Engineered Fluids Inc
- 17.2.14.1. Overview
- 17.2.14.2. Products
- 17.2.14.3. SWOT Analysis
- 17.2.14.4. Recent Developments
- 17.2.14.5. Financials (Based on Availability)
- 17.2.15 Asetek Inc A/S
- 17.2.15.1. Overview
- 17.2.15.2. Products
- 17.2.15.3. SWOT Analysis
- 17.2.15.4. Recent Developments
- 17.2.15.5. Financials (Based on Availability)
- 17.2.16 Wakefield Thermal Solutions Inc
- 17.2.16.1. Overview
- 17.2.16.2. Products
- 17.2.16.3. SWOT Analysis
- 17.2.16.4. Recent Developments
- 17.2.16.5. Financials (Based on Availability)
- 17.2.17 3M Company
- 17.2.17.1. Overview
- 17.2.17.2. Products
- 17.2.17.3. SWOT Analysis
- 17.2.17.4. Recent Developments
- 17.2.17.5. Financials (Based on Availability)
- 17.2.18 Rittal GmbH & Co KG
- 17.2.18.1. Overview
- 17.2.18.2. Products
- 17.2.18.3. SWOT Analysis
- 17.2.18.4. Recent Developments
- 17.2.18.5. Financials (Based on Availability)
- 17.2.19 Solvay S
- 17.2.19.1. Overview
- 17.2.19.2. Products
- 17.2.19.3. SWOT Analysis
- 17.2.19.4. Recent Developments
- 17.2.19.5. Financials (Based on Availability)
- 17.2.20 Schneider Electric
- 17.2.20.1. Overview
- 17.2.20.2. Products
- 17.2.20.3. SWOT Analysis
- 17.2.20.4. Recent Developments
- 17.2.20.5. Financials (Based on Availability)
- 17.2.21 Vertiv Group Corp
- 17.2.21.1. Overview
- 17.2.21.2. Products
- 17.2.21.3. SWOT Analysis
- 17.2.21.4. Recent Developments
- 17.2.21.5. Financials (Based on Availability)
- 17.2.22 Wiwynn Corporation
- 17.2.22.1. Overview
- 17.2.22.2. Products
- 17.2.22.3. SWOT Analysis
- 17.2.22.4. Recent Developments
- 17.2.22.5. Financials (Based on Availability)
- 17.2.23 Mikros Technologies
- 17.2.23.1. Overview
- 17.2.23.2. Products
- 17.2.23.3. SWOT Analysis
- 17.2.23.4. Recent Developments
- 17.2.23.5. Financials (Based on Availability)
- 17.2.24 Green Revolution Cooling Inc
- 17.2.24.1. Overview
- 17.2.24.2. Products
- 17.2.24.3. SWOT Analysis
- 17.2.24.4. Recent Developments
- 17.2.24.5. Financials (Based on Availability)
- 17.2.1 Submer Technologies & Submer Inc
List of Figures
- Figure 1: Global Data Center Liquid Cooling Market Revenue Breakdown (Million, %) by Region 2024 & 2032
- Figure 2: Global Data Center Liquid Cooling Market Volume Breakdown (K Unit, %) by Region 2024 & 2032
- Figure 3: North America Data Center Liquid Cooling Market Revenue (Million), by Country 2024 & 2032
- Figure 4: North America Data Center Liquid Cooling Market Volume (K Unit), by Country 2024 & 2032
- Figure 5: North America Data Center Liquid Cooling Market Revenue Share (%), by Country 2024 & 2032
- Figure 6: North America Data Center Liquid Cooling Market Volume Share (%), by Country 2024 & 2032
- Figure 7: Europe Data Center Liquid Cooling Market Revenue (Million), by Country 2024 & 2032
- Figure 8: Europe Data Center Liquid Cooling Market Volume (K Unit), by Country 2024 & 2032
- Figure 9: Europe Data Center Liquid Cooling Market Revenue Share (%), by Country 2024 & 2032
- Figure 10: Europe Data Center Liquid Cooling Market Volume Share (%), by Country 2024 & 2032
- Figure 11: Asia Pacific Data Center Liquid Cooling Market Revenue (Million), by Country 2024 & 2032
- Figure 12: Asia Pacific Data Center Liquid Cooling Market Volume (K Unit), by Country 2024 & 2032
- Figure 13: Asia Pacific Data Center Liquid Cooling Market Revenue Share (%), by Country 2024 & 2032
- Figure 14: Asia Pacific Data Center Liquid Cooling Market Volume Share (%), by Country 2024 & 2032
- Figure 15: South America Data Center Liquid Cooling Market Revenue (Million), by Country 2024 & 2032
- Figure 16: South America Data Center Liquid Cooling Market Volume (K Unit), by Country 2024 & 2032
- Figure 17: South America Data Center Liquid Cooling Market Revenue Share (%), by Country 2024 & 2032
- Figure 18: South America Data Center Liquid Cooling Market Volume Share (%), by Country 2024 & 2032
- Figure 19: MEA Data Center Liquid Cooling Market Revenue (Million), by Country 2024 & 2032
- Figure 20: MEA Data Center Liquid Cooling Market Volume (K Unit), by Country 2024 & 2032
- Figure 21: MEA Data Center Liquid Cooling Market Revenue Share (%), by Country 2024 & 2032
- Figure 22: MEA Data Center Liquid Cooling Market Volume Share (%), by Country 2024 & 2032
- Figure 23: North America Data Center Liquid Cooling Market Revenue (Million), by Deployment Model 2024 & 2032
- Figure 24: North America Data Center Liquid Cooling Market Volume (K Unit), by Deployment Model 2024 & 2032
- Figure 25: North America Data Center Liquid Cooling Market Revenue Share (%), by Deployment Model 2024 & 2032
- Figure 26: North America Data Center Liquid Cooling Market Volume Share (%), by Deployment Model 2024 & 2032
- Figure 27: North America Data Center Liquid Cooling Market Revenue (Million), by Type 2024 & 2032
- Figure 28: North America Data Center Liquid Cooling Market Volume (K Unit), by Type 2024 & 2032
- Figure 29: North America Data Center Liquid Cooling Market Revenue Share (%), by Type 2024 & 2032
- Figure 30: North America Data Center Liquid Cooling Market Volume Share (%), by Type 2024 & 2032
- Figure 31: North America Data Center Liquid Cooling Market Revenue (Million), by End-User Industry 2024 & 2032
- Figure 32: North America Data Center Liquid Cooling Market Volume (K Unit), by End-User Industry 2024 & 2032
- Figure 33: North America Data Center Liquid Cooling Market Revenue Share (%), by End-User Industry 2024 & 2032
- Figure 34: North America Data Center Liquid Cooling Market Volume Share (%), by End-User Industry 2024 & 2032
- Figure 35: North America Data Center Liquid Cooling Market Revenue (Million), by Component 2024 & 2032
- Figure 36: North America Data Center Liquid Cooling Market Volume (K Unit), by Component 2024 & 2032
- Figure 37: North America Data Center Liquid Cooling Market Revenue Share (%), by Component 2024 & 2032
- Figure 38: North America Data Center Liquid Cooling Market Volume Share (%), by Component 2024 & 2032
- Figure 39: North America Data Center Liquid Cooling Market Revenue (Million), by Country 2024 & 2032
- Figure 40: North America Data Center Liquid Cooling Market Volume (K Unit), by Country 2024 & 2032
- Figure 41: North America Data Center Liquid Cooling Market Revenue Share (%), by Country 2024 & 2032
- Figure 42: North America Data Center Liquid Cooling Market Volume Share (%), by Country 2024 & 2032
- Figure 43: Europe Data Center Liquid Cooling Market Revenue (Million), by Deployment Model 2024 & 2032
- Figure 44: Europe Data Center Liquid Cooling Market Volume (K Unit), by Deployment Model 2024 & 2032
- Figure 45: Europe Data Center Liquid Cooling Market Revenue Share (%), by Deployment Model 2024 & 2032
- Figure 46: Europe Data Center Liquid Cooling Market Volume Share (%), by Deployment Model 2024 & 2032
- Figure 47: Europe Data Center Liquid Cooling Market Revenue (Million), by Type 2024 & 2032
- Figure 48: Europe Data Center Liquid Cooling Market Volume (K Unit), by Type 2024 & 2032
- Figure 49: Europe Data Center Liquid Cooling Market Revenue Share (%), by Type 2024 & 2032
- Figure 50: Europe Data Center Liquid Cooling Market Volume Share (%), by Type 2024 & 2032
- Figure 51: Europe Data Center Liquid Cooling Market Revenue (Million), by End-User Industry 2024 & 2032
- Figure 52: Europe Data Center Liquid Cooling Market Volume (K Unit), by End-User Industry 2024 & 2032
- Figure 53: Europe Data Center Liquid Cooling Market Revenue Share (%), by End-User Industry 2024 & 2032
- Figure 54: Europe Data Center Liquid Cooling Market Volume Share (%), by End-User Industry 2024 & 2032
- Figure 55: Europe Data Center Liquid Cooling Market Revenue (Million), by Component 2024 & 2032
- Figure 56: Europe Data Center Liquid Cooling Market Volume (K Unit), by Component 2024 & 2032
- Figure 57: Europe Data Center Liquid Cooling Market Revenue Share (%), by Component 2024 & 2032
- Figure 58: Europe Data Center Liquid Cooling Market Volume Share (%), by Component 2024 & 2032
- Figure 59: Europe Data Center Liquid Cooling Market Revenue (Million), by Country 2024 & 2032
- Figure 60: Europe Data Center Liquid Cooling Market Volume (K Unit), by Country 2024 & 2032
- Figure 61: Europe Data Center Liquid Cooling Market Revenue Share (%), by Country 2024 & 2032
- Figure 62: Europe Data Center Liquid Cooling Market Volume Share (%), by Country 2024 & 2032
- Figure 63: Asia Data Center Liquid Cooling Market Revenue (Million), by Deployment Model 2024 & 2032
- Figure 64: Asia Data Center Liquid Cooling Market Volume (K Unit), by Deployment Model 2024 & 2032
- Figure 65: Asia Data Center Liquid Cooling Market Revenue Share (%), by Deployment Model 2024 & 2032
- Figure 66: Asia Data Center Liquid Cooling Market Volume Share (%), by Deployment Model 2024 & 2032
- Figure 67: Asia Data Center Liquid Cooling Market Revenue (Million), by Type 2024 & 2032
- Figure 68: Asia Data Center Liquid Cooling Market Volume (K Unit), by Type 2024 & 2032
- Figure 69: Asia Data Center Liquid Cooling Market Revenue Share (%), by Type 2024 & 2032
- Figure 70: Asia Data Center Liquid Cooling Market Volume Share (%), by Type 2024 & 2032
- Figure 71: Asia Data Center Liquid Cooling Market Revenue (Million), by End-User Industry 2024 & 2032
- Figure 72: Asia Data Center Liquid Cooling Market Volume (K Unit), by End-User Industry 2024 & 2032
- Figure 73: Asia Data Center Liquid Cooling Market Revenue Share (%), by End-User Industry 2024 & 2032
- Figure 74: Asia Data Center Liquid Cooling Market Volume Share (%), by End-User Industry 2024 & 2032
- Figure 75: Asia Data Center Liquid Cooling Market Revenue (Million), by Component 2024 & 2032
- Figure 76: Asia Data Center Liquid Cooling Market Volume (K Unit), by Component 2024 & 2032
- Figure 77: Asia Data Center Liquid Cooling Market Revenue Share (%), by Component 2024 & 2032
- Figure 78: Asia Data Center Liquid Cooling Market Volume Share (%), by Component 2024 & 2032
- Figure 79: Asia Data Center Liquid Cooling Market Revenue (Million), by Country 2024 & 2032
- Figure 80: Asia Data Center Liquid Cooling Market Volume (K Unit), by Country 2024 & 2032
- Figure 81: Asia Data Center Liquid Cooling Market Revenue Share (%), by Country 2024 & 2032
- Figure 82: Asia Data Center Liquid Cooling Market Volume Share (%), by Country 2024 & 2032
- Figure 83: Australia and New Zealand Data Center Liquid Cooling Market Revenue (Million), by Deployment Model 2024 & 2032
- Figure 84: Australia and New Zealand Data Center Liquid Cooling Market Volume (K Unit), by Deployment Model 2024 & 2032
- Figure 85: Australia and New Zealand Data Center Liquid Cooling Market Revenue Share (%), by Deployment Model 2024 & 2032
- Figure 86: Australia and New Zealand Data Center Liquid Cooling Market Volume Share (%), by Deployment Model 2024 & 2032
- Figure 87: Australia and New Zealand Data Center Liquid Cooling Market Revenue (Million), by Type 2024 & 2032
- Figure 88: Australia and New Zealand Data Center Liquid Cooling Market Volume (K Unit), by Type 2024 & 2032
- Figure 89: Australia and New Zealand Data Center Liquid Cooling Market Revenue Share (%), by Type 2024 & 2032
- Figure 90: Australia and New Zealand Data Center Liquid Cooling Market Volume Share (%), by Type 2024 & 2032
- Figure 91: Australia and New Zealand Data Center Liquid Cooling Market Revenue (Million), by End-User Industry 2024 & 2032
- Figure 92: Australia and New Zealand Data Center Liquid Cooling Market Volume (K Unit), by End-User Industry 2024 & 2032
- Figure 93: Australia and New Zealand Data Center Liquid Cooling Market Revenue Share (%), by End-User Industry 2024 & 2032
- Figure 94: Australia and New Zealand Data Center Liquid Cooling Market Volume Share (%), by End-User Industry 2024 & 2032
- Figure 95: Australia and New Zealand Data Center Liquid Cooling Market Revenue (Million), by Component 2024 & 2032
- Figure 96: Australia and New Zealand Data Center Liquid Cooling Market Volume (K Unit), by Component 2024 & 2032
- Figure 97: Australia and New Zealand Data Center Liquid Cooling Market Revenue Share (%), by Component 2024 & 2032
- Figure 98: Australia and New Zealand Data Center Liquid Cooling Market Volume Share (%), by Component 2024 & 2032
- Figure 99: Australia and New Zealand Data Center Liquid Cooling Market Revenue (Million), by Country 2024 & 2032
- Figure 100: Australia and New Zealand Data Center Liquid Cooling Market Volume (K Unit), by Country 2024 & 2032
- Figure 101: Australia and New Zealand Data Center Liquid Cooling Market Revenue Share (%), by Country 2024 & 2032
- Figure 102: Australia and New Zealand Data Center Liquid Cooling Market Volume Share (%), by Country 2024 & 2032
- Figure 103: Latin America Data Center Liquid Cooling Market Revenue (Million), by Deployment Model 2024 & 2032
- Figure 104: Latin America Data Center Liquid Cooling Market Volume (K Unit), by Deployment Model 2024 & 2032
- Figure 105: Latin America Data Center Liquid Cooling Market Revenue Share (%), by Deployment Model 2024 & 2032
- Figure 106: Latin America Data Center Liquid Cooling Market Volume Share (%), by Deployment Model 2024 & 2032
- Figure 107: Latin America Data Center Liquid Cooling Market Revenue (Million), by Type 2024 & 2032
- Figure 108: Latin America Data Center Liquid Cooling Market Volume (K Unit), by Type 2024 & 2032
- Figure 109: Latin America Data Center Liquid Cooling Market Revenue Share (%), by Type 2024 & 2032
- Figure 110: Latin America Data Center Liquid Cooling Market Volume Share (%), by Type 2024 & 2032
- Figure 111: Latin America Data Center Liquid Cooling Market Revenue (Million), by End-User Industry 2024 & 2032
- Figure 112: Latin America Data Center Liquid Cooling Market Volume (K Unit), by End-User Industry 2024 & 2032
- Figure 113: Latin America Data Center Liquid Cooling Market Revenue Share (%), by End-User Industry 2024 & 2032
- Figure 114: Latin America Data Center Liquid Cooling Market Volume Share (%), by End-User Industry 2024 & 2032
- Figure 115: Latin America Data Center Liquid Cooling Market Revenue (Million), by Component 2024 & 2032
- Figure 116: Latin America Data Center Liquid Cooling Market Volume (K Unit), by Component 2024 & 2032
- Figure 117: Latin America Data Center Liquid Cooling Market Revenue Share (%), by Component 2024 & 2032
- Figure 118: Latin America Data Center Liquid Cooling Market Volume Share (%), by Component 2024 & 2032
- Figure 119: Latin America Data Center Liquid Cooling Market Revenue (Million), by Country 2024 & 2032
- Figure 120: Latin America Data Center Liquid Cooling Market Volume (K Unit), by Country 2024 & 2032
- Figure 121: Latin America Data Center Liquid Cooling Market Revenue Share (%), by Country 2024 & 2032
- Figure 122: Latin America Data Center Liquid Cooling Market Volume Share (%), by Country 2024 & 2032
- Figure 123: Middle East and Africa Data Center Liquid Cooling Market Revenue (Million), by Deployment Model 2024 & 2032
- Figure 124: Middle East and Africa Data Center Liquid Cooling Market Volume (K Unit), by Deployment Model 2024 & 2032
- Figure 125: Middle East and Africa Data Center Liquid Cooling Market Revenue Share (%), by Deployment Model 2024 & 2032
- Figure 126: Middle East and Africa Data Center Liquid Cooling Market Volume Share (%), by Deployment Model 2024 & 2032
- Figure 127: Middle East and Africa Data Center Liquid Cooling Market Revenue (Million), by Type 2024 & 2032
- Figure 128: Middle East and Africa Data Center Liquid Cooling Market Volume (K Unit), by Type 2024 & 2032
- Figure 129: Middle East and Africa Data Center Liquid Cooling Market Revenue Share (%), by Type 2024 & 2032
- Figure 130: Middle East and Africa Data Center Liquid Cooling Market Volume Share (%), by Type 2024 & 2032
- Figure 131: Middle East and Africa Data Center Liquid Cooling Market Revenue (Million), by End-User Industry 2024 & 2032
- Figure 132: Middle East and Africa Data Center Liquid Cooling Market Volume (K Unit), by End-User Industry 2024 & 2032
- Figure 133: Middle East and Africa Data Center Liquid Cooling Market Revenue Share (%), by End-User Industry 2024 & 2032
- Figure 134: Middle East and Africa Data Center Liquid Cooling Market Volume Share (%), by End-User Industry 2024 & 2032
- Figure 135: Middle East and Africa Data Center Liquid Cooling Market Revenue (Million), by Component 2024 & 2032
- Figure 136: Middle East and Africa Data Center Liquid Cooling Market Volume (K Unit), by Component 2024 & 2032
- Figure 137: Middle East and Africa Data Center Liquid Cooling Market Revenue Share (%), by Component 2024 & 2032
- Figure 138: Middle East and Africa Data Center Liquid Cooling Market Volume Share (%), by Component 2024 & 2032
- Figure 139: Middle East and Africa Data Center Liquid Cooling Market Revenue (Million), by Country 2024 & 2032
- Figure 140: Middle East and Africa Data Center Liquid Cooling Market Volume (K Unit), by Country 2024 & 2032
- Figure 141: Middle East and Africa Data Center Liquid Cooling Market Revenue Share (%), by Country 2024 & 2032
- Figure 142: Middle East and Africa Data Center Liquid Cooling Market Volume Share (%), by Country 2024 & 2032
List of Tables
- Table 1: Global Data Center Liquid Cooling Market Revenue Million Forecast, by Region 2019 & 2032
- Table 2: Global Data Center Liquid Cooling Market Volume K Unit Forecast, by Region 2019 & 2032
- Table 3: Global Data Center Liquid Cooling Market Revenue Million Forecast, by Deployment Model 2019 & 2032
- Table 4: Global Data Center Liquid Cooling Market Volume K Unit Forecast, by Deployment Model 2019 & 2032
- Table 5: Global Data Center Liquid Cooling Market Revenue Million Forecast, by Type 2019 & 2032
- Table 6: Global Data Center Liquid Cooling Market Volume K Unit Forecast, by Type 2019 & 2032
- Table 7: Global Data Center Liquid Cooling Market Revenue Million Forecast, by End-User Industry 2019 & 2032
- Table 8: Global Data Center Liquid Cooling Market Volume K Unit Forecast, by End-User Industry 2019 & 2032
- Table 9: Global Data Center Liquid Cooling Market Revenue Million Forecast, by Component 2019 & 2032
- Table 10: Global Data Center Liquid Cooling Market Volume K Unit Forecast, by Component 2019 & 2032
- Table 11: Global Data Center Liquid Cooling Market Revenue Million Forecast, by Region 2019 & 2032
- Table 12: Global Data Center Liquid Cooling Market Volume K Unit Forecast, by Region 2019 & 2032
- Table 13: Global Data Center Liquid Cooling Market Revenue Million Forecast, by Country 2019 & 2032
- Table 14: Global Data Center Liquid Cooling Market Volume K Unit Forecast, by Country 2019 & 2032
- Table 15: United States Data Center Liquid Cooling Market Revenue (Million) Forecast, by Application 2019 & 2032
- Table 16: United States Data Center Liquid Cooling Market Volume (K Unit) Forecast, by Application 2019 & 2032
- Table 17: Canada Data Center Liquid Cooling Market Revenue (Million) Forecast, by Application 2019 & 2032
- Table 18: Canada Data Center Liquid Cooling Market Volume (K Unit) Forecast, by Application 2019 & 2032
- Table 19: Mexico Data Center Liquid Cooling Market Revenue (Million) Forecast, by Application 2019 & 2032
- Table 20: Mexico Data Center Liquid Cooling Market Volume (K Unit) Forecast, by Application 2019 & 2032
- Table 21: Global Data Center Liquid Cooling Market Revenue Million Forecast, by Country 2019 & 2032
- Table 22: Global Data Center Liquid Cooling Market Volume K Unit Forecast, by Country 2019 & 2032
- Table 23: Germany Data Center Liquid Cooling Market Revenue (Million) Forecast, by Application 2019 & 2032
- Table 24: Germany Data Center Liquid Cooling Market Volume (K Unit) Forecast, by Application 2019 & 2032
- Table 25: United Kingdom Data Center Liquid Cooling Market Revenue (Million) Forecast, by Application 2019 & 2032
- Table 26: United Kingdom Data Center Liquid Cooling Market Volume (K Unit) Forecast, by Application 2019 & 2032
- Table 27: France Data Center Liquid Cooling Market Revenue (Million) Forecast, by Application 2019 & 2032
- Table 28: France Data Center Liquid Cooling Market Volume (K Unit) Forecast, by Application 2019 & 2032
- Table 29: Spain Data Center Liquid Cooling Market Revenue (Million) Forecast, by Application 2019 & 2032
- Table 30: Spain Data Center Liquid Cooling Market Volume (K Unit) Forecast, by Application 2019 & 2032
- Table 31: Italy Data Center Liquid Cooling Market Revenue (Million) Forecast, by Application 2019 & 2032
- Table 32: Italy Data Center Liquid Cooling Market Volume (K Unit) Forecast, by Application 2019 & 2032
- Table 33: Spain Data Center Liquid Cooling Market Revenue (Million) Forecast, by Application 2019 & 2032
- Table 34: Spain Data Center Liquid Cooling Market Volume (K Unit) Forecast, by Application 2019 & 2032
- Table 35: Belgium Data Center Liquid Cooling Market Revenue (Million) Forecast, by Application 2019 & 2032
- Table 36: Belgium Data Center Liquid Cooling Market Volume (K Unit) Forecast, by Application 2019 & 2032
- Table 37: Netherland Data Center Liquid Cooling Market Revenue (Million) Forecast, by Application 2019 & 2032
- Table 38: Netherland Data Center Liquid Cooling Market Volume (K Unit) Forecast, by Application 2019 & 2032
- Table 39: Nordics Data Center Liquid Cooling Market Revenue (Million) Forecast, by Application 2019 & 2032
- Table 40: Nordics Data Center Liquid Cooling Market Volume (K Unit) Forecast, by Application 2019 & 2032
- Table 41: Rest of Europe Data Center Liquid Cooling Market Revenue (Million) Forecast, by Application 2019 & 2032
- Table 42: Rest of Europe Data Center Liquid Cooling Market Volume (K Unit) Forecast, by Application 2019 & 2032
- Table 43: Global Data Center Liquid Cooling Market Revenue Million Forecast, by Country 2019 & 2032
- Table 44: Global Data Center Liquid Cooling Market Volume K Unit Forecast, by Country 2019 & 2032
- Table 45: China Data Center Liquid Cooling Market Revenue (Million) Forecast, by Application 2019 & 2032
- Table 46: China Data Center Liquid Cooling Market Volume (K Unit) Forecast, by Application 2019 & 2032
- Table 47: Japan Data Center Liquid Cooling Market Revenue (Million) Forecast, by Application 2019 & 2032
- Table 48: Japan Data Center Liquid Cooling Market Volume (K Unit) Forecast, by Application 2019 & 2032
- Table 49: India Data Center Liquid Cooling Market Revenue (Million) Forecast, by Application 2019 & 2032
- Table 50: India Data Center Liquid Cooling Market Volume (K Unit) Forecast, by Application 2019 & 2032
- Table 51: South Korea Data Center Liquid Cooling Market Revenue (Million) Forecast, by Application 2019 & 2032
- Table 52: South Korea Data Center Liquid Cooling Market Volume (K Unit) Forecast, by Application 2019 & 2032
- Table 53: Southeast Asia Data Center Liquid Cooling Market Revenue (Million) Forecast, by Application 2019 & 2032
- Table 54: Southeast Asia Data Center Liquid Cooling Market Volume (K Unit) Forecast, by Application 2019 & 2032
- Table 55: Australia Data Center Liquid Cooling Market Revenue (Million) Forecast, by Application 2019 & 2032
- Table 56: Australia Data Center Liquid Cooling Market Volume (K Unit) Forecast, by Application 2019 & 2032
- Table 57: Indonesia Data Center Liquid Cooling Market Revenue (Million) Forecast, by Application 2019 & 2032
- Table 58: Indonesia Data Center Liquid Cooling Market Volume (K Unit) Forecast, by Application 2019 & 2032
- Table 59: Phillipes Data Center Liquid Cooling Market Revenue (Million) Forecast, by Application 2019 & 2032
- Table 60: Phillipes Data Center Liquid Cooling Market Volume (K Unit) Forecast, by Application 2019 & 2032
- Table 61: Singapore Data Center Liquid Cooling Market Revenue (Million) Forecast, by Application 2019 & 2032
- Table 62: Singapore Data Center Liquid Cooling Market Volume (K Unit) Forecast, by Application 2019 & 2032
- Table 63: Thailandc Data Center Liquid Cooling Market Revenue (Million) Forecast, by Application 2019 & 2032
- Table 64: Thailandc Data Center Liquid Cooling Market Volume (K Unit) Forecast, by Application 2019 & 2032
- Table 65: Rest of Asia Pacific Data Center Liquid Cooling Market Revenue (Million) Forecast, by Application 2019 & 2032
- Table 66: Rest of Asia Pacific Data Center Liquid Cooling Market Volume (K Unit) Forecast, by Application 2019 & 2032
- Table 67: Global Data Center Liquid Cooling Market Revenue Million Forecast, by Country 2019 & 2032
- Table 68: Global Data Center Liquid Cooling Market Volume K Unit Forecast, by Country 2019 & 2032
- Table 69: Brazil Data Center Liquid Cooling Market Revenue (Million) Forecast, by Application 2019 & 2032
- Table 70: Brazil Data Center Liquid Cooling Market Volume (K Unit) Forecast, by Application 2019 & 2032
- Table 71: Argentina Data Center Liquid Cooling Market Revenue (Million) Forecast, by Application 2019 & 2032
- Table 72: Argentina Data Center Liquid Cooling Market Volume (K Unit) Forecast, by Application 2019 & 2032
- Table 73: Peru Data Center Liquid Cooling Market Revenue (Million) Forecast, by Application 2019 & 2032
- Table 74: Peru Data Center Liquid Cooling Market Volume (K Unit) Forecast, by Application 2019 & 2032
- Table 75: Chile Data Center Liquid Cooling Market Revenue (Million) Forecast, by Application 2019 & 2032
- Table 76: Chile Data Center Liquid Cooling Market Volume (K Unit) Forecast, by Application 2019 & 2032
- Table 77: Colombia Data Center Liquid Cooling Market Revenue (Million) Forecast, by Application 2019 & 2032
- Table 78: Colombia Data Center Liquid Cooling Market Volume (K Unit) Forecast, by Application 2019 & 2032
- Table 79: Ecuador Data Center Liquid Cooling Market Revenue (Million) Forecast, by Application 2019 & 2032
- Table 80: Ecuador Data Center Liquid Cooling Market Volume (K Unit) Forecast, by Application 2019 & 2032
- Table 81: Venezuela Data Center Liquid Cooling Market Revenue (Million) Forecast, by Application 2019 & 2032
- Table 82: Venezuela Data Center Liquid Cooling Market Volume (K Unit) Forecast, by Application 2019 & 2032
- Table 83: Rest of South America Data Center Liquid Cooling Market Revenue (Million) Forecast, by Application 2019 & 2032
- Table 84: Rest of South America Data Center Liquid Cooling Market Volume (K Unit) Forecast, by Application 2019 & 2032
- Table 85: Global Data Center Liquid Cooling Market Revenue Million Forecast, by Country 2019 & 2032
- Table 86: Global Data Center Liquid Cooling Market Volume K Unit Forecast, by Country 2019 & 2032
- Table 87: United Arab Emirates Data Center Liquid Cooling Market Revenue (Million) Forecast, by Application 2019 & 2032
- Table 88: United Arab Emirates Data Center Liquid Cooling Market Volume (K Unit) Forecast, by Application 2019 & 2032
- Table 89: Saudi Arabia Data Center Liquid Cooling Market Revenue (Million) Forecast, by Application 2019 & 2032
- Table 90: Saudi Arabia Data Center Liquid Cooling Market Volume (K Unit) Forecast, by Application 2019 & 2032
- Table 91: South Africa Data Center Liquid Cooling Market Revenue (Million) Forecast, by Application 2019 & 2032
- Table 92: South Africa Data Center Liquid Cooling Market Volume (K Unit) Forecast, by Application 2019 & 2032
- Table 93: Rest of Middle East and Africa Data Center Liquid Cooling Market Revenue (Million) Forecast, by Application 2019 & 2032
- Table 94: Rest of Middle East and Africa Data Center Liquid Cooling Market Volume (K Unit) Forecast, by Application 2019 & 2032
- Table 95: Global Data Center Liquid Cooling Market Revenue Million Forecast, by Deployment Model 2019 & 2032
- Table 96: Global Data Center Liquid Cooling Market Volume K Unit Forecast, by Deployment Model 2019 & 2032
- Table 97: Global Data Center Liquid Cooling Market Revenue Million Forecast, by Type 2019 & 2032
- Table 98: Global Data Center Liquid Cooling Market Volume K Unit Forecast, by Type 2019 & 2032
- Table 99: Global Data Center Liquid Cooling Market Revenue Million Forecast, by End-User Industry 2019 & 2032
- Table 100: Global Data Center Liquid Cooling Market Volume K Unit Forecast, by End-User Industry 2019 & 2032
- Table 101: Global Data Center Liquid Cooling Market Revenue Million Forecast, by Component 2019 & 2032
- Table 102: Global Data Center Liquid Cooling Market Volume K Unit Forecast, by Component 2019 & 2032
- Table 103: Global Data Center Liquid Cooling Market Revenue Million Forecast, by Country 2019 & 2032
- Table 104: Global Data Center Liquid Cooling Market Volume K Unit Forecast, by Country 2019 & 2032
- Table 105: Global Data Center Liquid Cooling Market Revenue Million Forecast, by Deployment Model 2019 & 2032
- Table 106: Global Data Center Liquid Cooling Market Volume K Unit Forecast, by Deployment Model 2019 & 2032
- Table 107: Global Data Center Liquid Cooling Market Revenue Million Forecast, by Type 2019 & 2032
- Table 108: Global Data Center Liquid Cooling Market Volume K Unit Forecast, by Type 2019 & 2032
- Table 109: Global Data Center Liquid Cooling Market Revenue Million Forecast, by End-User Industry 2019 & 2032
- Table 110: Global Data Center Liquid Cooling Market Volume K Unit Forecast, by End-User Industry 2019 & 2032
- Table 111: Global Data Center Liquid Cooling Market Revenue Million Forecast, by Component 2019 & 2032
- Table 112: Global Data Center Liquid Cooling Market Volume K Unit Forecast, by Component 2019 & 2032
- Table 113: Global Data Center Liquid Cooling Market Revenue Million Forecast, by Country 2019 & 2032
- Table 114: Global Data Center Liquid Cooling Market Volume K Unit Forecast, by Country 2019 & 2032
- Table 115: Global Data Center Liquid Cooling Market Revenue Million Forecast, by Deployment Model 2019 & 2032
- Table 116: Global Data Center Liquid Cooling Market Volume K Unit Forecast, by Deployment Model 2019 & 2032
- Table 117: Global Data Center Liquid Cooling Market Revenue Million Forecast, by Type 2019 & 2032
- Table 118: Global Data Center Liquid Cooling Market Volume K Unit Forecast, by Type 2019 & 2032
- Table 119: Global Data Center Liquid Cooling Market Revenue Million Forecast, by End-User Industry 2019 & 2032
- Table 120: Global Data Center Liquid Cooling Market Volume K Unit Forecast, by End-User Industry 2019 & 2032
- Table 121: Global Data Center Liquid Cooling Market Revenue Million Forecast, by Component 2019 & 2032
- Table 122: Global Data Center Liquid Cooling Market Volume K Unit Forecast, by Component 2019 & 2032
- Table 123: Global Data Center Liquid Cooling Market Revenue Million Forecast, by Country 2019 & 2032
- Table 124: Global Data Center Liquid Cooling Market Volume K Unit Forecast, by Country 2019 & 2032
- Table 125: Global Data Center Liquid Cooling Market Revenue Million Forecast, by Deployment Model 2019 & 2032
- Table 126: Global Data Center Liquid Cooling Market Volume K Unit Forecast, by Deployment Model 2019 & 2032
- Table 127: Global Data Center Liquid Cooling Market Revenue Million Forecast, by Type 2019 & 2032
- Table 128: Global Data Center Liquid Cooling Market Volume K Unit Forecast, by Type 2019 & 2032
- Table 129: Global Data Center Liquid Cooling Market Revenue Million Forecast, by End-User Industry 2019 & 2032
- Table 130: Global Data Center Liquid Cooling Market Volume K Unit Forecast, by End-User Industry 2019 & 2032
- Table 131: Global Data Center Liquid Cooling Market Revenue Million Forecast, by Component 2019 & 2032
- Table 132: Global Data Center Liquid Cooling Market Volume K Unit Forecast, by Component 2019 & 2032
- Table 133: Global Data Center Liquid Cooling Market Revenue Million Forecast, by Country 2019 & 2032
- Table 134: Global Data Center Liquid Cooling Market Volume K Unit Forecast, by Country 2019 & 2032
- Table 135: Global Data Center Liquid Cooling Market Revenue Million Forecast, by Deployment Model 2019 & 2032
- Table 136: Global Data Center Liquid Cooling Market Volume K Unit Forecast, by Deployment Model 2019 & 2032
- Table 137: Global Data Center Liquid Cooling Market Revenue Million Forecast, by Type 2019 & 2032
- Table 138: Global Data Center Liquid Cooling Market Volume K Unit Forecast, by Type 2019 & 2032
- Table 139: Global Data Center Liquid Cooling Market Revenue Million Forecast, by End-User Industry 2019 & 2032
- Table 140: Global Data Center Liquid Cooling Market Volume K Unit Forecast, by End-User Industry 2019 & 2032
- Table 141: Global Data Center Liquid Cooling Market Revenue Million Forecast, by Component 2019 & 2032
- Table 142: Global Data Center Liquid Cooling Market Volume K Unit Forecast, by Component 2019 & 2032
- Table 143: Global Data Center Liquid Cooling Market Revenue Million Forecast, by Country 2019 & 2032
- Table 144: Global Data Center Liquid Cooling Market Volume K Unit Forecast, by Country 2019 & 2032
- Table 145: Global Data Center Liquid Cooling Market Revenue Million Forecast, by Deployment Model 2019 & 2032
- Table 146: Global Data Center Liquid Cooling Market Volume K Unit Forecast, by Deployment Model 2019 & 2032
- Table 147: Global Data Center Liquid Cooling Market Revenue Million Forecast, by Type 2019 & 2032
- Table 148: Global Data Center Liquid Cooling Market Volume K Unit Forecast, by Type 2019 & 2032
- Table 149: Global Data Center Liquid Cooling Market Revenue Million Forecast, by End-User Industry 2019 & 2032
- Table 150: Global Data Center Liquid Cooling Market Volume K Unit Forecast, by End-User Industry 2019 & 2032
- Table 151: Global Data Center Liquid Cooling Market Revenue Million Forecast, by Component 2019 & 2032
- Table 152: Global Data Center Liquid Cooling Market Volume K Unit Forecast, by Component 2019 & 2032
- Table 153: Global Data Center Liquid Cooling Market Revenue Million Forecast, by Country 2019 & 2032
- Table 154: Global Data Center Liquid Cooling Market Volume K Unit Forecast, by Country 2019 & 2032
Frequently Asked Questions
1. What is the projected Compound Annual Growth Rate (CAGR) of the Data Center Liquid Cooling Market?
The projected CAGR is approximately 23.31%.
2. Which companies are prominent players in the Data Center Liquid Cooling Market?
Key companies in the market include Submer Technologies & Submer Inc, Asperitas, LiquidStack Inc, Chilldyne Inc, Midas Green Technologies, USystems Ltd (Legrand Group), LiquidCool Solutions Inc, Lenovo Group Limited, Fujitsu Ltd, Kaori Heat Treatment Co Ltd, Iceotope Technologies Ltd, Alfa Laval Corporate AB, CoolIT Systems Inc, Engineered Fluids Inc, Asetek Inc A/S, Wakefield Thermal Solutions Inc, 3M Company, Rittal GmbH & Co KG, Solvay S, Schneider Electric, Vertiv Group Corp, Wiwynn Corporation, Mikros Technologies, Green Revolution Cooling Inc.
3. What are the main segments of the Data Center Liquid Cooling Market?
The market segments include Deployment Model, Type, End-User Industry, Component.
4. Can you provide details about the market size?
The market size is estimated to be USD 4.48 Million as of 2022.
5. What are some drivers contributing to market growth?
Development of IT Infrastructure in the Region; Emergence of Green Data Centers.
6. What are the notable trends driving market growth?
Edge Computing to Witness Significant Growth.
7. Are there any restraints impacting market growth?
Costs. Adaptability Requirements. and Power Outages.
8. Can you provide examples of recent developments in the market?
April 2024 - Mitsubishi Electric Corporation announced that its wholly owned subsidiaries Mitsubishi Electric Hydronics & IT Cooling Systems S.p.A. and Mitsubishi Electric Europe B.V. acquired AIRCALO, an air-conditioning company in France. Going forward, Mitsubishi Electric expects to expand and upgrade its hydronic HVAC systems business in the diversifying European market.
9. What pricing options are available for accessing the report?
Pricing options include single-user, multi-user, and enterprise licenses priced at USD 4750, USD 5250, and USD 8750 respectively.
10. Is the market size provided in terms of value or volume?
The market size is provided in terms of value, measured in Million and volume, measured in K Unit.
11. Are there any specific market keywords associated with the report?
Yes, the market keyword associated with the report is "Data Center Liquid Cooling Market," which aids in identifying and referencing the specific market segment covered.
12. How do I determine which pricing option suits my needs best?
The pricing options vary based on user requirements and access needs. Individual users may opt for single-user licenses, while businesses requiring broader access may choose multi-user or enterprise licenses for cost-effective access to the report.
13. Are there any additional resources or data provided in the Data Center Liquid Cooling Market report?
While the report offers comprehensive insights, it's advisable to review the specific contents or supplementary materials provided to ascertain if additional resources or data are available.
14. How can I stay updated on further developments or reports in the Data Center Liquid Cooling Market?
To stay informed about further developments, trends, and reports in the Data Center Liquid Cooling Market, consider subscribing to industry newsletters, following relevant companies and organizations, or regularly checking reputable industry news sources and publications.
Methodology
Step 1 - Identification of Relevant Samples Size from Population Database


Step 2 - Approaches for Defining Global Market Size (Value, Volume* & Price*)

Note*: In applicable scenarios
Step 3 - Data Sources
Primary Research
- Web Analytics
- Survey Reports
- Research Institute
- Latest Research Reports
- Opinion Leaders
Secondary Research
- Annual Reports
- White Paper
- Latest Press Release
- Industry Association
- Paid Database
- Investor Presentations

Step 4 - Data Triangulation
Involves using different sources of information in order to increase the validity of a study
These sources are likely to be stakeholders in a program - participants, other researchers, program staff, other community members, and so on.
Then we put all data in single framework & apply various statistical tools to find out the dynamic on the market.
During the analysis stage, feedback from the stakeholder groups would be compared to determine areas of agreement as well as areas of divergence


