
Key Insights
The Data Center as a Service (DCaaS) market is experiencing robust growth, driven by the increasing adoption of cloud computing, big data analytics, and the Internet of Things (IoT). The market's Compound Annual Growth Rate (CAGR) of 19.80% from 2019-2024 indicates significant expansion, projected to continue into the forecast period (2025-2033). Key drivers include the need for scalable and flexible IT infrastructure, reduced capital expenditure (CAPEX) for businesses, and enhanced security and reliability offered by managed services. The market is segmented by service type (Managed Hosting and Colocation), data center tier (Tier I-IV), and end-user industry (BFSI, Healthcare, Retail, Manufacturing, IT & Telecom, and others). North America currently holds a significant market share due to its advanced technological infrastructure and high adoption of cloud services, but regions like Asia-Pacific are demonstrating rapid growth fueled by increasing digitalization and expanding economies. The competitive landscape is characterized by a mix of established players like Equinix, IBM, and NTT, along with emerging providers, leading to innovation and price competition. The restraints to growth include concerns around data security and privacy, vendor lock-in, and the potential for high ongoing operational expenditure (OPEX). However, advancements in technologies like edge computing and AI are expected to further fuel the market's expansion.
The diverse range of services offered within the DCaaS market caters to a broad spectrum of business needs. The increasing demand for hybrid and multi-cloud strategies is driving the adoption of colocation services, providing businesses with greater control and flexibility. Meanwhile, managed hosting services are gaining traction due to their ease of management and reduced operational complexity. The geographical distribution of the market reveals significant growth potential in developing economies, particularly in Asia-Pacific and South America, as businesses in these regions increasingly embrace digital transformation. The forecast period is expected to witness further consolidation within the market, with larger players acquiring smaller providers to expand their service offerings and geographical reach. Furthermore, the industry is likely to witness ongoing innovation in areas such as sustainable data centers and advanced security solutions to address the growing concerns of environmental impact and cybersecurity.
Data Center as a Service Market: A Comprehensive Report (2019-2033)
This comprehensive report provides an in-depth analysis of the Data Center as a Service (DCaaS) market, offering invaluable insights for businesses seeking to navigate this rapidly evolving landscape. The study period spans from 2019 to 2033, with 2025 serving as the base and estimated year. The report forecasts market trends from 2025 to 2033, utilizing data from the historical period of 2019-2024. The report’s findings are supported by rigorous market research, encompassing detailed segmentation, competitive analysis, and future projections. The total market size in 2025 is estimated at xx Million and is projected to reach xx Million by 2033, exhibiting a CAGR of xx% during the forecast period.
Data Center as a Service Market Structure & Competitive Dynamics
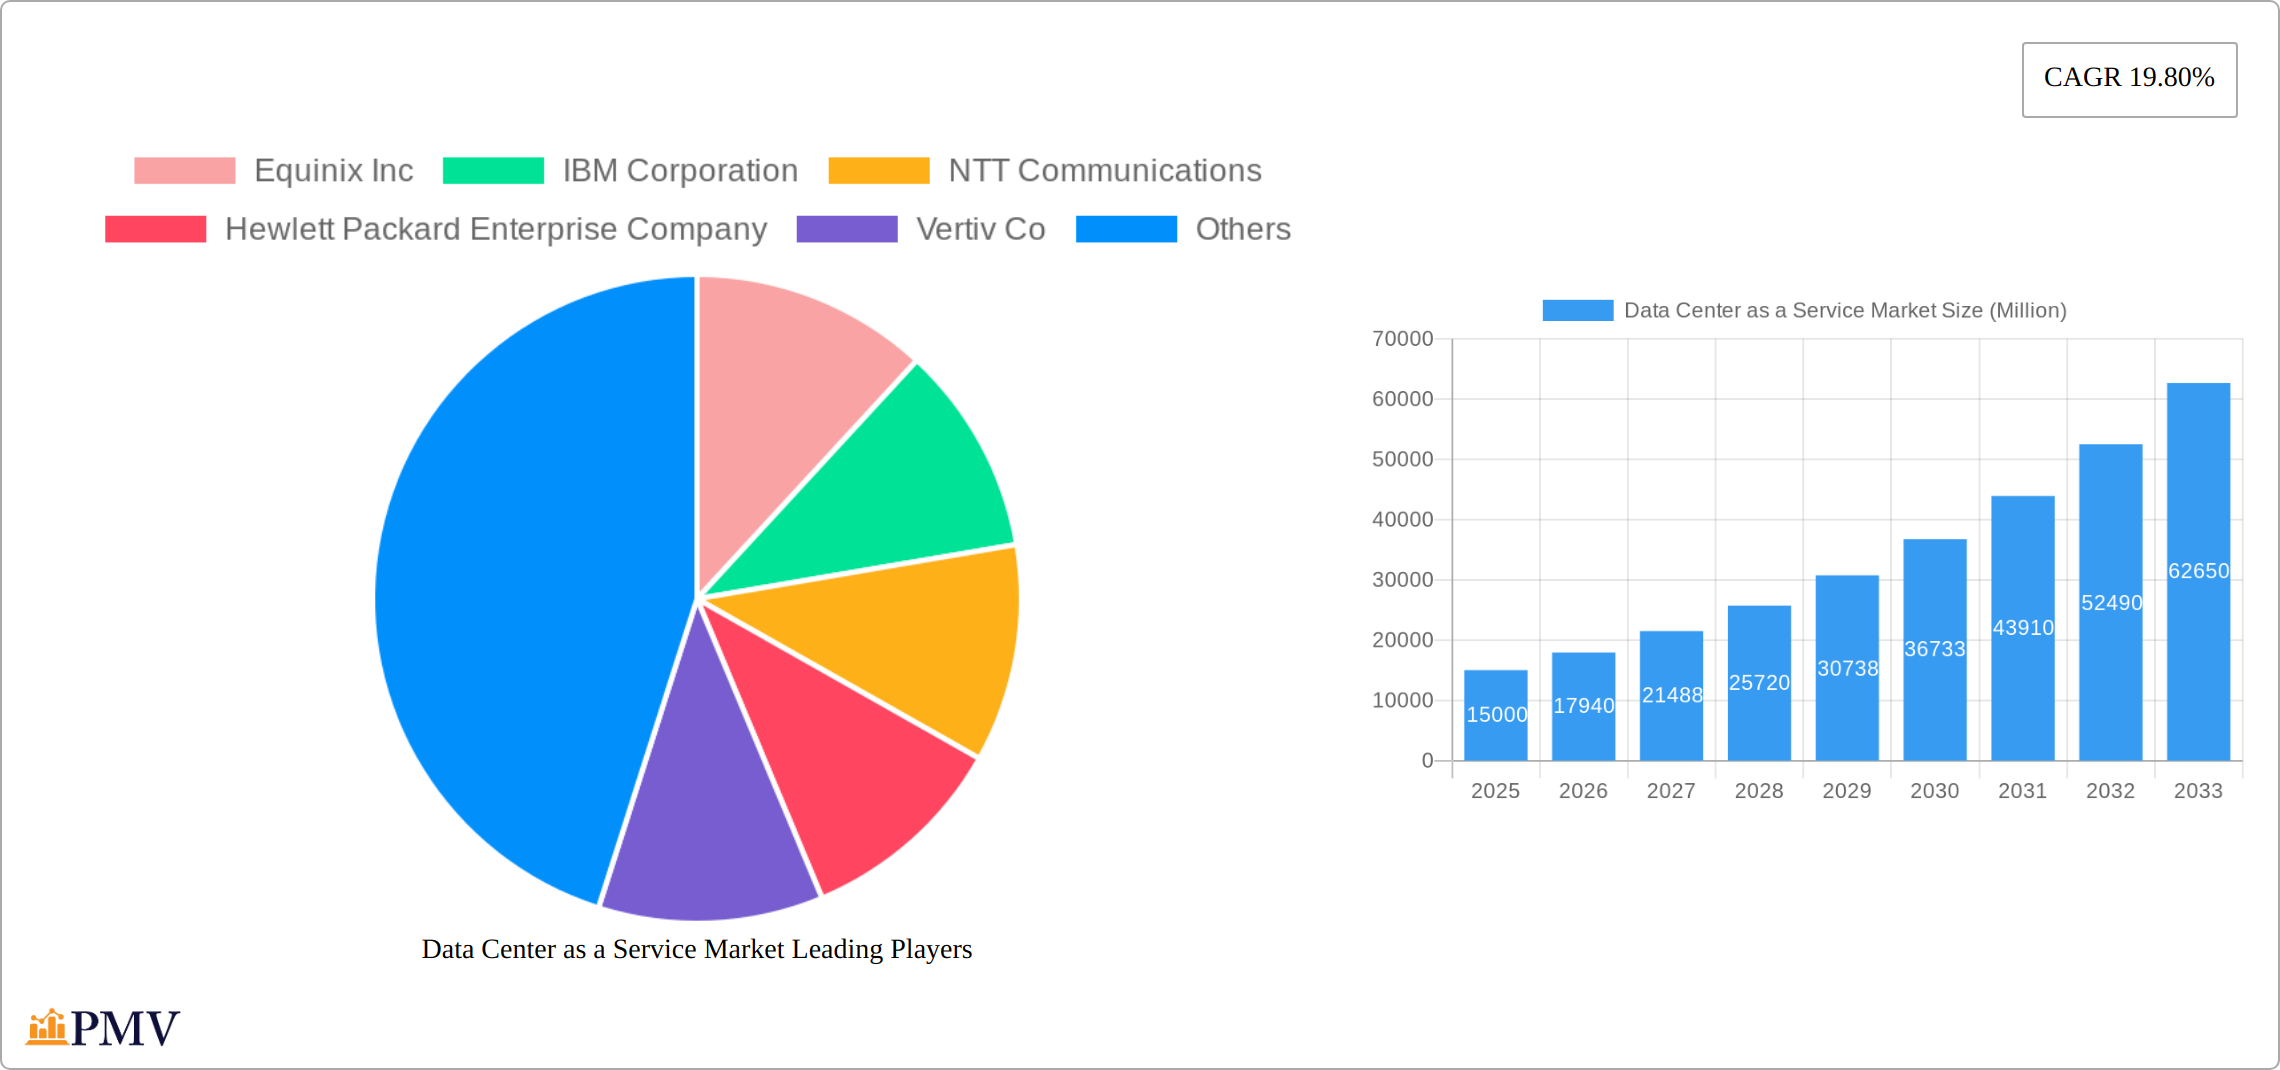
The Data Center as a Service market is characterized by a moderately concentrated landscape with several key players commanding significant market share. Equinix Inc., IBM Corporation, NTT Communications, and Digital Realty Trust Inc. are prominent examples, exhibiting substantial market influence due to their extensive global reach and established infrastructure. However, the market also accommodates several smaller niche players, fostering innovation and competition.
The market's competitive dynamics are shaped by factors such as technological innovation, strategic partnerships (like the Equinix and VMware collaboration), and mergers and acquisitions (M&A) activities. Recent M&A deals, although specific values are unavailable (xx Million), have reshaped the competitive landscape. These activities often involve acquisitions of smaller data center providers by larger players aiming to expand their geographic footprint and service offerings.
- Market Concentration: Moderately concentrated, with a few dominant players.
- Innovation Ecosystems: Active, driven by cloud computing advancements and edge computing deployments.
- Regulatory Frameworks: Varying by region, influencing data sovereignty and compliance requirements.
- Product Substitutes: Limited, with cloud services representing the closest alternative.
- End-User Trends: Increasing demand for scalable, reliable, and cost-effective data center solutions.
- M&A Activities: Frequent, driving consolidation and expansion within the market.
Data Center as a Service Market Industry Trends & Insights
The DCaaS market is experiencing robust growth, fueled by several key factors. The rising adoption of cloud computing, the proliferation of big data analytics, and the expanding Internet of Things (IoT) are major drivers. Enterprises are increasingly outsourcing their IT infrastructure to leverage the scalability, flexibility, and cost efficiency of DCaaS solutions. This trend is particularly pronounced in sectors such as BFSI, healthcare, and IT and Telecom. The market's penetration is growing steadily, with a significant number of enterprises adopting hybrid cloud strategies, which often incorporate DCaaS components. Technological advancements, such as the introduction of Arm's Neoverse V2 chip technology, are further enhancing the performance and efficiency of data centers. However, competitive pressures, including pricing strategies and service differentiation, continue to shape market dynamics. The CAGR for the market is expected to remain strong at xx% throughout the forecast period.
Dominant Markets & Segments in Data Center as a Service Market
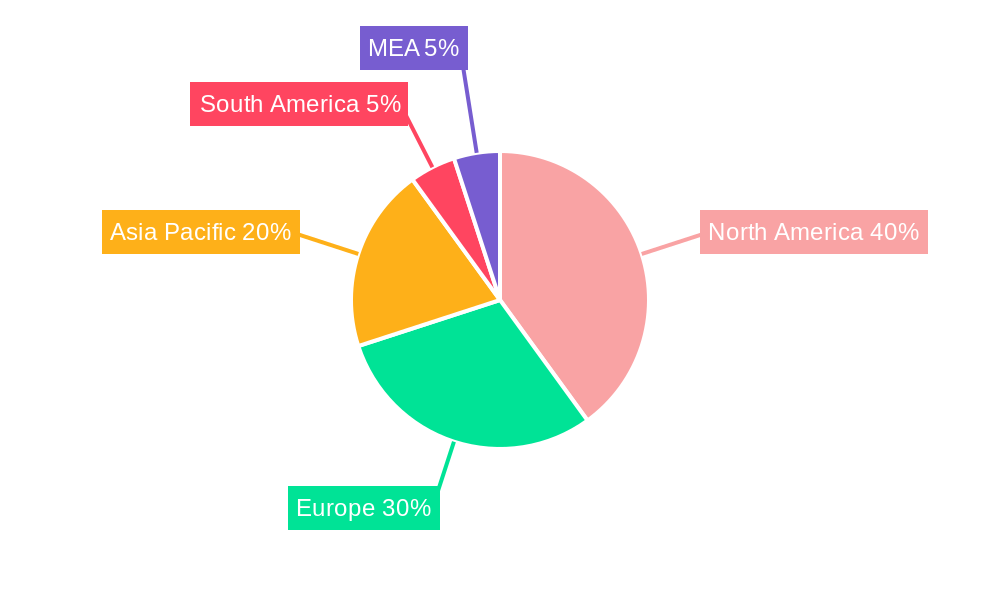
The North American region currently dominates the DCaaS market, driven by a robust technological infrastructure, a large pool of skilled IT professionals, and strong enterprise adoption of cloud technologies. However, Asia-Pacific is experiencing rapid growth due to increasing digitalization and infrastructure investments.
By Type of Service:
- Managed Hosting Service: High demand due to its comprehensive management capabilities.
- Colocation Service: Significant growth fueled by the need for physical proximity to critical infrastructure.
By Data Center Type:
- Tier-III: Largest market share currently due to its balance of cost and reliability.
- Tier-IV: Growing rapidly as organizations prioritize high availability and resilience.
- Tier-I & II: Smaller segments, typically serving niche applications.
By End-user Industry:
- BFSI: Strong adoption driven by regulatory compliance and data security needs.
- IT and Telecom: Highest market penetration due to their inherent reliance on data center infrastructure.
- Healthcare: Increasing adoption as regulations evolve and data volumes grow.
Key Drivers:
- Robust technological infrastructure.
- Favorable government policies promoting digitalization.
- High concentration of IT professionals.
- Strong enterprise adoption of cloud and hybrid cloud solutions.
Data Center as a Service Market Product Innovations
Recent product innovations focus on enhancing security, scalability, and efficiency. Edge data center solutions are gaining traction, addressing the need for low latency processing and data storage closer to end-users. Advancements in virtualization and automation technologies streamline data center management. The integration of AI and machine learning is improving resource optimization and predictive maintenance. These innovations are driving market competitiveness by improving the overall value proposition for customers.
Report Segmentation & Scope
This report segments the DCaaS market across several key dimensions:
By Type of Service: Managed Hosting Service and Colocation Service. Growth projections vary significantly, with managed hosting showing a higher growth rate due to its comprehensive offering. Competitive dynamics are defined by service level agreements (SLAs) and pricing models.
By Data Center Type: Tier-I and -II, Tier-III, and Tier-IV. Market size varies considerably, with Tier-III representing the largest market share. Competitive dynamics are influenced by the level of redundancy and reliability offered.
By End-user Industry: BFSI, Healthcare, Retail, Manufacturing, IT and Telecom, and Other End-user Industries. Growth projections vary based on industry-specific adoption rates. Competitive dynamics are influenced by industry-specific regulatory requirements and data sensitivity.
Key Drivers of Data Center as a Service Market Growth
The DCaaS market's growth is primarily driven by several factors:
- Technological Advancements: The continuous development of cloud computing, virtualization, and automation technologies significantly improves efficiency and scalability.
- Increased Data Volumes: The exponential growth in data generated from various sources fuels the demand for robust data storage and processing capabilities.
- Rising Adoption of Cloud Computing: Organizations increasingly rely on cloud-based solutions, which often incorporate DCaaS services.
- Demand for Scalability and Flexibility: DCaaS provides on-demand capacity, enabling enterprises to adapt to changing business needs efficiently.
Challenges in the Data Center as a Service Market Sector
Several factors pose challenges to the DCaaS market:
- High Initial Investment Costs: Setting up data centers requires significant capital investment.
- Competition: The market is becoming increasingly competitive, requiring service providers to innovate to stay ahead.
- Security Concerns: Data security and privacy remain top priorities, requiring robust security measures.
- Energy Consumption: Data centers consume substantial amounts of energy, raising environmental concerns and operational costs.
Leading Players in the Data Center as a Service Market Market
- Equinix Inc.
- IBM Corporation
- NTT Communications
- Hewlett Packard Enterprise Company
- Vertiv Co
- Cisco Systems Inc
- Fujitsu Limited
- Dell Inc
- Capgemini SE
- Digital Realty Trust Inc
- Singapore Telecommunications Limited(Singtel)
Key Developments in Data Center as a Service Market Sector
- November 2022: Equinix and VMware extended their partnership, launching VMware Cloud on Equinix Metal, enhancing multi-cloud capabilities.
- September 2022: Arm Ltd. announced Neoverse V2, a next-generation data center chip technology addressing the growing data surge from 5G and IoT.
- March 2022: Elea Digital and Vertiv partnered to expand edge data center services in Brazil, boosting market reach and infrastructure in that region.
Strategic Data Center as a Service Market Outlook
The DCaaS market is poised for continued robust growth, driven by the ongoing digital transformation and increasing adoption of cloud-based solutions. Strategic opportunities lie in expanding edge computing capabilities, enhancing security features, and fostering partnerships to broaden service offerings. Focusing on sustainability and energy efficiency will also become increasingly important. The market's future depends on continuous innovation and adaptability to meet evolving customer needs.
Data Center as a Service Market Segmentation
-
1. Type of Service
- 1.1. Managed Hosting Service
- 1.2. Colocation Service
-
2. Data Center Type
- 2.1. Tier-I and -II
- 2.2. Tier-III
- 2.3. Tier-IV
-
3. End-user Industry
- 3.1. BFSI
- 3.2. Healthcare
- 3.3. Retail
- 3.4. Manufacturing
- 3.5. IT and Telecom
- 3.6. Other End-user Industries
Data Center as a Service Market Segmentation By Geography
- 1. North America
- 2. Europe
- 3. Asia Pacific
- 4. Latin America
- 5. Middle East and Africa
Data Center as a Service Market REPORT HIGHLIGHTS
| Aspects | Details |
|---|---|
| Study Period | 2019-2033 |
| Base Year | 2024 |
| Estimated Year | 2025 |
| Forecast Period | 2025-2033 |
| Historical Period | 2019-2024 |
| Growth Rate | CAGR of 19.80% from 2019-2033 |
| Segmentation |
|
Table of Contents
- 1. Introduction
- 1.1. Research Scope
- 1.2. Market Segmentation
- 1.3. Research Methodology
- 1.4. Definitions and Assumptions
- 2. Executive Summary
- 2.1. Introduction
- 3. Market Dynamics
- 3.1. Introduction
- 3.2. Market Drivers
- 3.2.1. Increase in the Expenditure on Data Center Technology; Rising Data Center Complexities Due to Scalability
- 3.3. Market Restrains
- 3.3.1. Security risks associated with application data
- 3.4. Market Trends
- 3.4.1. Cloud and Hosting is Expected to Capture a Major Share in the Data Center Services Market
- 4. Market Factor Analysis
- 4.1. Porters Five Forces
- 4.2. Supply/Value Chain
- 4.3. PESTEL analysis
- 4.4. Market Entropy
- 4.5. Patent/Trademark Analysis
- 5. Global Data Center as a Service Market Analysis, Insights and Forecast, 2019-2031
- 5.1. Market Analysis, Insights and Forecast - by Type of Service
- 5.1.1. Managed Hosting Service
- 5.1.2. Colocation Service
- 5.2. Market Analysis, Insights and Forecast - by Data Center Type
- 5.2.1. Tier-I and -II
- 5.2.2. Tier-III
- 5.2.3. Tier-IV
- 5.3. Market Analysis, Insights and Forecast - by End-user Industry
- 5.3.1. BFSI
- 5.3.2. Healthcare
- 5.3.3. Retail
- 5.3.4. Manufacturing
- 5.3.5. IT and Telecom
- 5.3.6. Other End-user Industries
- 5.4. Market Analysis, Insights and Forecast - by Region
- 5.4.1. North America
- 5.4.2. Europe
- 5.4.3. Asia Pacific
- 5.4.4. Latin America
- 5.4.5. Middle East and Africa
- 5.1. Market Analysis, Insights and Forecast - by Type of Service
- 6. North America Data Center as a Service Market Analysis, Insights and Forecast, 2019-2031
- 6.1. Market Analysis, Insights and Forecast - by Type of Service
- 6.1.1. Managed Hosting Service
- 6.1.2. Colocation Service
- 6.2. Market Analysis, Insights and Forecast - by Data Center Type
- 6.2.1. Tier-I and -II
- 6.2.2. Tier-III
- 6.2.3. Tier-IV
- 6.3. Market Analysis, Insights and Forecast - by End-user Industry
- 6.3.1. BFSI
- 6.3.2. Healthcare
- 6.3.3. Retail
- 6.3.4. Manufacturing
- 6.3.5. IT and Telecom
- 6.3.6. Other End-user Industries
- 6.1. Market Analysis, Insights and Forecast - by Type of Service
- 7. Europe Data Center as a Service Market Analysis, Insights and Forecast, 2019-2031
- 7.1. Market Analysis, Insights and Forecast - by Type of Service
- 7.1.1. Managed Hosting Service
- 7.1.2. Colocation Service
- 7.2. Market Analysis, Insights and Forecast - by Data Center Type
- 7.2.1. Tier-I and -II
- 7.2.2. Tier-III
- 7.2.3. Tier-IV
- 7.3. Market Analysis, Insights and Forecast - by End-user Industry
- 7.3.1. BFSI
- 7.3.2. Healthcare
- 7.3.3. Retail
- 7.3.4. Manufacturing
- 7.3.5. IT and Telecom
- 7.3.6. Other End-user Industries
- 7.1. Market Analysis, Insights and Forecast - by Type of Service
- 8. Asia Pacific Data Center as a Service Market Analysis, Insights and Forecast, 2019-2031
- 8.1. Market Analysis, Insights and Forecast - by Type of Service
- 8.1.1. Managed Hosting Service
- 8.1.2. Colocation Service
- 8.2. Market Analysis, Insights and Forecast - by Data Center Type
- 8.2.1. Tier-I and -II
- 8.2.2. Tier-III
- 8.2.3. Tier-IV
- 8.3. Market Analysis, Insights and Forecast - by End-user Industry
- 8.3.1. BFSI
- 8.3.2. Healthcare
- 8.3.3. Retail
- 8.3.4. Manufacturing
- 8.3.5. IT and Telecom
- 8.3.6. Other End-user Industries
- 8.1. Market Analysis, Insights and Forecast - by Type of Service
- 9. Latin America Data Center as a Service Market Analysis, Insights and Forecast, 2019-2031
- 9.1. Market Analysis, Insights and Forecast - by Type of Service
- 9.1.1. Managed Hosting Service
- 9.1.2. Colocation Service
- 9.2. Market Analysis, Insights and Forecast - by Data Center Type
- 9.2.1. Tier-I and -II
- 9.2.2. Tier-III
- 9.2.3. Tier-IV
- 9.3. Market Analysis, Insights and Forecast - by End-user Industry
- 9.3.1. BFSI
- 9.3.2. Healthcare
- 9.3.3. Retail
- 9.3.4. Manufacturing
- 9.3.5. IT and Telecom
- 9.3.6. Other End-user Industries
- 9.1. Market Analysis, Insights and Forecast - by Type of Service
- 10. Middle East and Africa Data Center as a Service Market Analysis, Insights and Forecast, 2019-2031
- 10.1. Market Analysis, Insights and Forecast - by Type of Service
- 10.1.1. Managed Hosting Service
- 10.1.2. Colocation Service
- 10.2. Market Analysis, Insights and Forecast - by Data Center Type
- 10.2.1. Tier-I and -II
- 10.2.2. Tier-III
- 10.2.3. Tier-IV
- 10.3. Market Analysis, Insights and Forecast - by End-user Industry
- 10.3.1. BFSI
- 10.3.2. Healthcare
- 10.3.3. Retail
- 10.3.4. Manufacturing
- 10.3.5. IT and Telecom
- 10.3.6. Other End-user Industries
- 10.1. Market Analysis, Insights and Forecast - by Type of Service
- 11. North America Data Center as a Service Market Analysis, Insights and Forecast, 2019-2031
- 11.1. Market Analysis, Insights and Forecast - By Country/Sub-region
- 11.1.1 United States
- 11.1.2 Canada
- 11.1.3 Mexico
- 12. Europe Data Center as a Service Market Analysis, Insights and Forecast, 2019-2031
- 12.1. Market Analysis, Insights and Forecast - By Country/Sub-region
- 12.1.1 Germany
- 12.1.2 United Kingdom
- 12.1.3 France
- 12.1.4 Spain
- 12.1.5 Italy
- 12.1.6 Spain
- 12.1.7 Belgium
- 12.1.8 Netherland
- 12.1.9 Nordics
- 12.1.10 Rest of Europe
- 13. Asia Pacific Data Center as a Service Market Analysis, Insights and Forecast, 2019-2031
- 13.1. Market Analysis, Insights and Forecast - By Country/Sub-region
- 13.1.1 China
- 13.1.2 Japan
- 13.1.3 India
- 13.1.4 South Korea
- 13.1.5 Southeast Asia
- 13.1.6 Australia
- 13.1.7 Indonesia
- 13.1.8 Phillipes
- 13.1.9 Singapore
- 13.1.10 Thailandc
- 13.1.11 Rest of Asia Pacific
- 14. South America Data Center as a Service Market Analysis, Insights and Forecast, 2019-2031
- 14.1. Market Analysis, Insights and Forecast - By Country/Sub-region
- 14.1.1 Brazil
- 14.1.2 Argentina
- 14.1.3 Peru
- 14.1.4 Chile
- 14.1.5 Colombia
- 14.1.6 Ecuador
- 14.1.7 Venezuela
- 14.1.8 Rest of South America
- 15. North America Data Center as a Service Market Analysis, Insights and Forecast, 2019-2031
- 15.1. Market Analysis, Insights and Forecast - By Country/Sub-region
- 15.1.1 United States
- 15.1.2 Canada
- 15.1.3 Mexico
- 16. MEA Data Center as a Service Market Analysis, Insights and Forecast, 2019-2031
- 16.1. Market Analysis, Insights and Forecast - By Country/Sub-region
- 16.1.1 United Arab Emirates
- 16.1.2 Saudi Arabia
- 16.1.3 South Africa
- 16.1.4 Rest of Middle East and Africa
- 17. Competitive Analysis
- 17.1. Global Market Share Analysis 2024
- 17.2. Company Profiles
- 17.2.1 Equinix Inc
- 17.2.1.1. Overview
- 17.2.1.2. Products
- 17.2.1.3. SWOT Analysis
- 17.2.1.4. Recent Developments
- 17.2.1.5. Financials (Based on Availability)
- 17.2.2 IBM Corporation
- 17.2.2.1. Overview
- 17.2.2.2. Products
- 17.2.2.3. SWOT Analysis
- 17.2.2.4. Recent Developments
- 17.2.2.5. Financials (Based on Availability)
- 17.2.3 NTT Communications
- 17.2.3.1. Overview
- 17.2.3.2. Products
- 17.2.3.3. SWOT Analysis
- 17.2.3.4. Recent Developments
- 17.2.3.5. Financials (Based on Availability)
- 17.2.4 Hewlett Packard Enterprise Company
- 17.2.4.1. Overview
- 17.2.4.2. Products
- 17.2.4.3. SWOT Analysis
- 17.2.4.4. Recent Developments
- 17.2.4.5. Financials (Based on Availability)
- 17.2.5 Vertiv Co
- 17.2.5.1. Overview
- 17.2.5.2. Products
- 17.2.5.3. SWOT Analysis
- 17.2.5.4. Recent Developments
- 17.2.5.5. Financials (Based on Availability)
- 17.2.6 Cisco Systems Inc
- 17.2.6.1. Overview
- 17.2.6.2. Products
- 17.2.6.3. SWOT Analysis
- 17.2.6.4. Recent Developments
- 17.2.6.5. Financials (Based on Availability)
- 17.2.7 Fujitsu Limited
- 17.2.7.1. Overview
- 17.2.7.2. Products
- 17.2.7.3. SWOT Analysis
- 17.2.7.4. Recent Developments
- 17.2.7.5. Financials (Based on Availability)
- 17.2.8 Dell Inc
- 17.2.8.1. Overview
- 17.2.8.2. Products
- 17.2.8.3. SWOT Analysis
- 17.2.8.4. Recent Developments
- 17.2.8.5. Financials (Based on Availability)
- 17.2.9 Capgemini SE
- 17.2.9.1. Overview
- 17.2.9.2. Products
- 17.2.9.3. SWOT Analysis
- 17.2.9.4. Recent Developments
- 17.2.9.5. Financials (Based on Availability)
- 17.2.10 Digital Realty Trust Inc
- 17.2.10.1. Overview
- 17.2.10.2. Products
- 17.2.10.3. SWOT Analysis
- 17.2.10.4. Recent Developments
- 17.2.10.5. Financials (Based on Availability)
- 17.2.11 Singapore Telecommunications Limited(Singtel)
- 17.2.11.1. Overview
- 17.2.11.2. Products
- 17.2.11.3. SWOT Analysis
- 17.2.11.4. Recent Developments
- 17.2.11.5. Financials (Based on Availability)
- 17.2.1 Equinix Inc
List of Figures
- Figure 1: Global Data Center as a Service Market Revenue Breakdown (Million, %) by Region 2024 & 2032
- Figure 2: North America Data Center as a Service Market Revenue (Million), by Country 2024 & 2032
- Figure 3: North America Data Center as a Service Market Revenue Share (%), by Country 2024 & 2032
- Figure 4: Europe Data Center as a Service Market Revenue (Million), by Country 2024 & 2032
- Figure 5: Europe Data Center as a Service Market Revenue Share (%), by Country 2024 & 2032
- Figure 6: Asia Pacific Data Center as a Service Market Revenue (Million), by Country 2024 & 2032
- Figure 7: Asia Pacific Data Center as a Service Market Revenue Share (%), by Country 2024 & 2032
- Figure 8: South America Data Center as a Service Market Revenue (Million), by Country 2024 & 2032
- Figure 9: South America Data Center as a Service Market Revenue Share (%), by Country 2024 & 2032
- Figure 10: North America Data Center as a Service Market Revenue (Million), by Country 2024 & 2032
- Figure 11: North America Data Center as a Service Market Revenue Share (%), by Country 2024 & 2032
- Figure 12: MEA Data Center as a Service Market Revenue (Million), by Country 2024 & 2032
- Figure 13: MEA Data Center as a Service Market Revenue Share (%), by Country 2024 & 2032
- Figure 14: North America Data Center as a Service Market Revenue (Million), by Type of Service 2024 & 2032
- Figure 15: North America Data Center as a Service Market Revenue Share (%), by Type of Service 2024 & 2032
- Figure 16: North America Data Center as a Service Market Revenue (Million), by Data Center Type 2024 & 2032
- Figure 17: North America Data Center as a Service Market Revenue Share (%), by Data Center Type 2024 & 2032
- Figure 18: North America Data Center as a Service Market Revenue (Million), by End-user Industry 2024 & 2032
- Figure 19: North America Data Center as a Service Market Revenue Share (%), by End-user Industry 2024 & 2032
- Figure 20: North America Data Center as a Service Market Revenue (Million), by Country 2024 & 2032
- Figure 21: North America Data Center as a Service Market Revenue Share (%), by Country 2024 & 2032
- Figure 22: Europe Data Center as a Service Market Revenue (Million), by Type of Service 2024 & 2032
- Figure 23: Europe Data Center as a Service Market Revenue Share (%), by Type of Service 2024 & 2032
- Figure 24: Europe Data Center as a Service Market Revenue (Million), by Data Center Type 2024 & 2032
- Figure 25: Europe Data Center as a Service Market Revenue Share (%), by Data Center Type 2024 & 2032
- Figure 26: Europe Data Center as a Service Market Revenue (Million), by End-user Industry 2024 & 2032
- Figure 27: Europe Data Center as a Service Market Revenue Share (%), by End-user Industry 2024 & 2032
- Figure 28: Europe Data Center as a Service Market Revenue (Million), by Country 2024 & 2032
- Figure 29: Europe Data Center as a Service Market Revenue Share (%), by Country 2024 & 2032
- Figure 30: Asia Pacific Data Center as a Service Market Revenue (Million), by Type of Service 2024 & 2032
- Figure 31: Asia Pacific Data Center as a Service Market Revenue Share (%), by Type of Service 2024 & 2032
- Figure 32: Asia Pacific Data Center as a Service Market Revenue (Million), by Data Center Type 2024 & 2032
- Figure 33: Asia Pacific Data Center as a Service Market Revenue Share (%), by Data Center Type 2024 & 2032
- Figure 34: Asia Pacific Data Center as a Service Market Revenue (Million), by End-user Industry 2024 & 2032
- Figure 35: Asia Pacific Data Center as a Service Market Revenue Share (%), by End-user Industry 2024 & 2032
- Figure 36: Asia Pacific Data Center as a Service Market Revenue (Million), by Country 2024 & 2032
- Figure 37: Asia Pacific Data Center as a Service Market Revenue Share (%), by Country 2024 & 2032
- Figure 38: Latin America Data Center as a Service Market Revenue (Million), by Type of Service 2024 & 2032
- Figure 39: Latin America Data Center as a Service Market Revenue Share (%), by Type of Service 2024 & 2032
- Figure 40: Latin America Data Center as a Service Market Revenue (Million), by Data Center Type 2024 & 2032
- Figure 41: Latin America Data Center as a Service Market Revenue Share (%), by Data Center Type 2024 & 2032
- Figure 42: Latin America Data Center as a Service Market Revenue (Million), by End-user Industry 2024 & 2032
- Figure 43: Latin America Data Center as a Service Market Revenue Share (%), by End-user Industry 2024 & 2032
- Figure 44: Latin America Data Center as a Service Market Revenue (Million), by Country 2024 & 2032
- Figure 45: Latin America Data Center as a Service Market Revenue Share (%), by Country 2024 & 2032
- Figure 46: Middle East and Africa Data Center as a Service Market Revenue (Million), by Type of Service 2024 & 2032
- Figure 47: Middle East and Africa Data Center as a Service Market Revenue Share (%), by Type of Service 2024 & 2032
- Figure 48: Middle East and Africa Data Center as a Service Market Revenue (Million), by Data Center Type 2024 & 2032
- Figure 49: Middle East and Africa Data Center as a Service Market Revenue Share (%), by Data Center Type 2024 & 2032
- Figure 50: Middle East and Africa Data Center as a Service Market Revenue (Million), by End-user Industry 2024 & 2032
- Figure 51: Middle East and Africa Data Center as a Service Market Revenue Share (%), by End-user Industry 2024 & 2032
- Figure 52: Middle East and Africa Data Center as a Service Market Revenue (Million), by Country 2024 & 2032
- Figure 53: Middle East and Africa Data Center as a Service Market Revenue Share (%), by Country 2024 & 2032
List of Tables
- Table 1: Global Data Center as a Service Market Revenue Million Forecast, by Region 2019 & 2032
- Table 2: Global Data Center as a Service Market Revenue Million Forecast, by Type of Service 2019 & 2032
- Table 3: Global Data Center as a Service Market Revenue Million Forecast, by Data Center Type 2019 & 2032
- Table 4: Global Data Center as a Service Market Revenue Million Forecast, by End-user Industry 2019 & 2032
- Table 5: Global Data Center as a Service Market Revenue Million Forecast, by Region 2019 & 2032
- Table 6: Global Data Center as a Service Market Revenue Million Forecast, by Country 2019 & 2032
- Table 7: United States Data Center as a Service Market Revenue (Million) Forecast, by Application 2019 & 2032
- Table 8: Canada Data Center as a Service Market Revenue (Million) Forecast, by Application 2019 & 2032
- Table 9: Mexico Data Center as a Service Market Revenue (Million) Forecast, by Application 2019 & 2032
- Table 10: Global Data Center as a Service Market Revenue Million Forecast, by Country 2019 & 2032
- Table 11: Germany Data Center as a Service Market Revenue (Million) Forecast, by Application 2019 & 2032
- Table 12: United Kingdom Data Center as a Service Market Revenue (Million) Forecast, by Application 2019 & 2032
- Table 13: France Data Center as a Service Market Revenue (Million) Forecast, by Application 2019 & 2032
- Table 14: Spain Data Center as a Service Market Revenue (Million) Forecast, by Application 2019 & 2032
- Table 15: Italy Data Center as a Service Market Revenue (Million) Forecast, by Application 2019 & 2032
- Table 16: Spain Data Center as a Service Market Revenue (Million) Forecast, by Application 2019 & 2032
- Table 17: Belgium Data Center as a Service Market Revenue (Million) Forecast, by Application 2019 & 2032
- Table 18: Netherland Data Center as a Service Market Revenue (Million) Forecast, by Application 2019 & 2032
- Table 19: Nordics Data Center as a Service Market Revenue (Million) Forecast, by Application 2019 & 2032
- Table 20: Rest of Europe Data Center as a Service Market Revenue (Million) Forecast, by Application 2019 & 2032
- Table 21: Global Data Center as a Service Market Revenue Million Forecast, by Country 2019 & 2032
- Table 22: China Data Center as a Service Market Revenue (Million) Forecast, by Application 2019 & 2032
- Table 23: Japan Data Center as a Service Market Revenue (Million) Forecast, by Application 2019 & 2032
- Table 24: India Data Center as a Service Market Revenue (Million) Forecast, by Application 2019 & 2032
- Table 25: South Korea Data Center as a Service Market Revenue (Million) Forecast, by Application 2019 & 2032
- Table 26: Southeast Asia Data Center as a Service Market Revenue (Million) Forecast, by Application 2019 & 2032
- Table 27: Australia Data Center as a Service Market Revenue (Million) Forecast, by Application 2019 & 2032
- Table 28: Indonesia Data Center as a Service Market Revenue (Million) Forecast, by Application 2019 & 2032
- Table 29: Phillipes Data Center as a Service Market Revenue (Million) Forecast, by Application 2019 & 2032
- Table 30: Singapore Data Center as a Service Market Revenue (Million) Forecast, by Application 2019 & 2032
- Table 31: Thailandc Data Center as a Service Market Revenue (Million) Forecast, by Application 2019 & 2032
- Table 32: Rest of Asia Pacific Data Center as a Service Market Revenue (Million) Forecast, by Application 2019 & 2032
- Table 33: Global Data Center as a Service Market Revenue Million Forecast, by Country 2019 & 2032
- Table 34: Brazil Data Center as a Service Market Revenue (Million) Forecast, by Application 2019 & 2032
- Table 35: Argentina Data Center as a Service Market Revenue (Million) Forecast, by Application 2019 & 2032
- Table 36: Peru Data Center as a Service Market Revenue (Million) Forecast, by Application 2019 & 2032
- Table 37: Chile Data Center as a Service Market Revenue (Million) Forecast, by Application 2019 & 2032
- Table 38: Colombia Data Center as a Service Market Revenue (Million) Forecast, by Application 2019 & 2032
- Table 39: Ecuador Data Center as a Service Market Revenue (Million) Forecast, by Application 2019 & 2032
- Table 40: Venezuela Data Center as a Service Market Revenue (Million) Forecast, by Application 2019 & 2032
- Table 41: Rest of South America Data Center as a Service Market Revenue (Million) Forecast, by Application 2019 & 2032
- Table 42: Global Data Center as a Service Market Revenue Million Forecast, by Country 2019 & 2032
- Table 43: United States Data Center as a Service Market Revenue (Million) Forecast, by Application 2019 & 2032
- Table 44: Canada Data Center as a Service Market Revenue (Million) Forecast, by Application 2019 & 2032
- Table 45: Mexico Data Center as a Service Market Revenue (Million) Forecast, by Application 2019 & 2032
- Table 46: Global Data Center as a Service Market Revenue Million Forecast, by Country 2019 & 2032
- Table 47: United Arab Emirates Data Center as a Service Market Revenue (Million) Forecast, by Application 2019 & 2032
- Table 48: Saudi Arabia Data Center as a Service Market Revenue (Million) Forecast, by Application 2019 & 2032
- Table 49: South Africa Data Center as a Service Market Revenue (Million) Forecast, by Application 2019 & 2032
- Table 50: Rest of Middle East and Africa Data Center as a Service Market Revenue (Million) Forecast, by Application 2019 & 2032
- Table 51: Global Data Center as a Service Market Revenue Million Forecast, by Type of Service 2019 & 2032
- Table 52: Global Data Center as a Service Market Revenue Million Forecast, by Data Center Type 2019 & 2032
- Table 53: Global Data Center as a Service Market Revenue Million Forecast, by End-user Industry 2019 & 2032
- Table 54: Global Data Center as a Service Market Revenue Million Forecast, by Country 2019 & 2032
- Table 55: Global Data Center as a Service Market Revenue Million Forecast, by Type of Service 2019 & 2032
- Table 56: Global Data Center as a Service Market Revenue Million Forecast, by Data Center Type 2019 & 2032
- Table 57: Global Data Center as a Service Market Revenue Million Forecast, by End-user Industry 2019 & 2032
- Table 58: Global Data Center as a Service Market Revenue Million Forecast, by Country 2019 & 2032
- Table 59: Global Data Center as a Service Market Revenue Million Forecast, by Type of Service 2019 & 2032
- Table 60: Global Data Center as a Service Market Revenue Million Forecast, by Data Center Type 2019 & 2032
- Table 61: Global Data Center as a Service Market Revenue Million Forecast, by End-user Industry 2019 & 2032
- Table 62: Global Data Center as a Service Market Revenue Million Forecast, by Country 2019 & 2032
- Table 63: Global Data Center as a Service Market Revenue Million Forecast, by Type of Service 2019 & 2032
- Table 64: Global Data Center as a Service Market Revenue Million Forecast, by Data Center Type 2019 & 2032
- Table 65: Global Data Center as a Service Market Revenue Million Forecast, by End-user Industry 2019 & 2032
- Table 66: Global Data Center as a Service Market Revenue Million Forecast, by Country 2019 & 2032
- Table 67: Global Data Center as a Service Market Revenue Million Forecast, by Type of Service 2019 & 2032
- Table 68: Global Data Center as a Service Market Revenue Million Forecast, by Data Center Type 2019 & 2032
- Table 69: Global Data Center as a Service Market Revenue Million Forecast, by End-user Industry 2019 & 2032
- Table 70: Global Data Center as a Service Market Revenue Million Forecast, by Country 2019 & 2032
Frequently Asked Questions
1. What is the projected Compound Annual Growth Rate (CAGR) of the Data Center as a Service Market?
The projected CAGR is approximately 19.80%.
2. Which companies are prominent players in the Data Center as a Service Market?
Key companies in the market include Equinix Inc, IBM Corporation, NTT Communications, Hewlett Packard Enterprise Company, Vertiv Co, Cisco Systems Inc, Fujitsu Limited, Dell Inc, Capgemini SE, Digital Realty Trust Inc, Singapore Telecommunications Limited(Singtel).
3. What are the main segments of the Data Center as a Service Market?
The market segments include Type of Service, Data Center Type, End-user Industry.
4. Can you provide details about the market size?
The market size is estimated to be USD XX Million as of 2022.
5. What are some drivers contributing to market growth?
Increase in the Expenditure on Data Center Technology; Rising Data Center Complexities Due to Scalability.
6. What are the notable trends driving market growth?
Cloud and Hosting is Expected to Capture a Major Share in the Data Center Services Market.
7. Are there any restraints impacting market growth?
Security risks associated with application data.
8. Can you provide examples of recent developments in the market?
November 2022: Equinix, Inc., a global provider of digital infrastructure, and VMware, Inc. announced an extended global partnership to provide innovative digital infrastructure and multi-cloud services. The companies collaborated to launch VMware Cloud on Equinix Metal, a new distributed cloud service providing a more performant, secure, and cost-effective cloud solution for enterprise applications.
9. What pricing options are available for accessing the report?
Pricing options include single-user, multi-user, and enterprise licenses priced at USD 4750, USD 5250, and USD 8750 respectively.
10. Is the market size provided in terms of value or volume?
The market size is provided in terms of value, measured in Million.
11. Are there any specific market keywords associated with the report?
Yes, the market keyword associated with the report is "Data Center as a Service Market," which aids in identifying and referencing the specific market segment covered.
12. How do I determine which pricing option suits my needs best?
The pricing options vary based on user requirements and access needs. Individual users may opt for single-user licenses, while businesses requiring broader access may choose multi-user or enterprise licenses for cost-effective access to the report.
13. Are there any additional resources or data provided in the Data Center as a Service Market report?
While the report offers comprehensive insights, it's advisable to review the specific contents or supplementary materials provided to ascertain if additional resources or data are available.
14. How can I stay updated on further developments or reports in the Data Center as a Service Market?
To stay informed about further developments, trends, and reports in the Data Center as a Service Market, consider subscribing to industry newsletters, following relevant companies and organizations, or regularly checking reputable industry news sources and publications.
Methodology
Step 1 - Identification of Relevant Samples Size from Population Database


Step 2 - Approaches for Defining Global Market Size (Value, Volume* & Price*)

Note*: In applicable scenarios
Step 3 - Data Sources
Primary Research
- Web Analytics
- Survey Reports
- Research Institute
- Latest Research Reports
- Opinion Leaders
Secondary Research
- Annual Reports
- White Paper
- Latest Press Release
- Industry Association
- Paid Database
- Investor Presentations

Step 4 - Data Triangulation
Involves using different sources of information in order to increase the validity of a study
These sources are likely to be stakeholders in a program - participants, other researchers, program staff, other community members, and so on.
Then we put all data in single framework & apply various statistical tools to find out the dynamic on the market.
During the analysis stage, feedback from the stakeholder groups would be compared to determine areas of agreement as well as areas of divergence


