
Key Insights
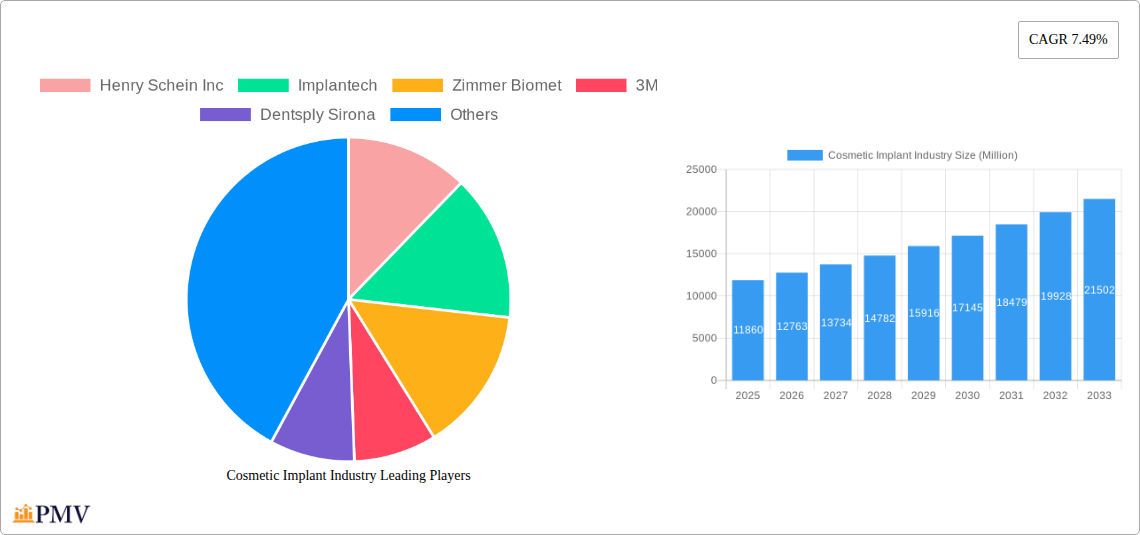
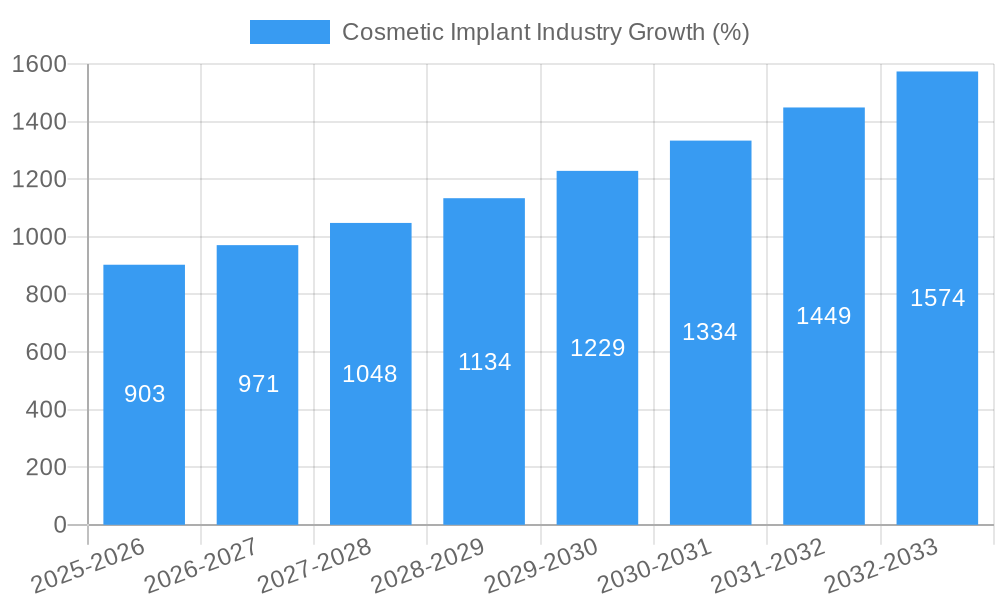
The global cosmetic implant market, valued at $11.86 billion in 2025, is projected to experience robust growth, driven by a Compound Annual Growth Rate (CAGR) of 7.49% from 2025 to 2033. This expansion is fueled by several key factors. Rising disposable incomes, particularly in emerging economies, are increasing the affordability of cosmetic procedures. A parallel rise in body image consciousness and the desire for aesthetic enhancement are major drivers. Technological advancements, including the development of biocompatible and minimally invasive implant materials, contribute to increased patient demand and surgeon adoption. The market is segmented by application (dental, breast, facial, and others) and raw material (polymer, ceramic, metal, and biological materials). Dental implants currently dominate the application segment, reflecting a high prevalence of dental issues and a growing preference for restorative procedures. However, the breast and facial implant segments are expected to show significant growth due to rising demand for augmentation and reconstructive surgeries. The polymer implant segment, offering a balance between cost-effectiveness and biocompatibility, holds a substantial market share within the raw material category.
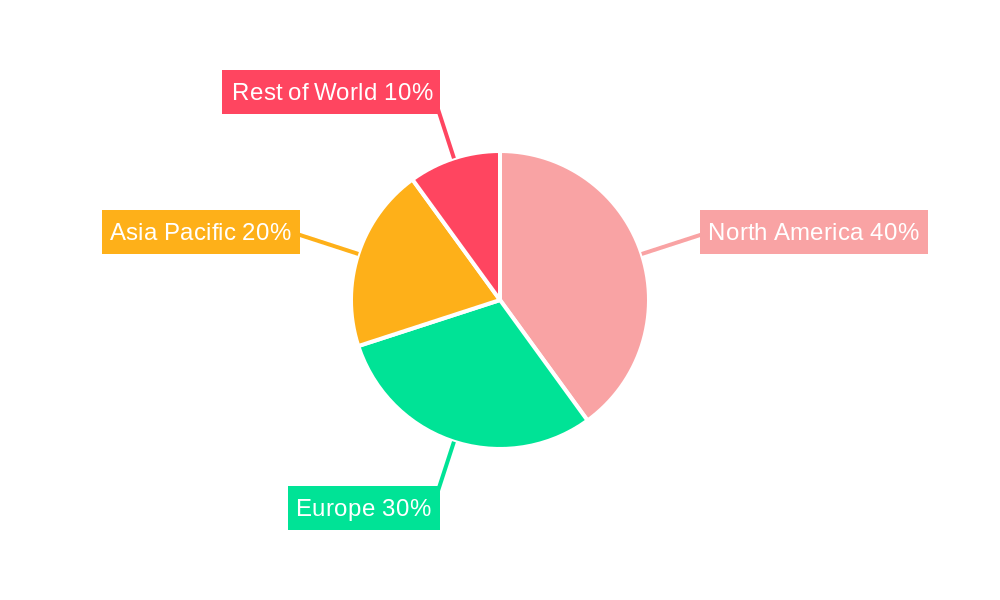
Geographic distribution reveals a significant concentration of the market in North America and Europe, reflecting established healthcare infrastructure and high consumer spending power. However, rapidly developing economies in Asia-Pacific, particularly China and India, are poised to drive substantial market expansion over the forecast period. This growth will be facilitated by improving healthcare access, increasing urbanization, and a burgeoning middle class with heightened disposable incomes and awareness of cosmetic procedures. While regulatory hurdles and potential risks associated with certain implant types remain as constraints, ongoing research and development efforts focused on safety and efficacy are expected to mitigate these challenges. The presence of established players like Johnson & Johnson, Zimmer Biomet, and Allergan alongside emerging companies, indicates a competitive yet dynamic market landscape characterized by innovation and expansion.
Cosmetic Implant Industry Market Report: 2019-2033
This comprehensive report provides a detailed analysis of the global cosmetic implant industry, encompassing market size, growth drivers, competitive landscape, and future outlook. The study period covers 2019-2033, with 2025 as the base and estimated year. The report offers actionable insights for stakeholders across the value chain, including manufacturers, distributors, and investors. The market is projected to reach xx Million by 2033, exhibiting a CAGR of xx% during the forecast period (2025-2033).
Cosmetic Implant Industry Market Structure & Competitive Dynamics
The cosmetic implant market is characterized by a moderately concentrated structure with several major players holding significant market share. Key players like Henry Schein Inc, Zimmer Biomet, 3M, Dentsply Sirona, and Johnson & Johnson dominate the market, driving innovation and shaping competitive dynamics. The market share of these companies collectively accounts for approximately xx Million. However, the presence of several smaller, specialized players fosters innovation, especially in niche areas like bio-printed implants.
Regulatory frameworks vary significantly across geographies, influencing market access and product approvals. Stringent regulations in certain regions, such as the FDA in the US, necessitate rigorous testing and compliance, impacting the time-to-market for new products. The industry is also witnessing increased M&A activity, with deal values reaching xx Million in recent years, as larger companies seek to consolidate their market positions and expand their product portfolios. This consolidation trend is expected to further intensify during the forecast period. Product substitutes, like non-surgical cosmetic procedures, also pose a competitive threat, though the demand for cosmetic implants remains strong, particularly in regions with high disposable incomes. End-user trends show a growing preference for minimally invasive procedures and longer-lasting implants, driving technological advancements.
Cosmetic Implant Industry Industry Trends & Insights
The cosmetic implant market is experiencing robust growth, driven by factors such as rising disposable incomes, increasing awareness of cosmetic procedures, and advancements in implant technology. The market is projected to witness significant growth, reaching xx Million by 2033, with a CAGR of xx%. Technological disruptions, particularly in 3D printing and biocompatible materials, are revolutionizing implant design and manufacturing, leading to enhanced safety and efficacy. Consumer preferences are shifting toward natural-looking results and minimally invasive procedures, pushing manufacturers to innovate and develop implants that meet these demands. The market penetration rate for dental implants is estimated at xx%, while breast implants are at approximately xx%, reflecting the high demand and acceptance of these procedures. However, the market faces challenges such as high procedure costs, potential risks and complications, and regulatory scrutiny. Competitive dynamics are intensifying with new entrants and technological innovations, necessitating continuous product development and strategic partnerships for market leadership.
Dominant Markets & Segments in Cosmetic Implant Industry
Leading Regions/Countries: North America currently holds the largest market share in the cosmetic implant industry, driven by high demand for cosmetic procedures, advanced healthcare infrastructure, and high disposable incomes. Europe and Asia-Pacific are also experiencing significant growth, fueled by rising awareness and increasing affordability of cosmetic treatments.
Dominant Application Segments: Dental implants currently hold the largest market share among all applications, followed by breast implants and facial implants. The high prevalence of tooth loss and the increasing demand for aesthetic enhancements drive this dominance. The "Others" segment, which encompasses various niche applications like orthopedic and maxillofacial implants, is also experiencing steady growth.
Dominant Raw Material Segments: Polymer implants currently dominate the raw material segment due to their biocompatibility, flexibility, and cost-effectiveness. Ceramic and metal implants, while holding significant market share, are facing increasing competition from newer materials like biological material implants which offer superior biointegration and reduced risk of complications. Growth drivers for each segment include:
- Economic policies: Government initiatives supporting healthcare infrastructure and insurance coverage significantly impact market growth.
- Infrastructure: Availability of advanced medical facilities and skilled professionals influences the adoption rate of cosmetic implant procedures.
Cosmetic Implant Industry Product Innovations
Recent innovations focus on biocompatible and bioresorbable materials, minimally invasive surgical techniques, and personalized implant design. 3D-printed implants are gaining traction, allowing for customized designs that optimize fit and functionality. The development of new materials, such as regenerative biomaterials, promises to further enhance implant integration and minimize the risk of complications. These advancements cater to the growing demand for safer, more effective, and aesthetically pleasing cosmetic implants.
Report Segmentation & Scope
This report segments the cosmetic implant market by application (Dental implants, Breast implants, Facial implants, Others) and by raw material (Polymer implants, Ceramic implants, Metal implants, Biological material implants). Each segment's growth projections are detailed, along with market sizes and competitive analyses. For example, the dental implant segment shows strong growth driven by technological advancements and an aging population. The breast implant market displays a steady rise, influenced by factors such as improved safety profiles and enhanced cosmetic outcomes. Facial implant growth is attributed to rising demand for facial rejuvenation procedures. The "Other" segment reflects the diverse nature of the industry, showcasing niche market expansion. Similarly, each raw material segment displays varying growth trajectories based on material properties, cost-effectiveness, and clinical outcomes.
Key Drivers of Cosmetic Implant Industry Growth
Technological advancements, including the development of biocompatible materials and minimally invasive surgical techniques, are major drivers. Rising disposable incomes and increasing health awareness among the population contribute significantly to the growth. Government regulations and insurance coverage also influence market expansion, along with increasing demand for aesthetic enhancement, particularly among the aging population.
Challenges in the Cosmetic Implant Industry Sector
Stringent regulatory requirements increase development costs and time-to-market. Supply chain disruptions and material sourcing challenges influence production and pricing. High procedure costs and potential risks and complications associated with implants may limit market penetration in price-sensitive regions. Intense competition, including from alternative treatments and new entrants, also poses challenges for existing players. The market faces a xx Million loss annually due to supply chain issues.
Leading Players in the Cosmetic Implant Industry Market
- Henry Schein Inc
- Implantech
- Zimmer Biomet
- 3M
- Dentsply Sirona
- Sientra Inc
- Cochlear Ltd
- Johnson & Johnson
- Allergan
- GC Aesthetics
Key Developments in Cosmetic Implant Industry Sector
May 2022: Launch of mini dental implants in New Zealand, offering faster and less invasive tooth replacement solutions. This innovation is expected to boost market growth within the dental implant segment by xx Million in the next five years.
June 2022: Coll Plant initiates a study on 3D bio-printed regenerative breast implants, potentially revolutionizing breast reconstruction procedures. This development could lead to a xx Million increase in the breast implant market by 2030.
Strategic Cosmetic Implant Industry Market Outlook
The future outlook for the cosmetic implant market is positive, driven by continuous technological advancements, increasing demand for aesthetic enhancements, and the expansion of the global middle class. Strategic opportunities lie in developing innovative implants with enhanced biocompatibility, minimizing invasiveness, and improving personalized treatment options. Focusing on emerging markets and developing strategic partnerships will be crucial for sustained market leadership. The market is poised to capture significant growth opportunities fueled by the adoption of advanced technologies and changing consumer preferences.
Cosmetic Implant Industry Segmentation
-
1. Raw Material
- 1.1. Polymer implants
- 1.2. Ceramic implants
- 1.3. Metal implants
- 1.4. Biological material implants
-
2. Application
- 2.1. Dental implants
- 2.2. Breast implants
- 2.3. Facial implants
- 2.4. Others
Cosmetic Implant Industry Segmentation By Geography
-
1. North America
- 1.1. United States
- 1.2. Canada
- 1.3. Mexico
-
2. Europe
- 2.1. Germany
- 2.2. United Kingdom
- 2.3. France
- 2.4. Italy
- 2.5. Spain
- 2.6. Rest of Europe
-
3. Asia Pacific
- 3.1. China
- 3.2. Japan
- 3.3. India
- 3.4. Australia
- 3.5. South Korea
- 3.6. Rest of Asia Pacific
-
4. Middle East and Africa
- 4.1. GCC
- 4.2. South Africa
- 4.3. Rest of Middle East and Africa
-
5. South America
- 5.1. Brazil
- 5.2. Argentina
- 5.3. Rest of South America
Cosmetic Implant Industry REPORT HIGHLIGHTS
| Aspects | Details |
|---|---|
| Study Period | 2019-2033 |
| Base Year | 2024 |
| Estimated Year | 2025 |
| Forecast Period | 2025-2033 |
| Historical Period | 2019-2024 |
| Growth Rate | CAGR of 7.49% from 2019-2033 |
| Segmentation |
|
Table of Contents
- 1. Introduction
- 1.1. Research Scope
- 1.2. Market Segmentation
- 1.3. Research Methodology
- 1.4. Definitions and Assumptions
- 2. Executive Summary
- 2.1. Introduction
- 3. Market Dynamics
- 3.1. Introduction
- 3.2. Market Drivers
- 3.2.1 The overall rise in cosmetic surgeries
- 3.2.2 including both surgical and non-surgical options
- 3.2.3 is boosting the market for implants
- 3.3. Market Restrains
- 3.3.1. The high costs associated with cosmetic implant surgeries can limit access for many individuals
- 3.4. Market Trends
- 3.4.1. Advances in minimally invasive surgical techniques and less invasive procedures will likely expand the market for cosmetic implants
- 4. Market Factor Analysis
- 4.1. Porters Five Forces
- 4.2. Supply/Value Chain
- 4.3. PESTEL analysis
- 4.4. Market Entropy
- 4.5. Patent/Trademark Analysis
- 5. Global Cosmetic Implant Industry Analysis, Insights and Forecast, 2019-2031
- 5.1. Market Analysis, Insights and Forecast - by Raw Material
- 5.1.1. Polymer implants
- 5.1.2. Ceramic implants
- 5.1.3. Metal implants
- 5.1.4. Biological material implants
- 5.2. Market Analysis, Insights and Forecast - by Application
- 5.2.1. Dental implants
- 5.2.2. Breast implants
- 5.2.3. Facial implants
- 5.2.4. Others
- 5.3. Market Analysis, Insights and Forecast - by Region
- 5.3.1. North America
- 5.3.2. Europe
- 5.3.3. Asia Pacific
- 5.3.4. Middle East and Africa
- 5.3.5. South America
- 5.1. Market Analysis, Insights and Forecast - by Raw Material
- 6. North America Cosmetic Implant Industry Analysis, Insights and Forecast, 2019-2031
- 6.1. Market Analysis, Insights and Forecast - by Raw Material
- 6.1.1. Polymer implants
- 6.1.2. Ceramic implants
- 6.1.3. Metal implants
- 6.1.4. Biological material implants
- 6.2. Market Analysis, Insights and Forecast - by Application
- 6.2.1. Dental implants
- 6.2.2. Breast implants
- 6.2.3. Facial implants
- 6.2.4. Others
- 6.1. Market Analysis, Insights and Forecast - by Raw Material
- 7. Europe Cosmetic Implant Industry Analysis, Insights and Forecast, 2019-2031
- 7.1. Market Analysis, Insights and Forecast - by Raw Material
- 7.1.1. Polymer implants
- 7.1.2. Ceramic implants
- 7.1.3. Metal implants
- 7.1.4. Biological material implants
- 7.2. Market Analysis, Insights and Forecast - by Application
- 7.2.1. Dental implants
- 7.2.2. Breast implants
- 7.2.3. Facial implants
- 7.2.4. Others
- 7.1. Market Analysis, Insights and Forecast - by Raw Material
- 8. Asia Pacific Cosmetic Implant Industry Analysis, Insights and Forecast, 2019-2031
- 8.1. Market Analysis, Insights and Forecast - by Raw Material
- 8.1.1. Polymer implants
- 8.1.2. Ceramic implants
- 8.1.3. Metal implants
- 8.1.4. Biological material implants
- 8.2. Market Analysis, Insights and Forecast - by Application
- 8.2.1. Dental implants
- 8.2.2. Breast implants
- 8.2.3. Facial implants
- 8.2.4. Others
- 8.1. Market Analysis, Insights and Forecast - by Raw Material
- 9. Middle East and Africa Cosmetic Implant Industry Analysis, Insights and Forecast, 2019-2031
- 9.1. Market Analysis, Insights and Forecast - by Raw Material
- 9.1.1. Polymer implants
- 9.1.2. Ceramic implants
- 9.1.3. Metal implants
- 9.1.4. Biological material implants
- 9.2. Market Analysis, Insights and Forecast - by Application
- 9.2.1. Dental implants
- 9.2.2. Breast implants
- 9.2.3. Facial implants
- 9.2.4. Others
- 9.1. Market Analysis, Insights and Forecast - by Raw Material
- 10. South America Cosmetic Implant Industry Analysis, Insights and Forecast, 2019-2031
- 10.1. Market Analysis, Insights and Forecast - by Raw Material
- 10.1.1. Polymer implants
- 10.1.2. Ceramic implants
- 10.1.3. Metal implants
- 10.1.4. Biological material implants
- 10.2. Market Analysis, Insights and Forecast - by Application
- 10.2.1. Dental implants
- 10.2.2. Breast implants
- 10.2.3. Facial implants
- 10.2.4. Others
- 10.1. Market Analysis, Insights and Forecast - by Raw Material
- 11. North Americ Cosmetic Implant Industry Analysis, Insights and Forecast, 2019-2031
- 11.1. Market Analysis, Insights and Forecast - By Country/Sub-region
- 11.1.1 United States
- 11.1.2 Canada
- 11.1.3 Mexico
- 12. South America Cosmetic Implant Industry Analysis, Insights and Forecast, 2019-2031
- 12.1. Market Analysis, Insights and Forecast - By Country/Sub-region
- 12.1.1 Brazil
- 12.1.2 Mexico
- 12.1.3 Rest of South America
- 13. Europe Cosmetic Implant Industry Analysis, Insights and Forecast, 2019-2031
- 13.1. Market Analysis, Insights and Forecast - By Country/Sub-region
- 13.1.1 Germany
- 13.1.2 United Kingdom
- 13.1.3 France
- 13.1.4 Italy
- 13.1.5 Spain
- 13.1.6 Rest of Europe
- 14. Asia Pacific Cosmetic Implant Industry Analysis, Insights and Forecast, 2019-2031
- 14.1. Market Analysis, Insights and Forecast - By Country/Sub-region
- 14.1.1 China
- 14.1.2 Japan
- 14.1.3 India
- 14.1.4 South Korea
- 14.1.5 Taiwan
- 14.1.6 Australia
- 14.1.7 Rest of Asia-Pacific
- 15. MEA Cosmetic Implant Industry Analysis, Insights and Forecast, 2019-2031
- 15.1. Market Analysis, Insights and Forecast - By Country/Sub-region
- 15.1.1 Middle East
- 15.1.2 Africa
- 16. Competitive Analysis
- 16.1. Global Market Share Analysis 2024
- 16.2. Company Profiles
- 16.2.1 Henry Schein Inc
- 16.2.1.1. Overview
- 16.2.1.2. Products
- 16.2.1.3. SWOT Analysis
- 16.2.1.4. Recent Developments
- 16.2.1.5. Financials (Based on Availability)
- 16.2.2 Implantech
- 16.2.2.1. Overview
- 16.2.2.2. Products
- 16.2.2.3. SWOT Analysis
- 16.2.2.4. Recent Developments
- 16.2.2.5. Financials (Based on Availability)
- 16.2.3 Zimmer Biomet
- 16.2.3.1. Overview
- 16.2.3.2. Products
- 16.2.3.3. SWOT Analysis
- 16.2.3.4. Recent Developments
- 16.2.3.5. Financials (Based on Availability)
- 16.2.4 3M
- 16.2.4.1. Overview
- 16.2.4.2. Products
- 16.2.4.3. SWOT Analysis
- 16.2.4.4. Recent Developments
- 16.2.4.5. Financials (Based on Availability)
- 16.2.5 Dentsply Sirona
- 16.2.5.1. Overview
- 16.2.5.2. Products
- 16.2.5.3. SWOT Analysis
- 16.2.5.4. Recent Developments
- 16.2.5.5. Financials (Based on Availability)
- 16.2.6 Sientra Inc
- 16.2.6.1. Overview
- 16.2.6.2. Products
- 16.2.6.3. SWOT Analysis
- 16.2.6.4. Recent Developments
- 16.2.6.5. Financials (Based on Availability)
- 16.2.7 Cochlear Ltd
- 16.2.7.1. Overview
- 16.2.7.2. Products
- 16.2.7.3. SWOT Analysis
- 16.2.7.4. Recent Developments
- 16.2.7.5. Financials (Based on Availability)
- 16.2.8 Johnson & Johnson
- 16.2.8.1. Overview
- 16.2.8.2. Products
- 16.2.8.3. SWOT Analysis
- 16.2.8.4. Recent Developments
- 16.2.8.5. Financials (Based on Availability)
- 16.2.9 Allergan
- 16.2.9.1. Overview
- 16.2.9.2. Products
- 16.2.9.3. SWOT Analysis
- 16.2.9.4. Recent Developments
- 16.2.9.5. Financials (Based on Availability)
- 16.2.10 GC Aesthetics
- 16.2.10.1. Overview
- 16.2.10.2. Products
- 16.2.10.3. SWOT Analysis
- 16.2.10.4. Recent Developments
- 16.2.10.5. Financials (Based on Availability)
- 16.2.1 Henry Schein Inc
List of Figures
- Figure 1: Global Cosmetic Implant Industry Revenue Breakdown (Million, %) by Region 2024 & 2032
- Figure 2: North Americ Cosmetic Implant Industry Revenue (Million), by Country 2024 & 2032
- Figure 3: North Americ Cosmetic Implant Industry Revenue Share (%), by Country 2024 & 2032
- Figure 4: South America Cosmetic Implant Industry Revenue (Million), by Country 2024 & 2032
- Figure 5: South America Cosmetic Implant Industry Revenue Share (%), by Country 2024 & 2032
- Figure 6: Europe Cosmetic Implant Industry Revenue (Million), by Country 2024 & 2032
- Figure 7: Europe Cosmetic Implant Industry Revenue Share (%), by Country 2024 & 2032
- Figure 8: Asia Pacific Cosmetic Implant Industry Revenue (Million), by Country 2024 & 2032
- Figure 9: Asia Pacific Cosmetic Implant Industry Revenue Share (%), by Country 2024 & 2032
- Figure 10: MEA Cosmetic Implant Industry Revenue (Million), by Country 2024 & 2032
- Figure 11: MEA Cosmetic Implant Industry Revenue Share (%), by Country 2024 & 2032
- Figure 12: North America Cosmetic Implant Industry Revenue (Million), by Raw Material 2024 & 2032
- Figure 13: North America Cosmetic Implant Industry Revenue Share (%), by Raw Material 2024 & 2032
- Figure 14: North America Cosmetic Implant Industry Revenue (Million), by Application 2024 & 2032
- Figure 15: North America Cosmetic Implant Industry Revenue Share (%), by Application 2024 & 2032
- Figure 16: North America Cosmetic Implant Industry Revenue (Million), by Country 2024 & 2032
- Figure 17: North America Cosmetic Implant Industry Revenue Share (%), by Country 2024 & 2032
- Figure 18: Europe Cosmetic Implant Industry Revenue (Million), by Raw Material 2024 & 2032
- Figure 19: Europe Cosmetic Implant Industry Revenue Share (%), by Raw Material 2024 & 2032
- Figure 20: Europe Cosmetic Implant Industry Revenue (Million), by Application 2024 & 2032
- Figure 21: Europe Cosmetic Implant Industry Revenue Share (%), by Application 2024 & 2032
- Figure 22: Europe Cosmetic Implant Industry Revenue (Million), by Country 2024 & 2032
- Figure 23: Europe Cosmetic Implant Industry Revenue Share (%), by Country 2024 & 2032
- Figure 24: Asia Pacific Cosmetic Implant Industry Revenue (Million), by Raw Material 2024 & 2032
- Figure 25: Asia Pacific Cosmetic Implant Industry Revenue Share (%), by Raw Material 2024 & 2032
- Figure 26: Asia Pacific Cosmetic Implant Industry Revenue (Million), by Application 2024 & 2032
- Figure 27: Asia Pacific Cosmetic Implant Industry Revenue Share (%), by Application 2024 & 2032
- Figure 28: Asia Pacific Cosmetic Implant Industry Revenue (Million), by Country 2024 & 2032
- Figure 29: Asia Pacific Cosmetic Implant Industry Revenue Share (%), by Country 2024 & 2032
- Figure 30: Middle East and Africa Cosmetic Implant Industry Revenue (Million), by Raw Material 2024 & 2032
- Figure 31: Middle East and Africa Cosmetic Implant Industry Revenue Share (%), by Raw Material 2024 & 2032
- Figure 32: Middle East and Africa Cosmetic Implant Industry Revenue (Million), by Application 2024 & 2032
- Figure 33: Middle East and Africa Cosmetic Implant Industry Revenue Share (%), by Application 2024 & 2032
- Figure 34: Middle East and Africa Cosmetic Implant Industry Revenue (Million), by Country 2024 & 2032
- Figure 35: Middle East and Africa Cosmetic Implant Industry Revenue Share (%), by Country 2024 & 2032
- Figure 36: South America Cosmetic Implant Industry Revenue (Million), by Raw Material 2024 & 2032
- Figure 37: South America Cosmetic Implant Industry Revenue Share (%), by Raw Material 2024 & 2032
- Figure 38: South America Cosmetic Implant Industry Revenue (Million), by Application 2024 & 2032
- Figure 39: South America Cosmetic Implant Industry Revenue Share (%), by Application 2024 & 2032
- Figure 40: South America Cosmetic Implant Industry Revenue (Million), by Country 2024 & 2032
- Figure 41: South America Cosmetic Implant Industry Revenue Share (%), by Country 2024 & 2032
List of Tables
- Table 1: Global Cosmetic Implant Industry Revenue Million Forecast, by Region 2019 & 2032
- Table 2: Global Cosmetic Implant Industry Revenue Million Forecast, by Raw Material 2019 & 2032
- Table 3: Global Cosmetic Implant Industry Revenue Million Forecast, by Application 2019 & 2032
- Table 4: Global Cosmetic Implant Industry Revenue Million Forecast, by Region 2019 & 2032
- Table 5: Global Cosmetic Implant Industry Revenue Million Forecast, by Country 2019 & 2032
- Table 6: United States Cosmetic Implant Industry Revenue (Million) Forecast, by Application 2019 & 2032
- Table 7: Canada Cosmetic Implant Industry Revenue (Million) Forecast, by Application 2019 & 2032
- Table 8: Mexico Cosmetic Implant Industry Revenue (Million) Forecast, by Application 2019 & 2032
- Table 9: Global Cosmetic Implant Industry Revenue Million Forecast, by Country 2019 & 2032
- Table 10: Brazil Cosmetic Implant Industry Revenue (Million) Forecast, by Application 2019 & 2032
- Table 11: Mexico Cosmetic Implant Industry Revenue (Million) Forecast, by Application 2019 & 2032
- Table 12: Rest of South America Cosmetic Implant Industry Revenue (Million) Forecast, by Application 2019 & 2032
- Table 13: Global Cosmetic Implant Industry Revenue Million Forecast, by Country 2019 & 2032
- Table 14: Germany Cosmetic Implant Industry Revenue (Million) Forecast, by Application 2019 & 2032
- Table 15: United Kingdom Cosmetic Implant Industry Revenue (Million) Forecast, by Application 2019 & 2032
- Table 16: France Cosmetic Implant Industry Revenue (Million) Forecast, by Application 2019 & 2032
- Table 17: Italy Cosmetic Implant Industry Revenue (Million) Forecast, by Application 2019 & 2032
- Table 18: Spain Cosmetic Implant Industry Revenue (Million) Forecast, by Application 2019 & 2032
- Table 19: Rest of Europe Cosmetic Implant Industry Revenue (Million) Forecast, by Application 2019 & 2032
- Table 20: Global Cosmetic Implant Industry Revenue Million Forecast, by Country 2019 & 2032
- Table 21: China Cosmetic Implant Industry Revenue (Million) Forecast, by Application 2019 & 2032
- Table 22: Japan Cosmetic Implant Industry Revenue (Million) Forecast, by Application 2019 & 2032
- Table 23: India Cosmetic Implant Industry Revenue (Million) Forecast, by Application 2019 & 2032
- Table 24: South Korea Cosmetic Implant Industry Revenue (Million) Forecast, by Application 2019 & 2032
- Table 25: Taiwan Cosmetic Implant Industry Revenue (Million) Forecast, by Application 2019 & 2032
- Table 26: Australia Cosmetic Implant Industry Revenue (Million) Forecast, by Application 2019 & 2032
- Table 27: Rest of Asia-Pacific Cosmetic Implant Industry Revenue (Million) Forecast, by Application 2019 & 2032
- Table 28: Global Cosmetic Implant Industry Revenue Million Forecast, by Country 2019 & 2032
- Table 29: Middle East Cosmetic Implant Industry Revenue (Million) Forecast, by Application 2019 & 2032
- Table 30: Africa Cosmetic Implant Industry Revenue (Million) Forecast, by Application 2019 & 2032
- Table 31: Global Cosmetic Implant Industry Revenue Million Forecast, by Raw Material 2019 & 2032
- Table 32: Global Cosmetic Implant Industry Revenue Million Forecast, by Application 2019 & 2032
- Table 33: Global Cosmetic Implant Industry Revenue Million Forecast, by Country 2019 & 2032
- Table 34: United States Cosmetic Implant Industry Revenue (Million) Forecast, by Application 2019 & 2032
- Table 35: Canada Cosmetic Implant Industry Revenue (Million) Forecast, by Application 2019 & 2032
- Table 36: Mexico Cosmetic Implant Industry Revenue (Million) Forecast, by Application 2019 & 2032
- Table 37: Global Cosmetic Implant Industry Revenue Million Forecast, by Raw Material 2019 & 2032
- Table 38: Global Cosmetic Implant Industry Revenue Million Forecast, by Application 2019 & 2032
- Table 39: Global Cosmetic Implant Industry Revenue Million Forecast, by Country 2019 & 2032
- Table 40: Germany Cosmetic Implant Industry Revenue (Million) Forecast, by Application 2019 & 2032
- Table 41: United Kingdom Cosmetic Implant Industry Revenue (Million) Forecast, by Application 2019 & 2032
- Table 42: France Cosmetic Implant Industry Revenue (Million) Forecast, by Application 2019 & 2032
- Table 43: Italy Cosmetic Implant Industry Revenue (Million) Forecast, by Application 2019 & 2032
- Table 44: Spain Cosmetic Implant Industry Revenue (Million) Forecast, by Application 2019 & 2032
- Table 45: Rest of Europe Cosmetic Implant Industry Revenue (Million) Forecast, by Application 2019 & 2032
- Table 46: Global Cosmetic Implant Industry Revenue Million Forecast, by Raw Material 2019 & 2032
- Table 47: Global Cosmetic Implant Industry Revenue Million Forecast, by Application 2019 & 2032
- Table 48: Global Cosmetic Implant Industry Revenue Million Forecast, by Country 2019 & 2032
- Table 49: China Cosmetic Implant Industry Revenue (Million) Forecast, by Application 2019 & 2032
- Table 50: Japan Cosmetic Implant Industry Revenue (Million) Forecast, by Application 2019 & 2032
- Table 51: India Cosmetic Implant Industry Revenue (Million) Forecast, by Application 2019 & 2032
- Table 52: Australia Cosmetic Implant Industry Revenue (Million) Forecast, by Application 2019 & 2032
- Table 53: South Korea Cosmetic Implant Industry Revenue (Million) Forecast, by Application 2019 & 2032
- Table 54: Rest of Asia Pacific Cosmetic Implant Industry Revenue (Million) Forecast, by Application 2019 & 2032
- Table 55: Global Cosmetic Implant Industry Revenue Million Forecast, by Raw Material 2019 & 2032
- Table 56: Global Cosmetic Implant Industry Revenue Million Forecast, by Application 2019 & 2032
- Table 57: Global Cosmetic Implant Industry Revenue Million Forecast, by Country 2019 & 2032
- Table 58: GCC Cosmetic Implant Industry Revenue (Million) Forecast, by Application 2019 & 2032
- Table 59: South Africa Cosmetic Implant Industry Revenue (Million) Forecast, by Application 2019 & 2032
- Table 60: Rest of Middle East and Africa Cosmetic Implant Industry Revenue (Million) Forecast, by Application 2019 & 2032
- Table 61: Global Cosmetic Implant Industry Revenue Million Forecast, by Raw Material 2019 & 2032
- Table 62: Global Cosmetic Implant Industry Revenue Million Forecast, by Application 2019 & 2032
- Table 63: Global Cosmetic Implant Industry Revenue Million Forecast, by Country 2019 & 2032
- Table 64: Brazil Cosmetic Implant Industry Revenue (Million) Forecast, by Application 2019 & 2032
- Table 65: Argentina Cosmetic Implant Industry Revenue (Million) Forecast, by Application 2019 & 2032
- Table 66: Rest of South America Cosmetic Implant Industry Revenue (Million) Forecast, by Application 2019 & 2032
Frequently Asked Questions
1. What is the projected Compound Annual Growth Rate (CAGR) of the Cosmetic Implant Industry?
The projected CAGR is approximately 7.49%.
2. Which companies are prominent players in the Cosmetic Implant Industry?
Key companies in the market include Henry Schein Inc, Implantech, Zimmer Biomet, 3M, Dentsply Sirona, Sientra Inc, Cochlear Ltd, Johnson & Johnson, Allergan, GC Aesthetics.
3. What are the main segments of the Cosmetic Implant Industry?
The market segments include Raw Material, Application.
4. Can you provide details about the market size?
The market size is estimated to be USD 11.86 Million as of 2022.
5. What are some drivers contributing to market growth?
The overall rise in cosmetic surgeries. including both surgical and non-surgical options. is boosting the market for implants.
6. What are the notable trends driving market growth?
Advances in minimally invasive surgical techniques and less invasive procedures will likely expand the market for cosmetic implants.
7. Are there any restraints impacting market growth?
The high costs associated with cosmetic implant surgeries can limit access for many individuals.
8. Can you provide examples of recent developments in the market?
May 2022: A New Zealand scientist launched mini dental implants for tooth replacement which use the latest dental technology to provide the same functional and aesthetic benefits as traditional implants in a much shorter time and with far less inconvenience to the patient.
9. What pricing options are available for accessing the report?
Pricing options include single-user, multi-user, and enterprise licenses priced at USD 4750, USD 5250, and USD 8750 respectively.
10. Is the market size provided in terms of value or volume?
The market size is provided in terms of value, measured in Million.
11. Are there any specific market keywords associated with the report?
Yes, the market keyword associated with the report is "Cosmetic Implant Industry," which aids in identifying and referencing the specific market segment covered.
12. How do I determine which pricing option suits my needs best?
The pricing options vary based on user requirements and access needs. Individual users may opt for single-user licenses, while businesses requiring broader access may choose multi-user or enterprise licenses for cost-effective access to the report.
13. Are there any additional resources or data provided in the Cosmetic Implant Industry report?
While the report offers comprehensive insights, it's advisable to review the specific contents or supplementary materials provided to ascertain if additional resources or data are available.
14. How can I stay updated on further developments or reports in the Cosmetic Implant Industry?
To stay informed about further developments, trends, and reports in the Cosmetic Implant Industry, consider subscribing to industry newsletters, following relevant companies and organizations, or regularly checking reputable industry news sources and publications.
Methodology
Step 1 - Identification of Relevant Samples Size from Population Database


Step 2 - Approaches for Defining Global Market Size (Value, Volume* & Price*)

Note*: In applicable scenarios
Step 3 - Data Sources
Primary Research
- Web Analytics
- Survey Reports
- Research Institute
- Latest Research Reports
- Opinion Leaders
Secondary Research
- Annual Reports
- White Paper
- Latest Press Release
- Industry Association
- Paid Database
- Investor Presentations

Step 4 - Data Triangulation
Involves using different sources of information in order to increase the validity of a study
These sources are likely to be stakeholders in a program - participants, other researchers, program staff, other community members, and so on.
Then we put all data in single framework & apply various statistical tools to find out the dynamic on the market.
During the analysis stage, feedback from the stakeholder groups would be compared to determine areas of agreement as well as areas of divergence


