
Key Insights
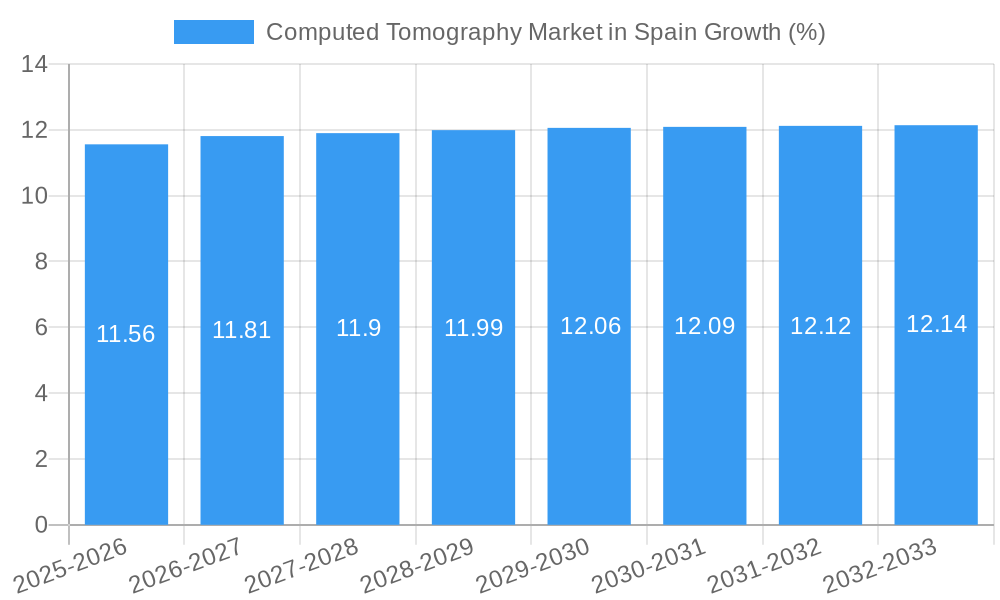
The Spanish Computed Tomography (CT) market, valued at €201.59 million in 2025, is projected to experience robust growth, driven by factors such as an aging population necessitating increased diagnostic imaging, rising prevalence of chronic diseases like cardiovascular ailments and cancer, and technological advancements leading to improved image quality and faster scan times. The market is segmented by slice type (low, medium, high), application (oncology, neurology, cardiovascular, musculoskeletal, other), and end-user (hospitals, diagnostic centers, others). Hospitals currently dominate the end-user segment, reflecting the concentration of advanced diagnostic capabilities within established healthcare facilities. The high slice CT segment is expected to witness faster growth due to its superior image resolution and diagnostic capabilities, particularly crucial for complex procedures. The oncology application segment holds significant market share, reflecting the high incidence of cancer and the vital role CT plays in diagnosis, treatment planning, and monitoring. Growth in the market might be somewhat restrained by budgetary constraints within the Spanish healthcare system and the increasing adoption of alternative imaging modalities, such as MRI, in specific applications. However, ongoing technological innovations and increasing demand for faster and more accurate diagnosis are expected to overcome these challenges.
The competitive landscape is characterized by the presence of both global giants like Siemens Healthineers, GE Healthcare, and Philips, as well as specialized players like Planmed Oy. These companies are engaged in intense competition, focusing on product innovation, strategic partnerships, and service offerings to capture a larger share of the market. Given the increasing demand for advanced imaging technology and the supportive regulatory environment in Spain, the CT market is expected to witness sustained growth throughout the forecast period (2025-2033), exceeding the initial projections based on the 5.50% CAGR. This growth will be particularly noticeable in regions with higher population density and established healthcare infrastructure. Further market penetration will depend on factors such as government healthcare policies, investment in advanced medical equipment, and the ongoing evolution of diagnostic imaging technology.
Computed Tomography Market in Spain: A Comprehensive Report (2019-2033)
This in-depth report provides a comprehensive analysis of the Computed Tomography (CT) market in Spain, covering the period from 2019 to 2033. It offers invaluable insights into market structure, competitive dynamics, industry trends, and future growth prospects, making it an essential resource for industry stakeholders, investors, and strategic decision-makers. The report leverages rigorous data analysis and expert insights to provide actionable intelligence for navigating the evolving Spanish CT market. The market size in 2025 is estimated at xx Million, with a projected value of xx Million by 2033.
Computed Tomography Market in Spain Market Structure & Competitive Dynamics
This section analyzes the competitive landscape of the Spanish CT market, encompassing market concentration, innovation ecosystems, regulatory frameworks, product substitutes, end-user trends, and mergers & acquisitions (M&A) activities. The market is moderately concentrated, with key players holding significant market share. However, the presence of several smaller players fosters competition and innovation.
- Market Concentration: The Herfindahl-Hirschman Index (HHI) for the Spanish CT market in 2024 was estimated at xx, indicating a moderately concentrated market.
- Innovation Ecosystems: Spain's strong research institutions and collaborations between healthcare providers and technology companies drive innovation in CT technology.
- Regulatory Frameworks: The Spanish regulatory environment for medical devices, including CT scanners, is stringent, ensuring high safety and efficacy standards. This regulatory framework impacts market entry and product approvals.
- Product Substitutes: While CT remains a dominant imaging modality, alternative technologies like MRI and ultrasound present competitive pressures, particularly in specific applications.
- End-User Trends: Increasing demand for advanced imaging technologies, coupled with rising prevalence of chronic diseases, is driving growth in the CT market. A shift towards minimally invasive procedures further fuels demand.
- M&A Activities: The Spanish CT market has witnessed a moderate level of M&A activity in recent years, with deal values ranging from xx Million to xx Million. These activities often focus on expanding market reach and product portfolios. For example, the partnership between Philips and Viamed (detailed later) showcases strategic collaborations within the market.
Computed Tomography Market in Spain Industry Trends & Insights
This section delves into the key trends shaping the Spanish CT market, including market growth drivers, technological disruptions, consumer preferences, and competitive dynamics. The market experienced a Compound Annual Growth Rate (CAGR) of xx% during the historical period (2019-2024). Market penetration of CT scanners in hospitals across Spain is currently estimated at xx%, with significant potential for further growth in under-served regions.
The market is driven by factors such as increasing prevalence of chronic diseases (e.g., cardiovascular diseases, cancer), rising geriatric population, technological advancements leading to improved image quality and reduced radiation exposure, and government initiatives aimed at enhancing healthcare infrastructure. However, challenges such as budgetary constraints, reimbursement policies, and the need for skilled professionals impact market growth. Technological disruptions, including the introduction of photon-counting CT, are reshaping the competitive landscape and creating opportunities for innovation. Consumer preferences are shifting towards advanced features, such as faster scan times and improved image clarity, impacting product demand and development. The competitive dynamics are characterized by intense competition among major players and the emergence of niche players focusing on specific applications or geographical areas.
Dominant Markets & Segments in Computed Tomography Market in Spain
This section identifies the dominant segments within the Spanish CT market based on type, application, and end-user.
Type: High-slice CT scanners dominate the market due to superior image quality and diagnostic capabilities.
- Key Drivers for High-Slice CT: Demand for enhanced diagnostic capabilities, technological advancements, and willingness to invest in premium solutions by major healthcare providers.
Application: Oncology holds the largest market share due to the high prevalence of cancer and the critical role of CT in cancer diagnosis and treatment planning.
- Key Drivers for Oncology Applications: Rising cancer incidence rates, increasing adoption of targeted therapies guided by CT imaging, and advancements in image-guided procedures.
End-User: Hospitals are the primary end-users, owing to their comprehensive diagnostic capabilities and the need for advanced imaging technologies.
- Key Drivers for Hospital End-Users: Availability of skilled professionals, comprehensive diagnostic infrastructure, and financial capacity to invest in advanced imaging equipment.
Cardiovascular applications are showing strong growth driven by increasing cardiovascular disease prevalence. Musculoskeletal applications are also significant, with growing demand driven by an aging population and increased prevalence of orthopedic conditions. Diagnostic centers are an important segment due to the increasing preference for outsourcing diagnostic services.
Computed Tomography Market in Spain Product Innovations
Recent advancements in CT technology, such as the introduction of photon-counting CT scanners (e.g., Siemens Healthineers' NAEOTOM Alpha), offer improved image quality, reduced radiation dose, and enhanced diagnostic capabilities. These innovations cater to the growing demand for advanced imaging solutions and improve patient care. The market is also witnessing the introduction of AI-powered image analysis tools that automate image interpretation and enhance diagnostic accuracy. This aligns with the industry trend of leveraging technological advancements to improve efficiency and outcomes.
Report Segmentation & Scope
This report segments the Spanish CT market by type (Low Slice, Medium Slice, High Slice), application (Oncology, Neurology, Cardiovascular, Musculoskeletal, Other Applications), and end-user (Hospitals, Diagnostic Centers, Other End Users). Each segment is analyzed based on its market size, growth projections, and competitive dynamics. The report covers the historical period (2019-2024), the base year (2025), and the forecast period (2025-2033).
Key Drivers of Computed Tomography Market in Spain Growth
Several factors fuel the growth of the Spanish CT market. Technological advancements, resulting in improved image quality, reduced scan times, and lower radiation doses, are key drivers. The increasing prevalence of chronic diseases, such as cardiovascular diseases and cancer, necessitate advanced diagnostic tools like CT scanners. Government initiatives aimed at improving healthcare infrastructure and increasing access to advanced medical technologies further contribute to market expansion. Finally, rising disposable incomes and increasing healthcare expenditure are also significant factors.
Challenges in the Computed Tomography Market in Spain Sector
Despite the growth potential, the Spanish CT market faces challenges. High initial investment costs for purchasing and maintaining CT scanners can hinder market penetration, particularly in smaller hospitals and clinics. Strict regulatory frameworks and reimbursement policies can impact market access for new technologies and increase the time to market for innovative products. Furthermore, the need for skilled professionals to operate and interpret CT scans can create a bottleneck, limiting market expansion.
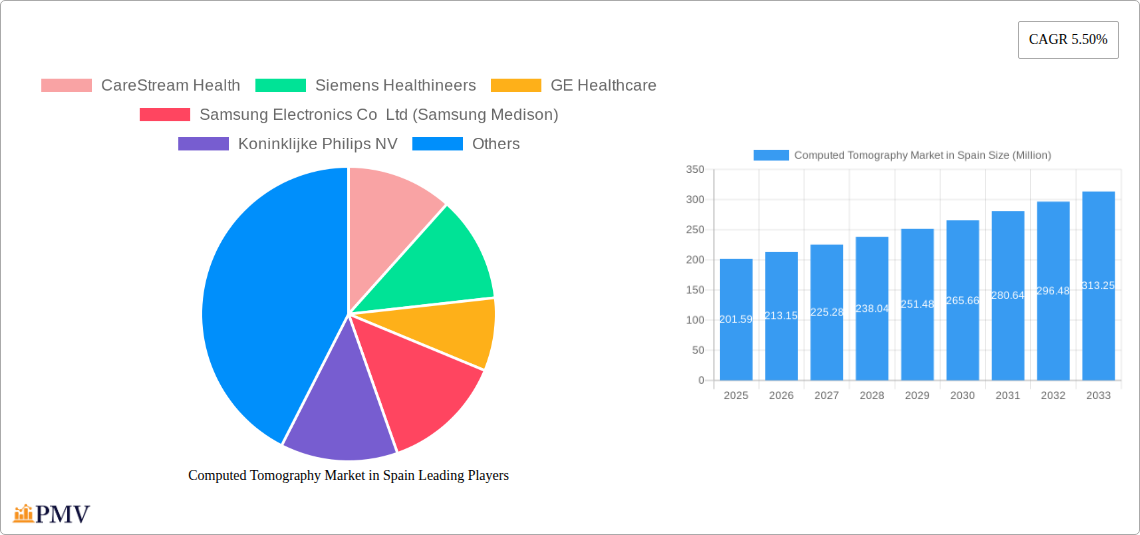
Leading Players in the Computed Tomography Market in Spain Market
- CareStream Health
- Siemens Healthineers
- GE Healthcare
- Samsung Electronics Co Ltd (Samsung Medison)
- Koninklijke Philips NV
- Canon Medical Systems Corporation
- Planmed Oy
- Fujifilm Holdings Corporation
Key Developments in Computed Tomography Market in Spain Sector
- November 2021: Siemens Healthineers launched the NAEOTOM Alpha, the world's first photon-counting CT scanner, significantly impacting image quality and radiation dose reduction. This launch marks a pivotal moment in the advancement of CT technology within the Spanish market.
- May 2021: Philips secured a major contract with Viamed, a leading private hospital group in Spain, to install advanced diagnostic imaging solutions, including CT scanners, expanding Philips' market presence and enhancing patient care across Viamed's network. This demonstrates successful strategic partnerships driving market penetration.
Strategic Computed Tomography Market in Spain Market Outlook
The Spanish CT market presents significant growth opportunities, driven by technological advancements, increasing prevalence of chronic diseases, and government support for healthcare infrastructure development. Strategic investments in advanced CT technologies, particularly photon-counting CT and AI-powered image analysis tools, offer significant returns. Partnerships between technology providers and healthcare institutions will play a crucial role in expanding market access and improving patient care. Focusing on specific applications, such as oncology and cardiovascular imaging, will allow for niche market penetration and increased profitability. The market outlook is positive, with sustained growth expected throughout the forecast period.
Computed Tomography Market in Spain Segmentation
-
1. Type
- 1.1. Low Slice
- 1.2. Medium Slice
- 1.3. High Slice
-
2. Application
- 2.1. Oncology
- 2.2. Neurology
- 2.3. Cardiovascular
- 2.4. Musculoskeletal
- 2.5. Other Applications
-
3. End User
- 3.1. Hospitals
- 3.2. Diagnostic Centers
- 3.3. Other End Users
Computed Tomography Market in Spain Segmentation By Geography
-
1. North America
- 1.1. United States
- 1.2. Canada
- 1.3. Mexico
-
2. South America
- 2.1. Brazil
- 2.2. Argentina
- 2.3. Rest of South America
-
3. Europe
- 3.1. United Kingdom
- 3.2. Germany
- 3.3. France
- 3.4. Italy
- 3.5. Spain
- 3.6. Russia
- 3.7. Benelux
- 3.8. Nordics
- 3.9. Rest of Europe
-
4. Middle East & Africa
- 4.1. Turkey
- 4.2. Israel
- 4.3. GCC
- 4.4. North Africa
- 4.5. South Africa
- 4.6. Rest of Middle East & Africa
-
5. Asia Pacific
- 5.1. China
- 5.2. India
- 5.3. Japan
- 5.4. South Korea
- 5.5. ASEAN
- 5.6. Oceania
- 5.7. Rest of Asia Pacific
Computed Tomography Market in Spain REPORT HIGHLIGHTS
| Aspects | Details |
|---|---|
| Study Period | 2019-2033 |
| Base Year | 2024 |
| Estimated Year | 2025 |
| Forecast Period | 2025-2033 |
| Historical Period | 2019-2024 |
| Growth Rate | CAGR of 5.50% from 2019-2033 |
| Segmentation |
|
Table of Contents
- 1. Introduction
- 1.1. Research Scope
- 1.2. Market Segmentation
- 1.3. Research Methodology
- 1.4. Definitions and Assumptions
- 2. Executive Summary
- 2.1. Introduction
- 3. Market Dynamics
- 3.1. Introduction
- 3.2. Market Drivers
- 3.2.1. Increasing Geriatric Population and Chronic Disease Burden; Technological Advancements in Computed Tomography
- 3.3. Market Restrains
- 3.3.1. High Cost Associated With CT Scan Procedure and Equipment
- 3.4. Market Trends
- 3.4.1. Oncology is Expected to Dominate the Application Segment
- 4. Market Factor Analysis
- 4.1. Porters Five Forces
- 4.2. Supply/Value Chain
- 4.3. PESTEL analysis
- 4.4. Market Entropy
- 4.5. Patent/Trademark Analysis
- 5. Global Computed Tomography Market in Spain Analysis, Insights and Forecast, 2019-2031
- 5.1. Market Analysis, Insights and Forecast - by Type
- 5.1.1. Low Slice
- 5.1.2. Medium Slice
- 5.1.3. High Slice
- 5.2. Market Analysis, Insights and Forecast - by Application
- 5.2.1. Oncology
- 5.2.2. Neurology
- 5.2.3. Cardiovascular
- 5.2.4. Musculoskeletal
- 5.2.5. Other Applications
- 5.3. Market Analysis, Insights and Forecast - by End User
- 5.3.1. Hospitals
- 5.3.2. Diagnostic Centers
- 5.3.3. Other End Users
- 5.4. Market Analysis, Insights and Forecast - by Region
- 5.4.1. North America
- 5.4.2. South America
- 5.4.3. Europe
- 5.4.4. Middle East & Africa
- 5.4.5. Asia Pacific
- 5.1. Market Analysis, Insights and Forecast - by Type
- 6. North America Computed Tomography Market in Spain Analysis, Insights and Forecast, 2019-2031
- 6.1. Market Analysis, Insights and Forecast - by Type
- 6.1.1. Low Slice
- 6.1.2. Medium Slice
- 6.1.3. High Slice
- 6.2. Market Analysis, Insights and Forecast - by Application
- 6.2.1. Oncology
- 6.2.2. Neurology
- 6.2.3. Cardiovascular
- 6.2.4. Musculoskeletal
- 6.2.5. Other Applications
- 6.3. Market Analysis, Insights and Forecast - by End User
- 6.3.1. Hospitals
- 6.3.2. Diagnostic Centers
- 6.3.3. Other End Users
- 6.1. Market Analysis, Insights and Forecast - by Type
- 7. South America Computed Tomography Market in Spain Analysis, Insights and Forecast, 2019-2031
- 7.1. Market Analysis, Insights and Forecast - by Type
- 7.1.1. Low Slice
- 7.1.2. Medium Slice
- 7.1.3. High Slice
- 7.2. Market Analysis, Insights and Forecast - by Application
- 7.2.1. Oncology
- 7.2.2. Neurology
- 7.2.3. Cardiovascular
- 7.2.4. Musculoskeletal
- 7.2.5. Other Applications
- 7.3. Market Analysis, Insights and Forecast - by End User
- 7.3.1. Hospitals
- 7.3.2. Diagnostic Centers
- 7.3.3. Other End Users
- 7.1. Market Analysis, Insights and Forecast - by Type
- 8. Europe Computed Tomography Market in Spain Analysis, Insights and Forecast, 2019-2031
- 8.1. Market Analysis, Insights and Forecast - by Type
- 8.1.1. Low Slice
- 8.1.2. Medium Slice
- 8.1.3. High Slice
- 8.2. Market Analysis, Insights and Forecast - by Application
- 8.2.1. Oncology
- 8.2.2. Neurology
- 8.2.3. Cardiovascular
- 8.2.4. Musculoskeletal
- 8.2.5. Other Applications
- 8.3. Market Analysis, Insights and Forecast - by End User
- 8.3.1. Hospitals
- 8.3.2. Diagnostic Centers
- 8.3.3. Other End Users
- 8.1. Market Analysis, Insights and Forecast - by Type
- 9. Middle East & Africa Computed Tomography Market in Spain Analysis, Insights and Forecast, 2019-2031
- 9.1. Market Analysis, Insights and Forecast - by Type
- 9.1.1. Low Slice
- 9.1.2. Medium Slice
- 9.1.3. High Slice
- 9.2. Market Analysis, Insights and Forecast - by Application
- 9.2.1. Oncology
- 9.2.2. Neurology
- 9.2.3. Cardiovascular
- 9.2.4. Musculoskeletal
- 9.2.5. Other Applications
- 9.3. Market Analysis, Insights and Forecast - by End User
- 9.3.1. Hospitals
- 9.3.2. Diagnostic Centers
- 9.3.3. Other End Users
- 9.1. Market Analysis, Insights and Forecast - by Type
- 10. Asia Pacific Computed Tomography Market in Spain Analysis, Insights and Forecast, 2019-2031
- 10.1. Market Analysis, Insights and Forecast - by Type
- 10.1.1. Low Slice
- 10.1.2. Medium Slice
- 10.1.3. High Slice
- 10.2. Market Analysis, Insights and Forecast - by Application
- 10.2.1. Oncology
- 10.2.2. Neurology
- 10.2.3. Cardiovascular
- 10.2.4. Musculoskeletal
- 10.2.5. Other Applications
- 10.3. Market Analysis, Insights and Forecast - by End User
- 10.3.1. Hospitals
- 10.3.2. Diagnostic Centers
- 10.3.3. Other End Users
- 10.1. Market Analysis, Insights and Forecast - by Type
- 11. Competitive Analysis
- 11.1. Global Market Share Analysis 2024
- 11.2. Company Profiles
- 11.2.1 CareStream Health
- 11.2.1.1. Overview
- 11.2.1.2. Products
- 11.2.1.3. SWOT Analysis
- 11.2.1.4. Recent Developments
- 11.2.1.5. Financials (Based on Availability)
- 11.2.2 Siemens Healthineers
- 11.2.2.1. Overview
- 11.2.2.2. Products
- 11.2.2.3. SWOT Analysis
- 11.2.2.4. Recent Developments
- 11.2.2.5. Financials (Based on Availability)
- 11.2.3 GE Healthcare
- 11.2.3.1. Overview
- 11.2.3.2. Products
- 11.2.3.3. SWOT Analysis
- 11.2.3.4. Recent Developments
- 11.2.3.5. Financials (Based on Availability)
- 11.2.4 Samsung Electronics Co Ltd (Samsung Medison)
- 11.2.4.1. Overview
- 11.2.4.2. Products
- 11.2.4.3. SWOT Analysis
- 11.2.4.4. Recent Developments
- 11.2.4.5. Financials (Based on Availability)
- 11.2.5 Koninklijke Philips NV
- 11.2.5.1. Overview
- 11.2.5.2. Products
- 11.2.5.3. SWOT Analysis
- 11.2.5.4. Recent Developments
- 11.2.5.5. Financials (Based on Availability)
- 11.2.6 Canon Medical Systems Corporation
- 11.2.6.1. Overview
- 11.2.6.2. Products
- 11.2.6.3. SWOT Analysis
- 11.2.6.4. Recent Developments
- 11.2.6.5. Financials (Based on Availability)
- 11.2.7 Planmed Oy
- 11.2.7.1. Overview
- 11.2.7.2. Products
- 11.2.7.3. SWOT Analysis
- 11.2.7.4. Recent Developments
- 11.2.7.5. Financials (Based on Availability)
- 11.2.8 Fujifilm Holdings Corporation
- 11.2.8.1. Overview
- 11.2.8.2. Products
- 11.2.8.3. SWOT Analysis
- 11.2.8.4. Recent Developments
- 11.2.8.5. Financials (Based on Availability)
- 11.2.1 CareStream Health
List of Figures
- Figure 1: Global Computed Tomography Market in Spain Revenue Breakdown (Million, %) by Region 2024 & 2032
- Figure 2: Spain Computed Tomography Market in Spain Revenue (Million), by Country 2024 & 2032
- Figure 3: Spain Computed Tomography Market in Spain Revenue Share (%), by Country 2024 & 2032
- Figure 4: North America Computed Tomography Market in Spain Revenue (Million), by Type 2024 & 2032
- Figure 5: North America Computed Tomography Market in Spain Revenue Share (%), by Type 2024 & 2032
- Figure 6: North America Computed Tomography Market in Spain Revenue (Million), by Application 2024 & 2032
- Figure 7: North America Computed Tomography Market in Spain Revenue Share (%), by Application 2024 & 2032
- Figure 8: North America Computed Tomography Market in Spain Revenue (Million), by End User 2024 & 2032
- Figure 9: North America Computed Tomography Market in Spain Revenue Share (%), by End User 2024 & 2032
- Figure 10: North America Computed Tomography Market in Spain Revenue (Million), by Country 2024 & 2032
- Figure 11: North America Computed Tomography Market in Spain Revenue Share (%), by Country 2024 & 2032
- Figure 12: South America Computed Tomography Market in Spain Revenue (Million), by Type 2024 & 2032
- Figure 13: South America Computed Tomography Market in Spain Revenue Share (%), by Type 2024 & 2032
- Figure 14: South America Computed Tomography Market in Spain Revenue (Million), by Application 2024 & 2032
- Figure 15: South America Computed Tomography Market in Spain Revenue Share (%), by Application 2024 & 2032
- Figure 16: South America Computed Tomography Market in Spain Revenue (Million), by End User 2024 & 2032
- Figure 17: South America Computed Tomography Market in Spain Revenue Share (%), by End User 2024 & 2032
- Figure 18: South America Computed Tomography Market in Spain Revenue (Million), by Country 2024 & 2032
- Figure 19: South America Computed Tomography Market in Spain Revenue Share (%), by Country 2024 & 2032
- Figure 20: Europe Computed Tomography Market in Spain Revenue (Million), by Type 2024 & 2032
- Figure 21: Europe Computed Tomography Market in Spain Revenue Share (%), by Type 2024 & 2032
- Figure 22: Europe Computed Tomography Market in Spain Revenue (Million), by Application 2024 & 2032
- Figure 23: Europe Computed Tomography Market in Spain Revenue Share (%), by Application 2024 & 2032
- Figure 24: Europe Computed Tomography Market in Spain Revenue (Million), by End User 2024 & 2032
- Figure 25: Europe Computed Tomography Market in Spain Revenue Share (%), by End User 2024 & 2032
- Figure 26: Europe Computed Tomography Market in Spain Revenue (Million), by Country 2024 & 2032
- Figure 27: Europe Computed Tomography Market in Spain Revenue Share (%), by Country 2024 & 2032
- Figure 28: Middle East & Africa Computed Tomography Market in Spain Revenue (Million), by Type 2024 & 2032
- Figure 29: Middle East & Africa Computed Tomography Market in Spain Revenue Share (%), by Type 2024 & 2032
- Figure 30: Middle East & Africa Computed Tomography Market in Spain Revenue (Million), by Application 2024 & 2032
- Figure 31: Middle East & Africa Computed Tomography Market in Spain Revenue Share (%), by Application 2024 & 2032
- Figure 32: Middle East & Africa Computed Tomography Market in Spain Revenue (Million), by End User 2024 & 2032
- Figure 33: Middle East & Africa Computed Tomography Market in Spain Revenue Share (%), by End User 2024 & 2032
- Figure 34: Middle East & Africa Computed Tomography Market in Spain Revenue (Million), by Country 2024 & 2032
- Figure 35: Middle East & Africa Computed Tomography Market in Spain Revenue Share (%), by Country 2024 & 2032
- Figure 36: Asia Pacific Computed Tomography Market in Spain Revenue (Million), by Type 2024 & 2032
- Figure 37: Asia Pacific Computed Tomography Market in Spain Revenue Share (%), by Type 2024 & 2032
- Figure 38: Asia Pacific Computed Tomography Market in Spain Revenue (Million), by Application 2024 & 2032
- Figure 39: Asia Pacific Computed Tomography Market in Spain Revenue Share (%), by Application 2024 & 2032
- Figure 40: Asia Pacific Computed Tomography Market in Spain Revenue (Million), by End User 2024 & 2032
- Figure 41: Asia Pacific Computed Tomography Market in Spain Revenue Share (%), by End User 2024 & 2032
- Figure 42: Asia Pacific Computed Tomography Market in Spain Revenue (Million), by Country 2024 & 2032
- Figure 43: Asia Pacific Computed Tomography Market in Spain Revenue Share (%), by Country 2024 & 2032
List of Tables
- Table 1: Global Computed Tomography Market in Spain Revenue Million Forecast, by Region 2019 & 2032
- Table 2: Global Computed Tomography Market in Spain Revenue Million Forecast, by Type 2019 & 2032
- Table 3: Global Computed Tomography Market in Spain Revenue Million Forecast, by Application 2019 & 2032
- Table 4: Global Computed Tomography Market in Spain Revenue Million Forecast, by End User 2019 & 2032
- Table 5: Global Computed Tomography Market in Spain Revenue Million Forecast, by Region 2019 & 2032
- Table 6: Global Computed Tomography Market in Spain Revenue Million Forecast, by Country 2019 & 2032
- Table 7: Global Computed Tomography Market in Spain Revenue Million Forecast, by Type 2019 & 2032
- Table 8: Global Computed Tomography Market in Spain Revenue Million Forecast, by Application 2019 & 2032
- Table 9: Global Computed Tomography Market in Spain Revenue Million Forecast, by End User 2019 & 2032
- Table 10: Global Computed Tomography Market in Spain Revenue Million Forecast, by Country 2019 & 2032
- Table 11: United States Computed Tomography Market in Spain Revenue (Million) Forecast, by Application 2019 & 2032
- Table 12: Canada Computed Tomography Market in Spain Revenue (Million) Forecast, by Application 2019 & 2032
- Table 13: Mexico Computed Tomography Market in Spain Revenue (Million) Forecast, by Application 2019 & 2032
- Table 14: Global Computed Tomography Market in Spain Revenue Million Forecast, by Type 2019 & 2032
- Table 15: Global Computed Tomography Market in Spain Revenue Million Forecast, by Application 2019 & 2032
- Table 16: Global Computed Tomography Market in Spain Revenue Million Forecast, by End User 2019 & 2032
- Table 17: Global Computed Tomography Market in Spain Revenue Million Forecast, by Country 2019 & 2032
- Table 18: Brazil Computed Tomography Market in Spain Revenue (Million) Forecast, by Application 2019 & 2032
- Table 19: Argentina Computed Tomography Market in Spain Revenue (Million) Forecast, by Application 2019 & 2032
- Table 20: Rest of South America Computed Tomography Market in Spain Revenue (Million) Forecast, by Application 2019 & 2032
- Table 21: Global Computed Tomography Market in Spain Revenue Million Forecast, by Type 2019 & 2032
- Table 22: Global Computed Tomography Market in Spain Revenue Million Forecast, by Application 2019 & 2032
- Table 23: Global Computed Tomography Market in Spain Revenue Million Forecast, by End User 2019 & 2032
- Table 24: Global Computed Tomography Market in Spain Revenue Million Forecast, by Country 2019 & 2032
- Table 25: United Kingdom Computed Tomography Market in Spain Revenue (Million) Forecast, by Application 2019 & 2032
- Table 26: Germany Computed Tomography Market in Spain Revenue (Million) Forecast, by Application 2019 & 2032
- Table 27: France Computed Tomography Market in Spain Revenue (Million) Forecast, by Application 2019 & 2032
- Table 28: Italy Computed Tomography Market in Spain Revenue (Million) Forecast, by Application 2019 & 2032
- Table 29: Spain Computed Tomography Market in Spain Revenue (Million) Forecast, by Application 2019 & 2032
- Table 30: Russia Computed Tomography Market in Spain Revenue (Million) Forecast, by Application 2019 & 2032
- Table 31: Benelux Computed Tomography Market in Spain Revenue (Million) Forecast, by Application 2019 & 2032
- Table 32: Nordics Computed Tomography Market in Spain Revenue (Million) Forecast, by Application 2019 & 2032
- Table 33: Rest of Europe Computed Tomography Market in Spain Revenue (Million) Forecast, by Application 2019 & 2032
- Table 34: Global Computed Tomography Market in Spain Revenue Million Forecast, by Type 2019 & 2032
- Table 35: Global Computed Tomography Market in Spain Revenue Million Forecast, by Application 2019 & 2032
- Table 36: Global Computed Tomography Market in Spain Revenue Million Forecast, by End User 2019 & 2032
- Table 37: Global Computed Tomography Market in Spain Revenue Million Forecast, by Country 2019 & 2032
- Table 38: Turkey Computed Tomography Market in Spain Revenue (Million) Forecast, by Application 2019 & 2032
- Table 39: Israel Computed Tomography Market in Spain Revenue (Million) Forecast, by Application 2019 & 2032
- Table 40: GCC Computed Tomography Market in Spain Revenue (Million) Forecast, by Application 2019 & 2032
- Table 41: North Africa Computed Tomography Market in Spain Revenue (Million) Forecast, by Application 2019 & 2032
- Table 42: South Africa Computed Tomography Market in Spain Revenue (Million) Forecast, by Application 2019 & 2032
- Table 43: Rest of Middle East & Africa Computed Tomography Market in Spain Revenue (Million) Forecast, by Application 2019 & 2032
- Table 44: Global Computed Tomography Market in Spain Revenue Million Forecast, by Type 2019 & 2032
- Table 45: Global Computed Tomography Market in Spain Revenue Million Forecast, by Application 2019 & 2032
- Table 46: Global Computed Tomography Market in Spain Revenue Million Forecast, by End User 2019 & 2032
- Table 47: Global Computed Tomography Market in Spain Revenue Million Forecast, by Country 2019 & 2032
- Table 48: China Computed Tomography Market in Spain Revenue (Million) Forecast, by Application 2019 & 2032
- Table 49: India Computed Tomography Market in Spain Revenue (Million) Forecast, by Application 2019 & 2032
- Table 50: Japan Computed Tomography Market in Spain Revenue (Million) Forecast, by Application 2019 & 2032
- Table 51: South Korea Computed Tomography Market in Spain Revenue (Million) Forecast, by Application 2019 & 2032
- Table 52: ASEAN Computed Tomography Market in Spain Revenue (Million) Forecast, by Application 2019 & 2032
- Table 53: Oceania Computed Tomography Market in Spain Revenue (Million) Forecast, by Application 2019 & 2032
- Table 54: Rest of Asia Pacific Computed Tomography Market in Spain Revenue (Million) Forecast, by Application 2019 & 2032
Frequently Asked Questions
1. What is the projected Compound Annual Growth Rate (CAGR) of the Computed Tomography Market in Spain?
The projected CAGR is approximately 5.50%.
2. Which companies are prominent players in the Computed Tomography Market in Spain?
Key companies in the market include CareStream Health, Siemens Healthineers, GE Healthcare, Samsung Electronics Co Ltd (Samsung Medison), Koninklijke Philips NV, Canon Medical Systems Corporation, Planmed Oy, Fujifilm Holdings Corporation.
3. What are the main segments of the Computed Tomography Market in Spain?
The market segments include Type, Application, End User.
4. Can you provide details about the market size?
The market size is estimated to be USD 201.59 Million as of 2022.
5. What are some drivers contributing to market growth?
Increasing Geriatric Population and Chronic Disease Burden; Technological Advancements in Computed Tomography.
6. What are the notable trends driving market growth?
Oncology is Expected to Dominate the Application Segment.
7. Are there any restraints impacting market growth?
High Cost Associated With CT Scan Procedure and Equipment.
8. Can you provide examples of recent developments in the market?
In November 2021, Siemens Healthineers launched the NAEOTOM Alpha, the world's first photon-counting CT scanner. The system is cleared for clinical use in the United States and Europe.
9. What pricing options are available for accessing the report?
Pricing options include single-user, multi-user, and enterprise licenses priced at USD 3800, USD 4500, and USD 5800 respectively.
10. Is the market size provided in terms of value or volume?
The market size is provided in terms of value, measured in Million.
11. Are there any specific market keywords associated with the report?
Yes, the market keyword associated with the report is "Computed Tomography Market in Spain," which aids in identifying and referencing the specific market segment covered.
12. How do I determine which pricing option suits my needs best?
The pricing options vary based on user requirements and access needs. Individual users may opt for single-user licenses, while businesses requiring broader access may choose multi-user or enterprise licenses for cost-effective access to the report.
13. Are there any additional resources or data provided in the Computed Tomography Market in Spain report?
While the report offers comprehensive insights, it's advisable to review the specific contents or supplementary materials provided to ascertain if additional resources or data are available.
14. How can I stay updated on further developments or reports in the Computed Tomography Market in Spain?
To stay informed about further developments, trends, and reports in the Computed Tomography Market in Spain, consider subscribing to industry newsletters, following relevant companies and organizations, or regularly checking reputable industry news sources and publications.
Methodology
Step 1 - Identification of Relevant Samples Size from Population Database


Step 2 - Approaches for Defining Global Market Size (Value, Volume* & Price*)

Note*: In applicable scenarios
Step 3 - Data Sources
Primary Research
- Web Analytics
- Survey Reports
- Research Institute
- Latest Research Reports
- Opinion Leaders
Secondary Research
- Annual Reports
- White Paper
- Latest Press Release
- Industry Association
- Paid Database
- Investor Presentations

Step 4 - Data Triangulation
Involves using different sources of information in order to increase the validity of a study
These sources are likely to be stakeholders in a program - participants, other researchers, program staff, other community members, and so on.
Then we put all data in single framework & apply various statistical tools to find out the dynamic on the market.
During the analysis stage, feedback from the stakeholder groups would be compared to determine areas of agreement as well as areas of divergence


