
Key Insights
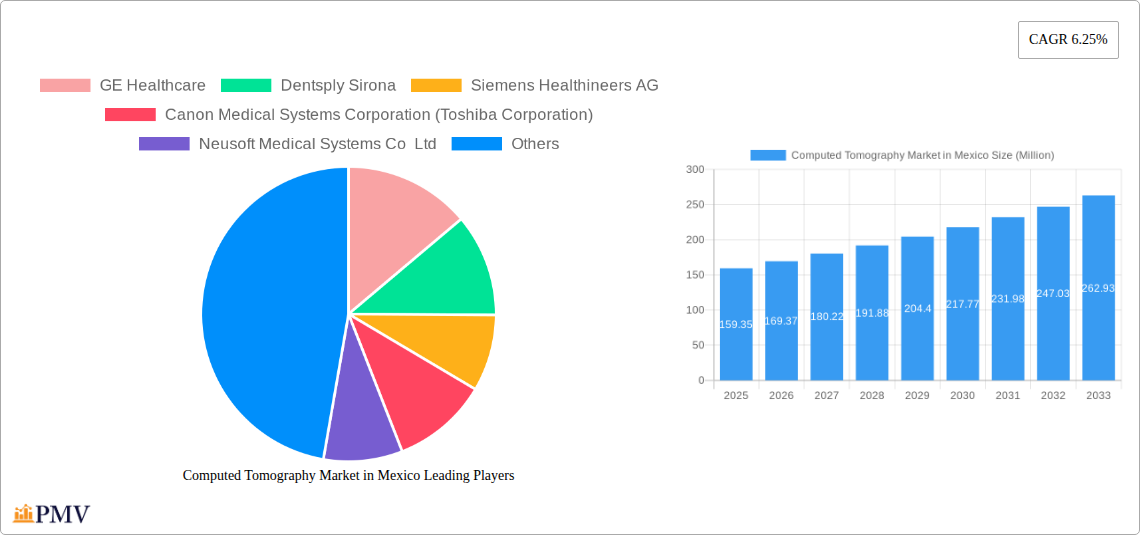
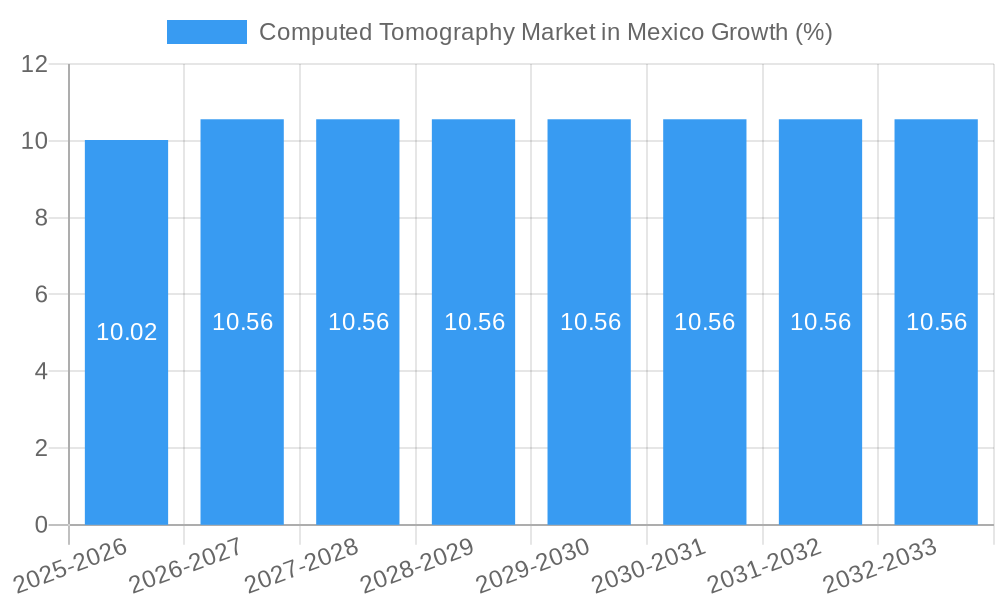
The Mexican Computed Tomography (CT) market, valued at $159.35 million in 2025, is projected to experience robust growth, driven by a rising prevalence of chronic diseases like cardiovascular ailments and cancer, an aging population necessitating more diagnostic procedures, and increasing healthcare infrastructure investments. The market's Compound Annual Growth Rate (CAGR) of 6.25% from 2019 to 2024 suggests a continued upward trajectory through 2033. This growth is further fueled by technological advancements in CT scanners, leading to faster scan times, improved image quality, and reduced radiation exposure. The market is segmented by slice count (low, medium, high), application (oncology, neurology, cardiovascular, musculoskeletal, other), and end-user (hospitals, diagnostic centers, other). The high slice CT segment is expected to dominate due to its superior imaging capabilities, while oncology and cardiology applications are likely to drive substantial demand. Hospitals currently hold the largest market share among end-users, reflecting their crucial role in providing advanced diagnostic services. However, the growth of private diagnostic centers is expected to contribute significantly to market expansion in the coming years. Competition among key players like GE Healthcare, Siemens Healthineers, and Canon Medical Systems, coupled with the entry of new players, is anticipated to intensify, driving innovation and potentially lowering prices.
The market's growth, however, might face some challenges. These include the high cost of CT scanners and associated maintenance, potential regulatory hurdles, and the need for skilled radiologists to interpret the complex images generated by these advanced machines. Despite these restraints, the long-term outlook for the Mexican CT market remains positive, fueled by the increasing affordability of healthcare, growing awareness of the importance of early diagnosis, and the government's ongoing investments in healthcare infrastructure. The market's evolution will be strongly influenced by government policies related to medical technology adoption and reimbursement mechanisms. The increasing demand for specialized CT scans, such as cardiac CT and multi-detector CT, also represents a significant growth opportunity.
This detailed report provides a comprehensive analysis of the Computed Tomography (CT) market in Mexico, covering the period from 2019 to 2033. It offers in-depth insights into market dynamics, competitive landscape, growth drivers, and challenges, providing valuable intelligence for stakeholders across the healthcare industry. The report segments the market by slice type (Low, Medium, High), application (Oncology, Neurology, Cardiovascular, Musculoskeletal, Other), and end-user (Hospitals, Diagnostic Centers, Other). With a base year of 2025 and an estimated year of 2025, the forecast period extends from 2025 to 2033, offering a long-term perspective on market trends. The total market size in 2025 is estimated at xx Million.
Computed Tomography Market in Mexico Market Structure & Competitive Dynamics
The Mexican CT market exhibits a moderately concentrated structure, with key players like GE Healthcare, Siemens Healthineers AG, and Philips holding significant market share. The market is characterized by an evolving innovation ecosystem, driven by technological advancements in image resolution, speed, and AI-powered diagnostic tools. Regulatory frameworks, primarily overseen by COFEPRIS (Comisión Federal para la Protección contra Riesgos Sanitarios), influence market access and product approvals. Substitute technologies, such as MRI and ultrasound, present competitive pressures. End-user trends reveal a growing demand for advanced CT systems in specialized applications like oncology and cardiology, particularly within private hospitals and diagnostic centers. M&A activity has been relatively limited in recent years, with deal values estimated at xx Million annually, primarily focused on distribution partnerships and technology licensing. Major players are also strategically focusing on expanding their service offerings and building strong partnerships to enhance their reach and market penetration. This competitive environment drives innovation and ensures the availability of cutting-edge CT technology in Mexico's healthcare sector. Market share data for key players in 2025 is predicted to be as follows: GE Healthcare (xx%), Siemens Healthineers AG (xx%), Philips (xx%), and others (xx%).
Computed Tomography Market in Mexico Industry Trends & Insights
The Mexican CT market is experiencing robust growth, driven by factors such as rising prevalence of chronic diseases, increasing healthcare expenditure, and government initiatives to improve healthcare infrastructure. The Compound Annual Growth Rate (CAGR) during the forecast period (2025-2033) is projected to be xx%. This growth is further fueled by technological advancements, including the integration of AI and machine learning for improved diagnostic accuracy and efficiency. Consumer preferences are shifting towards advanced features such as faster scan times, higher image resolution, and lower radiation doses. The market penetration rate of CT scanners in Mexico is increasing steadily, though it still lags behind developed nations. The competitive dynamics remain intense, with leading players focusing on product innovation, strategic partnerships, and service enhancements to maintain their market position. The demand for high-end CT systems is increasing significantly in urban areas, while rural areas demonstrate slower growth due to infrastructure limitations. Market trends suggest a continuous increase in the adoption of multi-slice CT systems in specialized applications like cardiovascular and oncology.
Dominant Markets & Segments in Computed Tomography Market in Mexico
Leading Segment: The high-slice CT segment dominates the market due to its superior image quality and diagnostic capabilities, particularly relevant for complex procedures.
Key Application: Oncology and cardiology applications constitute major market segments due to the increasing prevalence of related diseases and the demand for precise diagnostics.
Dominant End-User: Private hospitals and diagnostic centers represent the largest end-user segment due to higher investment capacity and adoption of advanced technologies.
Key Drivers for Segment Dominance:
- Technological Advancements: The introduction of advanced features such as iterative reconstruction techniques and AI-powered image analysis enhances diagnostic capabilities.
- Government Initiatives: Government funding for healthcare infrastructure and initiatives aimed at improving healthcare access boost market growth.
- Economic Growth: Increasing disposable incomes and the expansion of private healthcare providers drive demand for high-quality CT systems.
The high-slice CT segment's dominance is further solidified by the increasing prevalence of complex diseases requiring advanced diagnostic imaging. Similarly, the concentration of specialized healthcare facilities and higher disposable incomes in urban areas contribute to the dominance of these end-users.
Computed Tomography Market in Mexico Product Innovations
Recent innovations in the Mexican CT market focus on improving image quality, reducing scan times, and lowering radiation doses. Manufacturers are incorporating advanced technologies like iterative reconstruction, AI-powered image analysis, and advanced detectors. This leads to improved diagnostic accuracy, enhanced workflow efficiency, and a more comfortable patient experience. These technological advancements are tailored to meet the specific needs of the Mexican healthcare system, which prioritizes cost-effectiveness and accessibility, ultimately improving market fit and competitive advantages for providers.
Report Segmentation & Scope
This report segments the Computed Tomography market in Mexico based on slice type (Low Slice, Medium Slice, High Slice), application (Oncology, Neurology, Cardiovascular, Musculoskeletal, Other Applications), and end-user (Hospitals, Diagnostic Centers, Other End Users). Each segment's growth projection, market size, and competitive dynamics are analyzed within the report. Growth projections vary among segments, reflecting differences in technological advancements, clinical adoption rates, and regulatory landscape. The market size for each segment is detailed in the report.
Key Drivers of Computed Tomography Market in Mexico Growth
The growth of the CT market in Mexico is driven by several key factors. These include: the rising prevalence of chronic diseases necessitating advanced diagnostic tools; increasing government investment in healthcare infrastructure and improving healthcare access; the growing adoption of advanced imaging technologies by private hospitals and diagnostic centers; technological advancements in CT scanner technology leading to better image quality, faster scan times, and lower radiation doses; and the growing awareness among patients and physicians about the importance of early detection and diagnosis of various diseases.
Challenges in the Computed Tomography Market in Mexico Sector
Challenges facing the Mexican CT market include the relatively high cost of advanced CT scanners limiting accessibility, especially in rural areas; the need for trained personnel to operate and interpret CT scans, leading to a skills gap; the complexities of regulatory approvals and reimbursement policies for new technologies creating barriers to market entry; and the competition from alternative imaging modalities like MRI and ultrasound impacting market share for CT systems. The estimated annual impact of these challenges on market growth is approximately xx Million.
Leading Players in the Computed Tomography Market in Mexico Market
- GE Healthcare
- Dentsply Sirona
- Siemens Healthineers AG
- Canon Medical Systems Corporation (Toshiba Corporation)
- Neusoft Medical Systems Co Ltd
- Carestream Health
- Vatech Inc
- Koninklijke Philips NV
- J Morita Corporation
- Planmeca Group (Planmed OY)
- Samsung Electronics Co Ltd (Samsung Medison)
Key Developments in Computed Tomography Market in Mexico Sector
- September 2020: Nanox and SPI Medical announced an exclusive distribution agreement for 630 Nanox.ARC devices in Mexico, significantly impacting market accessibility.
- February 2020: A study published in the American Journal of Medicine highlighted the crucial role of CT scans in detecting early markers of cardiovascular disease, boosting demand.
Strategic Computed Tomography Market in Mexico Market Outlook
The future of the Mexican CT market is bright, driven by sustained growth in healthcare spending, technological advancements, and increasing disease prevalence. Strategic opportunities exist for companies focusing on affordable, high-quality CT solutions targeted at underserved communities. Partnerships with government agencies and private healthcare providers will be crucial for market penetration and long-term success. The market is expected to see a continued rise in adoption of AI-powered diagnostic tools, further improving efficiency and accuracy. Focusing on training and education initiatives to address the skills gap will be paramount for sustainable growth.
Computed Tomography Market in Mexico Segmentation
-
1. Type
- 1.1. Low Slice
- 1.2. Medium Slice
- 1.3. High Slice
-
2. Application
- 2.1. Oncology
- 2.2. Neurology
- 2.3. Cardiovascular
- 2.4. Musculoskeletal
- 2.5. Other Applications
-
3. End User
- 3.1. Hospitals
- 3.2. Diagnostic Centers
- 3.3. Other End Users
Computed Tomography Market in Mexico Segmentation By Geography
-
1. North America
- 1.1. United States
- 1.2. Canada
- 1.3. Mexico
-
2. South America
- 2.1. Brazil
- 2.2. Argentina
- 2.3. Rest of South America
-
3. Europe
- 3.1. United Kingdom
- 3.2. Germany
- 3.3. France
- 3.4. Italy
- 3.5. Spain
- 3.6. Russia
- 3.7. Benelux
- 3.8. Nordics
- 3.9. Rest of Europe
-
4. Middle East & Africa
- 4.1. Turkey
- 4.2. Israel
- 4.3. GCC
- 4.4. North Africa
- 4.5. South Africa
- 4.6. Rest of Middle East & Africa
-
5. Asia Pacific
- 5.1. China
- 5.2. India
- 5.3. Japan
- 5.4. South Korea
- 5.5. ASEAN
- 5.6. Oceania
- 5.7. Rest of Asia Pacific
Computed Tomography Market in Mexico REPORT HIGHLIGHTS
| Aspects | Details |
|---|---|
| Study Period | 2019-2033 |
| Base Year | 2024 |
| Estimated Year | 2025 |
| Forecast Period | 2025-2033 |
| Historical Period | 2019-2024 |
| Growth Rate | CAGR of 6.25% from 2019-2033 |
| Segmentation |
|
Table of Contents
- 1. Introduction
- 1.1. Research Scope
- 1.2. Market Segmentation
- 1.3. Research Methodology
- 1.4. Definitions and Assumptions
- 2. Executive Summary
- 2.1. Introduction
- 3. Market Dynamics
- 3.1. Introduction
- 3.2. Market Drivers
- 3.2.1. Increasing Prevalence of Chronic Diseases; Rising Geriatric Population; Increasing Technological Advancements
- 3.3. Market Restrains
- 3.3.1. Lack Of Proper Reimbursement And Stringent Regulatory Approval Procedures; High Cost of Equipment
- 3.4. Market Trends
- 3.4.1. Oncology Segment is Expected to Hold a Significant Market Share Over the Forecast Period
- 4. Market Factor Analysis
- 4.1. Porters Five Forces
- 4.2. Supply/Value Chain
- 4.3. PESTEL analysis
- 4.4. Market Entropy
- 4.5. Patent/Trademark Analysis
- 5. Global Computed Tomography Market in Mexico Analysis, Insights and Forecast, 2019-2031
- 5.1. Market Analysis, Insights and Forecast - by Type
- 5.1.1. Low Slice
- 5.1.2. Medium Slice
- 5.1.3. High Slice
- 5.2. Market Analysis, Insights and Forecast - by Application
- 5.2.1. Oncology
- 5.2.2. Neurology
- 5.2.3. Cardiovascular
- 5.2.4. Musculoskeletal
- 5.2.5. Other Applications
- 5.3. Market Analysis, Insights and Forecast - by End User
- 5.3.1. Hospitals
- 5.3.2. Diagnostic Centers
- 5.3.3. Other End Users
- 5.4. Market Analysis, Insights and Forecast - by Region
- 5.4.1. North America
- 5.4.2. South America
- 5.4.3. Europe
- 5.4.4. Middle East & Africa
- 5.4.5. Asia Pacific
- 5.1. Market Analysis, Insights and Forecast - by Type
- 6. North America Computed Tomography Market in Mexico Analysis, Insights and Forecast, 2019-2031
- 6.1. Market Analysis, Insights and Forecast - by Type
- 6.1.1. Low Slice
- 6.1.2. Medium Slice
- 6.1.3. High Slice
- 6.2. Market Analysis, Insights and Forecast - by Application
- 6.2.1. Oncology
- 6.2.2. Neurology
- 6.2.3. Cardiovascular
- 6.2.4. Musculoskeletal
- 6.2.5. Other Applications
- 6.3. Market Analysis, Insights and Forecast - by End User
- 6.3.1. Hospitals
- 6.3.2. Diagnostic Centers
- 6.3.3. Other End Users
- 6.1. Market Analysis, Insights and Forecast - by Type
- 7. South America Computed Tomography Market in Mexico Analysis, Insights and Forecast, 2019-2031
- 7.1. Market Analysis, Insights and Forecast - by Type
- 7.1.1. Low Slice
- 7.1.2. Medium Slice
- 7.1.3. High Slice
- 7.2. Market Analysis, Insights and Forecast - by Application
- 7.2.1. Oncology
- 7.2.2. Neurology
- 7.2.3. Cardiovascular
- 7.2.4. Musculoskeletal
- 7.2.5. Other Applications
- 7.3. Market Analysis, Insights and Forecast - by End User
- 7.3.1. Hospitals
- 7.3.2. Diagnostic Centers
- 7.3.3. Other End Users
- 7.1. Market Analysis, Insights and Forecast - by Type
- 8. Europe Computed Tomography Market in Mexico Analysis, Insights and Forecast, 2019-2031
- 8.1. Market Analysis, Insights and Forecast - by Type
- 8.1.1. Low Slice
- 8.1.2. Medium Slice
- 8.1.3. High Slice
- 8.2. Market Analysis, Insights and Forecast - by Application
- 8.2.1. Oncology
- 8.2.2. Neurology
- 8.2.3. Cardiovascular
- 8.2.4. Musculoskeletal
- 8.2.5. Other Applications
- 8.3. Market Analysis, Insights and Forecast - by End User
- 8.3.1. Hospitals
- 8.3.2. Diagnostic Centers
- 8.3.3. Other End Users
- 8.1. Market Analysis, Insights and Forecast - by Type
- 9. Middle East & Africa Computed Tomography Market in Mexico Analysis, Insights and Forecast, 2019-2031
- 9.1. Market Analysis, Insights and Forecast - by Type
- 9.1.1. Low Slice
- 9.1.2. Medium Slice
- 9.1.3. High Slice
- 9.2. Market Analysis, Insights and Forecast - by Application
- 9.2.1. Oncology
- 9.2.2. Neurology
- 9.2.3. Cardiovascular
- 9.2.4. Musculoskeletal
- 9.2.5. Other Applications
- 9.3. Market Analysis, Insights and Forecast - by End User
- 9.3.1. Hospitals
- 9.3.2. Diagnostic Centers
- 9.3.3. Other End Users
- 9.1. Market Analysis, Insights and Forecast - by Type
- 10. Asia Pacific Computed Tomography Market in Mexico Analysis, Insights and Forecast, 2019-2031
- 10.1. Market Analysis, Insights and Forecast - by Type
- 10.1.1. Low Slice
- 10.1.2. Medium Slice
- 10.1.3. High Slice
- 10.2. Market Analysis, Insights and Forecast - by Application
- 10.2.1. Oncology
- 10.2.2. Neurology
- 10.2.3. Cardiovascular
- 10.2.4. Musculoskeletal
- 10.2.5. Other Applications
- 10.3. Market Analysis, Insights and Forecast - by End User
- 10.3.1. Hospitals
- 10.3.2. Diagnostic Centers
- 10.3.3. Other End Users
- 10.1. Market Analysis, Insights and Forecast - by Type
- 11. Competitive Analysis
- 11.1. Global Market Share Analysis 2024
- 11.2. Company Profiles
- 11.2.1 GE Healthcare
- 11.2.1.1. Overview
- 11.2.1.2. Products
- 11.2.1.3. SWOT Analysis
- 11.2.1.4. Recent Developments
- 11.2.1.5. Financials (Based on Availability)
- 11.2.2 Dentsply Sirona
- 11.2.2.1. Overview
- 11.2.2.2. Products
- 11.2.2.3. SWOT Analysis
- 11.2.2.4. Recent Developments
- 11.2.2.5. Financials (Based on Availability)
- 11.2.3 Siemens Healthineers AG
- 11.2.3.1. Overview
- 11.2.3.2. Products
- 11.2.3.3. SWOT Analysis
- 11.2.3.4. Recent Developments
- 11.2.3.5. Financials (Based on Availability)
- 11.2.4 Canon Medical Systems Corporation (Toshiba Corporation)
- 11.2.4.1. Overview
- 11.2.4.2. Products
- 11.2.4.3. SWOT Analysis
- 11.2.4.4. Recent Developments
- 11.2.4.5. Financials (Based on Availability)
- 11.2.5 Neusoft Medical Systems Co Ltd
- 11.2.5.1. Overview
- 11.2.5.2. Products
- 11.2.5.3. SWOT Analysis
- 11.2.5.4. Recent Developments
- 11.2.5.5. Financials (Based on Availability)
- 11.2.6 Carestream Health
- 11.2.6.1. Overview
- 11.2.6.2. Products
- 11.2.6.3. SWOT Analysis
- 11.2.6.4. Recent Developments
- 11.2.6.5. Financials (Based on Availability)
- 11.2.7 Vatech Inc
- 11.2.7.1. Overview
- 11.2.7.2. Products
- 11.2.7.3. SWOT Analysis
- 11.2.7.4. Recent Developments
- 11.2.7.5. Financials (Based on Availability)
- 11.2.8 Koninklijke Philips NV
- 11.2.8.1. Overview
- 11.2.8.2. Products
- 11.2.8.3. SWOT Analysis
- 11.2.8.4. Recent Developments
- 11.2.8.5. Financials (Based on Availability)
- 11.2.9 J Morita Corporation
- 11.2.9.1. Overview
- 11.2.9.2. Products
- 11.2.9.3. SWOT Analysis
- 11.2.9.4. Recent Developments
- 11.2.9.5. Financials (Based on Availability)
- 11.2.10 Planmeca Group (Planmed OY)
- 11.2.10.1. Overview
- 11.2.10.2. Products
- 11.2.10.3. SWOT Analysis
- 11.2.10.4. Recent Developments
- 11.2.10.5. Financials (Based on Availability)
- 11.2.11 Samsung Electronics Co Ltd (Samsung Medison)
- 11.2.11.1. Overview
- 11.2.11.2. Products
- 11.2.11.3. SWOT Analysis
- 11.2.11.4. Recent Developments
- 11.2.11.5. Financials (Based on Availability)
- 11.2.1 GE Healthcare
List of Figures
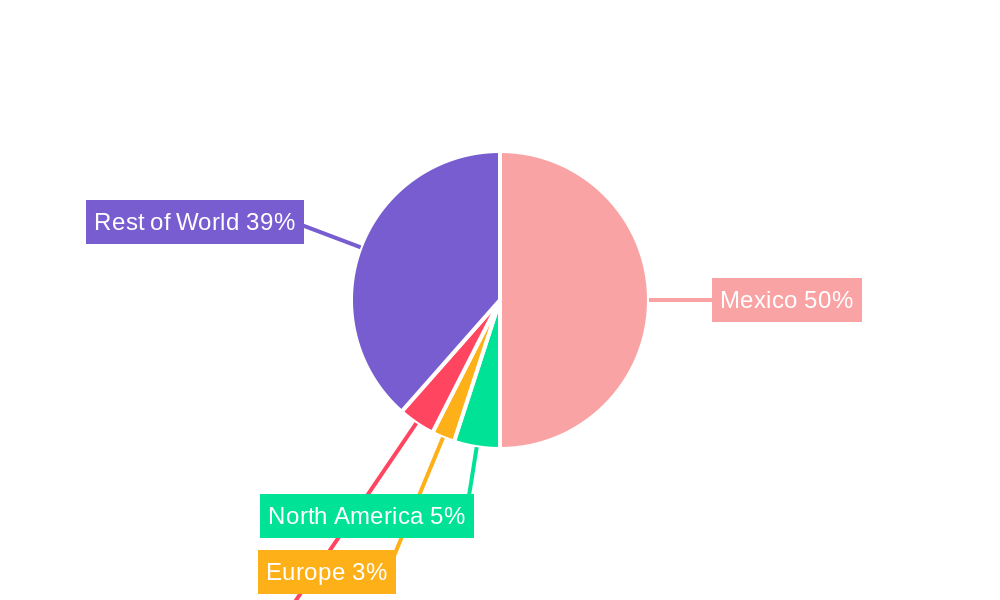
- Figure 1: Global Computed Tomography Market in Mexico Revenue Breakdown (Million, %) by Region 2024 & 2032
- Figure 2: Mexico Computed Tomography Market in Mexico Revenue (Million), by Country 2024 & 2032
- Figure 3: Mexico Computed Tomography Market in Mexico Revenue Share (%), by Country 2024 & 2032
- Figure 4: North America Computed Tomography Market in Mexico Revenue (Million), by Type 2024 & 2032
- Figure 5: North America Computed Tomography Market in Mexico Revenue Share (%), by Type 2024 & 2032
- Figure 6: North America Computed Tomography Market in Mexico Revenue (Million), by Application 2024 & 2032
- Figure 7: North America Computed Tomography Market in Mexico Revenue Share (%), by Application 2024 & 2032
- Figure 8: North America Computed Tomography Market in Mexico Revenue (Million), by End User 2024 & 2032
- Figure 9: North America Computed Tomography Market in Mexico Revenue Share (%), by End User 2024 & 2032
- Figure 10: North America Computed Tomography Market in Mexico Revenue (Million), by Country 2024 & 2032
- Figure 11: North America Computed Tomography Market in Mexico Revenue Share (%), by Country 2024 & 2032
- Figure 12: South America Computed Tomography Market in Mexico Revenue (Million), by Type 2024 & 2032
- Figure 13: South America Computed Tomography Market in Mexico Revenue Share (%), by Type 2024 & 2032
- Figure 14: South America Computed Tomography Market in Mexico Revenue (Million), by Application 2024 & 2032
- Figure 15: South America Computed Tomography Market in Mexico Revenue Share (%), by Application 2024 & 2032
- Figure 16: South America Computed Tomography Market in Mexico Revenue (Million), by End User 2024 & 2032
- Figure 17: South America Computed Tomography Market in Mexico Revenue Share (%), by End User 2024 & 2032
- Figure 18: South America Computed Tomography Market in Mexico Revenue (Million), by Country 2024 & 2032
- Figure 19: South America Computed Tomography Market in Mexico Revenue Share (%), by Country 2024 & 2032
- Figure 20: Europe Computed Tomography Market in Mexico Revenue (Million), by Type 2024 & 2032
- Figure 21: Europe Computed Tomography Market in Mexico Revenue Share (%), by Type 2024 & 2032
- Figure 22: Europe Computed Tomography Market in Mexico Revenue (Million), by Application 2024 & 2032
- Figure 23: Europe Computed Tomography Market in Mexico Revenue Share (%), by Application 2024 & 2032
- Figure 24: Europe Computed Tomography Market in Mexico Revenue (Million), by End User 2024 & 2032
- Figure 25: Europe Computed Tomography Market in Mexico Revenue Share (%), by End User 2024 & 2032
- Figure 26: Europe Computed Tomography Market in Mexico Revenue (Million), by Country 2024 & 2032
- Figure 27: Europe Computed Tomography Market in Mexico Revenue Share (%), by Country 2024 & 2032
- Figure 28: Middle East & Africa Computed Tomography Market in Mexico Revenue (Million), by Type 2024 & 2032
- Figure 29: Middle East & Africa Computed Tomography Market in Mexico Revenue Share (%), by Type 2024 & 2032
- Figure 30: Middle East & Africa Computed Tomography Market in Mexico Revenue (Million), by Application 2024 & 2032
- Figure 31: Middle East & Africa Computed Tomography Market in Mexico Revenue Share (%), by Application 2024 & 2032
- Figure 32: Middle East & Africa Computed Tomography Market in Mexico Revenue (Million), by End User 2024 & 2032
- Figure 33: Middle East & Africa Computed Tomography Market in Mexico Revenue Share (%), by End User 2024 & 2032
- Figure 34: Middle East & Africa Computed Tomography Market in Mexico Revenue (Million), by Country 2024 & 2032
- Figure 35: Middle East & Africa Computed Tomography Market in Mexico Revenue Share (%), by Country 2024 & 2032
- Figure 36: Asia Pacific Computed Tomography Market in Mexico Revenue (Million), by Type 2024 & 2032
- Figure 37: Asia Pacific Computed Tomography Market in Mexico Revenue Share (%), by Type 2024 & 2032
- Figure 38: Asia Pacific Computed Tomography Market in Mexico Revenue (Million), by Application 2024 & 2032
- Figure 39: Asia Pacific Computed Tomography Market in Mexico Revenue Share (%), by Application 2024 & 2032
- Figure 40: Asia Pacific Computed Tomography Market in Mexico Revenue (Million), by End User 2024 & 2032
- Figure 41: Asia Pacific Computed Tomography Market in Mexico Revenue Share (%), by End User 2024 & 2032
- Figure 42: Asia Pacific Computed Tomography Market in Mexico Revenue (Million), by Country 2024 & 2032
- Figure 43: Asia Pacific Computed Tomography Market in Mexico Revenue Share (%), by Country 2024 & 2032
List of Tables
- Table 1: Global Computed Tomography Market in Mexico Revenue Million Forecast, by Region 2019 & 2032
- Table 2: Global Computed Tomography Market in Mexico Revenue Million Forecast, by Type 2019 & 2032
- Table 3: Global Computed Tomography Market in Mexico Revenue Million Forecast, by Application 2019 & 2032
- Table 4: Global Computed Tomography Market in Mexico Revenue Million Forecast, by End User 2019 & 2032
- Table 5: Global Computed Tomography Market in Mexico Revenue Million Forecast, by Region 2019 & 2032
- Table 6: Global Computed Tomography Market in Mexico Revenue Million Forecast, by Country 2019 & 2032
- Table 7: Global Computed Tomography Market in Mexico Revenue Million Forecast, by Type 2019 & 2032
- Table 8: Global Computed Tomography Market in Mexico Revenue Million Forecast, by Application 2019 & 2032
- Table 9: Global Computed Tomography Market in Mexico Revenue Million Forecast, by End User 2019 & 2032
- Table 10: Global Computed Tomography Market in Mexico Revenue Million Forecast, by Country 2019 & 2032
- Table 11: United States Computed Tomography Market in Mexico Revenue (Million) Forecast, by Application 2019 & 2032
- Table 12: Canada Computed Tomography Market in Mexico Revenue (Million) Forecast, by Application 2019 & 2032
- Table 13: Mexico Computed Tomography Market in Mexico Revenue (Million) Forecast, by Application 2019 & 2032
- Table 14: Global Computed Tomography Market in Mexico Revenue Million Forecast, by Type 2019 & 2032
- Table 15: Global Computed Tomography Market in Mexico Revenue Million Forecast, by Application 2019 & 2032
- Table 16: Global Computed Tomography Market in Mexico Revenue Million Forecast, by End User 2019 & 2032
- Table 17: Global Computed Tomography Market in Mexico Revenue Million Forecast, by Country 2019 & 2032
- Table 18: Brazil Computed Tomography Market in Mexico Revenue (Million) Forecast, by Application 2019 & 2032
- Table 19: Argentina Computed Tomography Market in Mexico Revenue (Million) Forecast, by Application 2019 & 2032
- Table 20: Rest of South America Computed Tomography Market in Mexico Revenue (Million) Forecast, by Application 2019 & 2032
- Table 21: Global Computed Tomography Market in Mexico Revenue Million Forecast, by Type 2019 & 2032
- Table 22: Global Computed Tomography Market in Mexico Revenue Million Forecast, by Application 2019 & 2032
- Table 23: Global Computed Tomography Market in Mexico Revenue Million Forecast, by End User 2019 & 2032
- Table 24: Global Computed Tomography Market in Mexico Revenue Million Forecast, by Country 2019 & 2032
- Table 25: United Kingdom Computed Tomography Market in Mexico Revenue (Million) Forecast, by Application 2019 & 2032
- Table 26: Germany Computed Tomography Market in Mexico Revenue (Million) Forecast, by Application 2019 & 2032
- Table 27: France Computed Tomography Market in Mexico Revenue (Million) Forecast, by Application 2019 & 2032
- Table 28: Italy Computed Tomography Market in Mexico Revenue (Million) Forecast, by Application 2019 & 2032
- Table 29: Spain Computed Tomography Market in Mexico Revenue (Million) Forecast, by Application 2019 & 2032
- Table 30: Russia Computed Tomography Market in Mexico Revenue (Million) Forecast, by Application 2019 & 2032
- Table 31: Benelux Computed Tomography Market in Mexico Revenue (Million) Forecast, by Application 2019 & 2032
- Table 32: Nordics Computed Tomography Market in Mexico Revenue (Million) Forecast, by Application 2019 & 2032
- Table 33: Rest of Europe Computed Tomography Market in Mexico Revenue (Million) Forecast, by Application 2019 & 2032
- Table 34: Global Computed Tomography Market in Mexico Revenue Million Forecast, by Type 2019 & 2032
- Table 35: Global Computed Tomography Market in Mexico Revenue Million Forecast, by Application 2019 & 2032
- Table 36: Global Computed Tomography Market in Mexico Revenue Million Forecast, by End User 2019 & 2032
- Table 37: Global Computed Tomography Market in Mexico Revenue Million Forecast, by Country 2019 & 2032
- Table 38: Turkey Computed Tomography Market in Mexico Revenue (Million) Forecast, by Application 2019 & 2032
- Table 39: Israel Computed Tomography Market in Mexico Revenue (Million) Forecast, by Application 2019 & 2032
- Table 40: GCC Computed Tomography Market in Mexico Revenue (Million) Forecast, by Application 2019 & 2032
- Table 41: North Africa Computed Tomography Market in Mexico Revenue (Million) Forecast, by Application 2019 & 2032
- Table 42: South Africa Computed Tomography Market in Mexico Revenue (Million) Forecast, by Application 2019 & 2032
- Table 43: Rest of Middle East & Africa Computed Tomography Market in Mexico Revenue (Million) Forecast, by Application 2019 & 2032
- Table 44: Global Computed Tomography Market in Mexico Revenue Million Forecast, by Type 2019 & 2032
- Table 45: Global Computed Tomography Market in Mexico Revenue Million Forecast, by Application 2019 & 2032
- Table 46: Global Computed Tomography Market in Mexico Revenue Million Forecast, by End User 2019 & 2032
- Table 47: Global Computed Tomography Market in Mexico Revenue Million Forecast, by Country 2019 & 2032
- Table 48: China Computed Tomography Market in Mexico Revenue (Million) Forecast, by Application 2019 & 2032
- Table 49: India Computed Tomography Market in Mexico Revenue (Million) Forecast, by Application 2019 & 2032
- Table 50: Japan Computed Tomography Market in Mexico Revenue (Million) Forecast, by Application 2019 & 2032
- Table 51: South Korea Computed Tomography Market in Mexico Revenue (Million) Forecast, by Application 2019 & 2032
- Table 52: ASEAN Computed Tomography Market in Mexico Revenue (Million) Forecast, by Application 2019 & 2032
- Table 53: Oceania Computed Tomography Market in Mexico Revenue (Million) Forecast, by Application 2019 & 2032
- Table 54: Rest of Asia Pacific Computed Tomography Market in Mexico Revenue (Million) Forecast, by Application 2019 & 2032
Frequently Asked Questions
1. What is the projected Compound Annual Growth Rate (CAGR) of the Computed Tomography Market in Mexico?
The projected CAGR is approximately 6.25%.
2. Which companies are prominent players in the Computed Tomography Market in Mexico?
Key companies in the market include GE Healthcare, Dentsply Sirona, Siemens Healthineers AG, Canon Medical Systems Corporation (Toshiba Corporation), Neusoft Medical Systems Co Ltd, Carestream Health, Vatech Inc, Koninklijke Philips NV, J Morita Corporation, Planmeca Group (Planmed OY), Samsung Electronics Co Ltd (Samsung Medison).
3. What are the main segments of the Computed Tomography Market in Mexico?
The market segments include Type, Application, End User.
4. Can you provide details about the market size?
The market size is estimated to be USD 159.35 Million as of 2022.
5. What are some drivers contributing to market growth?
Increasing Prevalence of Chronic Diseases; Rising Geriatric Population; Increasing Technological Advancements.
6. What are the notable trends driving market growth?
Oncology Segment is Expected to Hold a Significant Market Share Over the Forecast Period.
7. Are there any restraints impacting market growth?
Lack Of Proper Reimbursement And Stringent Regulatory Approval Procedures; High Cost of Equipment.
8. Can you provide examples of recent developments in the market?
In September 2020, To raise the level of healthcare for Mexicans, Nanox and SPI Medical announced an exclusive distribution agreement for the deployment of 630 Nanox.ARC devices in Mexico.
9. What pricing options are available for accessing the report?
Pricing options include single-user, multi-user, and enterprise licenses priced at USD 3800, USD 4500, and USD 5800 respectively.
10. Is the market size provided in terms of value or volume?
The market size is provided in terms of value, measured in Million.
11. Are there any specific market keywords associated with the report?
Yes, the market keyword associated with the report is "Computed Tomography Market in Mexico," which aids in identifying and referencing the specific market segment covered.
12. How do I determine which pricing option suits my needs best?
The pricing options vary based on user requirements and access needs. Individual users may opt for single-user licenses, while businesses requiring broader access may choose multi-user or enterprise licenses for cost-effective access to the report.
13. Are there any additional resources or data provided in the Computed Tomography Market in Mexico report?
While the report offers comprehensive insights, it's advisable to review the specific contents or supplementary materials provided to ascertain if additional resources or data are available.
14. How can I stay updated on further developments or reports in the Computed Tomography Market in Mexico?
To stay informed about further developments, trends, and reports in the Computed Tomography Market in Mexico, consider subscribing to industry newsletters, following relevant companies and organizations, or regularly checking reputable industry news sources and publications.
Methodology
Step 1 - Identification of Relevant Samples Size from Population Database


Step 2 - Approaches for Defining Global Market Size (Value, Volume* & Price*)

Note*: In applicable scenarios
Step 3 - Data Sources
Primary Research
- Web Analytics
- Survey Reports
- Research Institute
- Latest Research Reports
- Opinion Leaders
Secondary Research
- Annual Reports
- White Paper
- Latest Press Release
- Industry Association
- Paid Database
- Investor Presentations

Step 4 - Data Triangulation
Involves using different sources of information in order to increase the validity of a study
These sources are likely to be stakeholders in a program - participants, other researchers, program staff, other community members, and so on.
Then we put all data in single framework & apply various statistical tools to find out the dynamic on the market.
During the analysis stage, feedback from the stakeholder groups would be compared to determine areas of agreement as well as areas of divergence


