
Key Insights
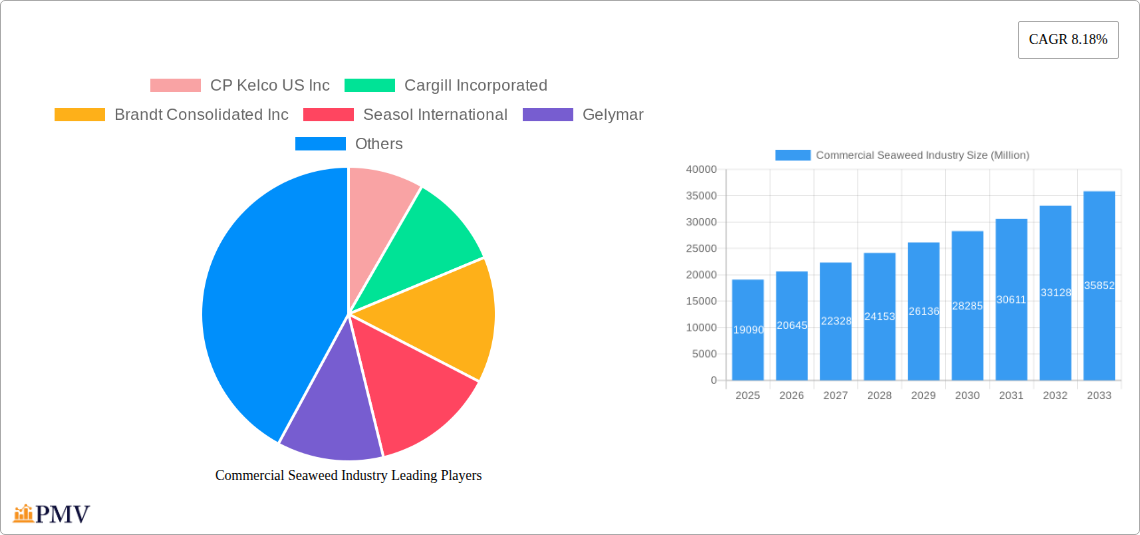
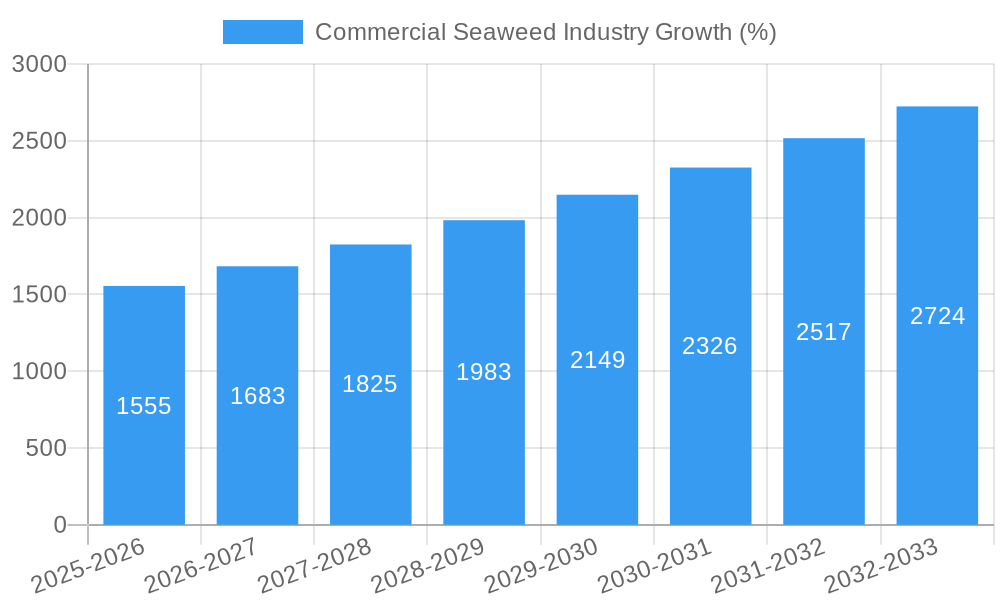
The commercial seaweed industry, valued at $19.09 billion in 2025, is experiencing robust growth, projected to expand at a compound annual growth rate (CAGR) of 8.18% from 2025 to 2033. This expansion is driven by several factors. The increasing demand for sustainable and nutritious food sources fuels the adoption of seaweed in food and beverages, contributing significantly to market growth. Simultaneously, the rising awareness of seaweed's health benefits, including its rich nutrient profile and potential applications in dietary supplements and pharmaceuticals, is significantly boosting demand. Further propelling the market is the expanding research into novel seaweed applications across various industries, such as cosmetics and bioplastics, creating diverse avenues for growth. However, challenges such as fluctuating seaweed yields due to environmental factors and the high cost of processing and extraction of certain seaweed types pose potential restraints to market expansion.
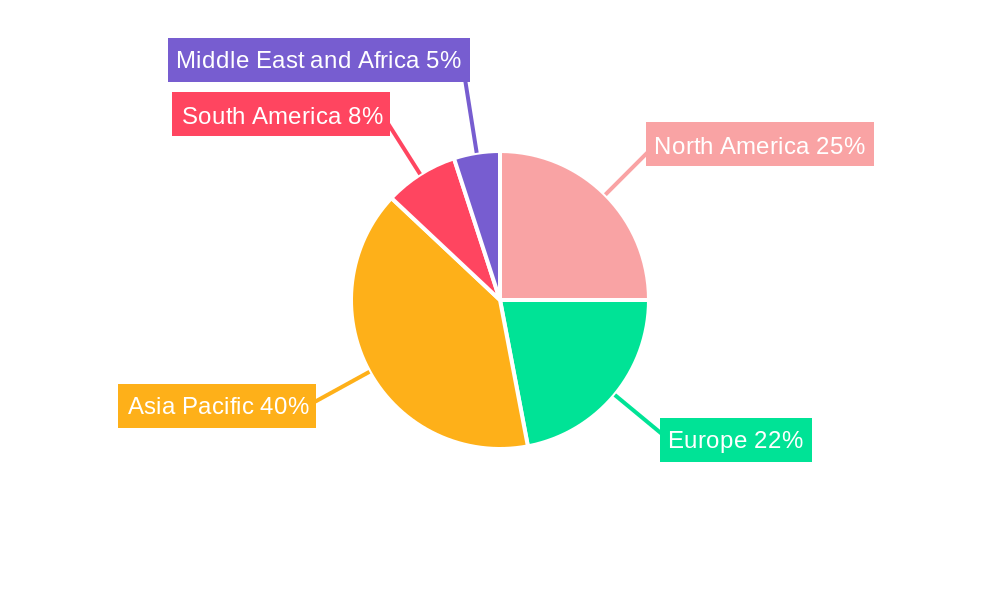
Segment-wise, the food and beverage application currently holds the largest market share, driven by its use as a thickening agent, flavor enhancer, and a source of vitamins and minerals in various processed foods. The dietary supplements segment is also witnessing significant growth, leveraging seaweed's rich content of vitamins, minerals, and antioxidants. Geographically, Asia-Pacific, particularly China and Japan, are major players due to established seaweed cultivation practices and high consumption rates. However, North America and Europe are exhibiting strong growth potential, driven by rising consumer awareness and the growing availability of seaweed-based products in these regions. Leading companies like CP Kelco, Cargill, and Acadian Seaplants are actively investing in research and development, expanding their product portfolios, and consolidating their market positions through strategic mergers and acquisitions. The industry's future growth trajectory is strongly linked to advancements in cultivation techniques, processing technologies, and ongoing research into new seaweed applications, promising a sustainable and expansive market outlook.
Commercial Seaweed Industry: Market Analysis & Forecast (2019-2033)
This comprehensive report provides a detailed analysis of the global commercial seaweed industry, offering invaluable insights for stakeholders across the value chain. With a study period spanning 2019-2033, a base year of 2025, and a forecast period of 2025-2033, this report delivers actionable intelligence for informed decision-making. The global market size is estimated at xx Million in 2025 and projected to reach xx Million by 2033, exhibiting a robust CAGR of xx%.
Commercial Seaweed Industry Market Structure & Competitive Dynamics
The global commercial seaweed industry exhibits a moderately concentrated market structure, with several key players dominating specific segments. Market share analysis reveals that CP Kelco US Inc., Cargill Incorporated, and Acadian Seaplants hold significant positions, though the exact percentages vary across product types and applications. Innovation ecosystems are dynamic, with ongoing research and development focused on novel extraction methods, value-added product development, and sustainable cultivation practices. Regulatory frameworks differ across regions, impacting both production and market access. Product substitutes, such as synthetic hydrocolloids, pose a competitive challenge, particularly in specific applications. End-user trends toward healthier and more sustainable food choices are driving demand for seaweed-based products. Mergers and acquisitions (M&A) activity within the industry has been moderate in recent years, with deal values ranging from xx Million to xx Million. Examples include (but are not limited to) strategic acquisitions aimed at expanding product portfolios or securing access to key raw materials.
- Market Concentration: Moderately concentrated, with several dominant players.
- Innovation Ecosystems: Active R&D in extraction, product development, and sustainable farming.
- Regulatory Frameworks: Vary significantly across regions, impacting market access.
- Product Substitutes: Synthetic hydrocolloids present competition in certain segments.
- End-User Trends: Growing demand for healthy and sustainable food and products is boosting growth.
- M&A Activity: Moderate activity, with deal values ranging from xx Million to xx Million.
Commercial Seaweed Industry Industry Trends & Insights
The commercial seaweed industry is experiencing significant growth, driven by increasing consumer demand for natural and sustainable ingredients. The market is witnessing technological disruptions, particularly in seaweed cultivation and extraction technologies, leading to improved efficiency and yield. Consumer preferences are shifting towards health-conscious products with functional benefits, thereby increasing the demand for seaweed-based dietary supplements, pharmaceuticals, and food products. The competitive dynamics are characterized by both established players and emerging start-ups, particularly in seaweed farming. This competitive landscape fosters innovation and enhances market efficiency. The global CAGR for the forecast period is estimated to be xx%, with significant market penetration across various applications.
Dominant Markets & Segments in Commercial Seaweed Industry
Brown seaweed currently holds the largest market share in the global seaweed industry, driven by its wide range of applications, including food, feed, and industrial uses. This dominance is further fueled by its widespread cultivation and relatively lower cost compared to other seaweed types.
- Key Drivers for Brown Seaweed Dominance:
- Established supply chains
- Abundant resources
- Versatile applications
Food and beverage applications dominate the overall market, particularly in Asia, Europe, and North America. The rising demand for natural food additives and the growing awareness of seaweed's nutritional value are key drivers. Dietary supplements represent a rapidly growing segment, propelled by the rising popularity of health and wellness products. The pharmaceutical segment is witnessing gradual growth, driven by the discovery of bioactive compounds with therapeutic potential.
Key Drivers for Food and Beverage Dominance:
- Growing demand for natural food additives and health foods.
- Rising awareness of seaweed’s nutritional benefits.
- Established distribution networks.
Geographic Dominance: Asia-Pacific is currently the leading region due to high consumption rates and established cultivation practices. However, Europe and North America are also exhibiting significant growth due to increasing consumer demand for seaweed-based products.
Commercial Seaweed Industry Product Innovations
Recent innovations focus on developing value-added products like specialized extracts, functional food ingredients, and novel formulations for specific applications. WavePure® ADG 8250, a seaweed-based ingredient from Cargill, exemplifies this trend, providing a functional ingredient for dairy desserts. CadalminTM LivCure extract, a nutraceutical from CMFRI, showcases innovation in the development of seaweed-based health products. These advancements highlight the growing sophistication of the industry and its increasing focus on meeting specific market needs. Technological advancements in cultivation methods, particularly in sustainable and efficient aquaculture practices, further enhance the industry's competitive landscape.
Report Segmentation & Scope
The report segments the market by product type (Brown Seaweed, Green Seaweed, Red Seaweed) and application (Food and Beverages, Dietary Supplements, Pharmaceuticals, Other Applications). Each segment is analyzed in detail, providing growth projections, market sizes, and competitive dynamics. The forecast period is 2025-2033, with 2025 serving as the base year. This granular segmentation helps stakeholders gain a comprehensive understanding of various market niches and opportunities. For instance, the food and beverage segment is projected to grow at xx%, while the dietary supplements segment is expected to experience xx% growth during the forecast period.
Key Drivers of Commercial Seaweed Industry Growth
Several factors fuel the growth of the commercial seaweed industry. These include increasing consumer demand for natural and sustainable ingredients; technological advancements in seaweed cultivation, harvesting, and processing; government support for seaweed farming initiatives; expanding applications in various sectors, like food, pharmaceuticals, and biofuels; and the discovery of new bioactive compounds with health benefits, as seen with CadalminTM LivCure extract.
Challenges in the Commercial Seaweed Industry Sector
The industry faces challenges such as fluctuating seaweed yields due to climate change; inconsistent regulatory frameworks across different regions, hindering market expansion; supply chain complexities and logistics costs; competition from synthetic hydrocolloids and other substitutes; and potential challenges in scaling up sustainable cultivation practices to meet growing demand. Addressing these challenges is crucial for ensuring the long-term sustainability and growth of the commercial seaweed industry.
Leading Players in the Commercial Seaweed Industry Market
- CP Kelco US Inc
- Cargill Incorporated
- Brandt Consolidated Inc
- Seasol International
- Gelymar
- E I du Pont de Nemours & Company
- Rhodomaxx
- Algaia SA
- Dycolor Seaweed Industries
- Acadian Seaplants
Key Developments in Commercial Seaweed Industry Sector
September 2022: Launch of CadalminTM LivCure extract, a seaweed-based nutraceutical for liver health, by ICAR-CMFRI. This signals the growing potential of seaweed in the pharmaceutical and nutraceutical sectors.
March 2021: A surge in seaweed farming start-ups in Australia, driven by increased opportunities and government support, indicating a positive investment climate and market expansion.
February 2021: Cargill's launch of WavePure® ADG 8250, a seaweed-based ingredient for food applications, highlights innovation in value-added product development and market expansion within the food industry.
Strategic Commercial Seaweed Industry Market Outlook
The commercial seaweed industry presents significant growth potential, driven by a confluence of factors including increasing health consciousness, sustainability concerns, and technological advancements. Strategic opportunities lie in developing innovative seaweed-based products, expanding into new markets, and adopting sustainable cultivation practices. Further research into the potential of seaweed as a source of bioactive compounds and its applications in various industries will continue to fuel market growth and create new opportunities for industry players.
Commercial Seaweed Industry Segmentation
-
1. Product Type
- 1.1. Brown Seaweed
- 1.2. Green Seaweed
- 1.3. Red Seaweed
-
2. Application
- 2.1. Food and Beverages
- 2.2. Dietary Supplements
- 2.3. Pharmaceuticals
- 2.4. Other Applications
Commercial Seaweed Industry Segmentation By Geography
-
1. North America
- 1.1. United States
- 1.2. Canada
- 1.3. Mexico
- 1.4. Rest of North America
-
2. Europe
- 2.1. Germany
- 2.2. United Kingdom
- 2.3. France
- 2.4. Spain
- 2.5. Russia
- 2.6. Italy
- 2.7. Rest of Europe
-
3. Asia Pacific
- 3.1. China
- 3.2. India
- 3.3. Japan
- 3.4. Australia
- 3.5. Rest of Asia Pacific
-
4. South America
- 4.1. Brazil
- 4.2. Argentina
- 4.3. Rest of South America
-
5. Middle East and Africa
- 5.1. United Arab Emirates
- 5.2. South Africa
- 5.3. Rest Middle East and Africa
Commercial Seaweed Industry REPORT HIGHLIGHTS
| Aspects | Details |
|---|---|
| Study Period | 2019-2033 |
| Base Year | 2024 |
| Estimated Year | 2025 |
| Forecast Period | 2025-2033 |
| Historical Period | 2019-2024 |
| Growth Rate | CAGR of 8.18% from 2019-2033 |
| Segmentation |
|
Table of Contents
- 1. Introduction
- 1.1. Research Scope
- 1.2. Market Segmentation
- 1.3. Research Methodology
- 1.4. Definitions and Assumptions
- 2. Executive Summary
- 2.1. Introduction
- 3. Market Dynamics
- 3.1. Introduction
- 3.2. Market Drivers
- 3.2.1. Increasing Demand for Low-Fat and Low-Calorie Food; Increasing Product Innovation
- 3.3. Market Restrains
- 3.3.1. ; Threat of New Entrants; Bargaining Power of Buyers/Consumers; Bargaining Power of Suppliers; Threat of Substitute Products; Degree Of Competition
- 3.4. Market Trends
- 3.4.1. Increased Usage of Seaweed in Food Sector due to it Functional Properties and Nutritional Benefits
- 4. Market Factor Analysis
- 4.1. Porters Five Forces
- 4.2. Supply/Value Chain
- 4.3. PESTEL analysis
- 4.4. Market Entropy
- 4.5. Patent/Trademark Analysis
- 5. Global Commercial Seaweed Industry Analysis, Insights and Forecast, 2019-2031
- 5.1. Market Analysis, Insights and Forecast - by Product Type
- 5.1.1. Brown Seaweed
- 5.1.2. Green Seaweed
- 5.1.3. Red Seaweed
- 5.2. Market Analysis, Insights and Forecast - by Application
- 5.2.1. Food and Beverages
- 5.2.2. Dietary Supplements
- 5.2.3. Pharmaceuticals
- 5.2.4. Other Applications
- 5.3. Market Analysis, Insights and Forecast - by Region
- 5.3.1. North America
- 5.3.2. Europe
- 5.3.3. Asia Pacific
- 5.3.4. South America
- 5.3.5. Middle East and Africa
- 5.1. Market Analysis, Insights and Forecast - by Product Type
- 6. North America Commercial Seaweed Industry Analysis, Insights and Forecast, 2019-2031
- 6.1. Market Analysis, Insights and Forecast - by Product Type
- 6.1.1. Brown Seaweed
- 6.1.2. Green Seaweed
- 6.1.3. Red Seaweed
- 6.2. Market Analysis, Insights and Forecast - by Application
- 6.2.1. Food and Beverages
- 6.2.2. Dietary Supplements
- 6.2.3. Pharmaceuticals
- 6.2.4. Other Applications
- 6.1. Market Analysis, Insights and Forecast - by Product Type
- 7. Europe Commercial Seaweed Industry Analysis, Insights and Forecast, 2019-2031
- 7.1. Market Analysis, Insights and Forecast - by Product Type
- 7.1.1. Brown Seaweed
- 7.1.2. Green Seaweed
- 7.1.3. Red Seaweed
- 7.2. Market Analysis, Insights and Forecast - by Application
- 7.2.1. Food and Beverages
- 7.2.2. Dietary Supplements
- 7.2.3. Pharmaceuticals
- 7.2.4. Other Applications
- 7.1. Market Analysis, Insights and Forecast - by Product Type
- 8. Asia Pacific Commercial Seaweed Industry Analysis, Insights and Forecast, 2019-2031
- 8.1. Market Analysis, Insights and Forecast - by Product Type
- 8.1.1. Brown Seaweed
- 8.1.2. Green Seaweed
- 8.1.3. Red Seaweed
- 8.2. Market Analysis, Insights and Forecast - by Application
- 8.2.1. Food and Beverages
- 8.2.2. Dietary Supplements
- 8.2.3. Pharmaceuticals
- 8.2.4. Other Applications
- 8.1. Market Analysis, Insights and Forecast - by Product Type
- 9. South America Commercial Seaweed Industry Analysis, Insights and Forecast, 2019-2031
- 9.1. Market Analysis, Insights and Forecast - by Product Type
- 9.1.1. Brown Seaweed
- 9.1.2. Green Seaweed
- 9.1.3. Red Seaweed
- 9.2. Market Analysis, Insights and Forecast - by Application
- 9.2.1. Food and Beverages
- 9.2.2. Dietary Supplements
- 9.2.3. Pharmaceuticals
- 9.2.4. Other Applications
- 9.1. Market Analysis, Insights and Forecast - by Product Type
- 10. Middle East and Africa Commercial Seaweed Industry Analysis, Insights and Forecast, 2019-2031
- 10.1. Market Analysis, Insights and Forecast - by Product Type
- 10.1.1. Brown Seaweed
- 10.1.2. Green Seaweed
- 10.1.3. Red Seaweed
- 10.2. Market Analysis, Insights and Forecast - by Application
- 10.2.1. Food and Beverages
- 10.2.2. Dietary Supplements
- 10.2.3. Pharmaceuticals
- 10.2.4. Other Applications
- 10.1. Market Analysis, Insights and Forecast - by Product Type
- 11. North America Commercial Seaweed Industry Analysis, Insights and Forecast, 2019-2031
- 11.1. Market Analysis, Insights and Forecast - By Country/Sub-region
- 11.1.1 United States
- 11.1.2 Canada
- 11.1.3 Mexico
- 11.1.4 Rest of North America
- 12. Europe Commercial Seaweed Industry Analysis, Insights and Forecast, 2019-2031
- 12.1. Market Analysis, Insights and Forecast - By Country/Sub-region
- 12.1.1 Germany
- 12.1.2 United Kingdom
- 12.1.3 France
- 12.1.4 Spain
- 12.1.5 Russia
- 12.1.6 Italy
- 12.1.7 Rest of Europe
- 13. Asia Pacific Commercial Seaweed Industry Analysis, Insights and Forecast, 2019-2031
- 13.1. Market Analysis, Insights and Forecast - By Country/Sub-region
- 13.1.1 China
- 13.1.2 India
- 13.1.3 Japan
- 13.1.4 Australia
- 13.1.5 Rest of Asia Pacific
- 14. South America Commercial Seaweed Industry Analysis, Insights and Forecast, 2019-2031
- 14.1. Market Analysis, Insights and Forecast - By Country/Sub-region
- 14.1.1 Brazil
- 14.1.2 Argentina
- 14.1.3 Rest of South America
- 15. Middle East and Africa Commercial Seaweed Industry Analysis, Insights and Forecast, 2019-2031
- 15.1. Market Analysis, Insights and Forecast - By Country/Sub-region
- 15.1.1 United Arab Emirates
- 15.1.2 South Africa
- 15.1.3 Rest Middle East and Africa
- 16. Competitive Analysis
- 16.1. Global Market Share Analysis 2024
- 16.2. Company Profiles
- 16.2.1 CP Kelco US Inc
- 16.2.1.1. Overview
- 16.2.1.2. Products
- 16.2.1.3. SWOT Analysis
- 16.2.1.4. Recent Developments
- 16.2.1.5. Financials (Based on Availability)
- 16.2.2 Cargill Incorporated
- 16.2.2.1. Overview
- 16.2.2.2. Products
- 16.2.2.3. SWOT Analysis
- 16.2.2.4. Recent Developments
- 16.2.2.5. Financials (Based on Availability)
- 16.2.3 Brandt Consolidated Inc
- 16.2.3.1. Overview
- 16.2.3.2. Products
- 16.2.3.3. SWOT Analysis
- 16.2.3.4. Recent Developments
- 16.2.3.5. Financials (Based on Availability)
- 16.2.4 Seasol International
- 16.2.4.1. Overview
- 16.2.4.2. Products
- 16.2.4.3. SWOT Analysis
- 16.2.4.4. Recent Developments
- 16.2.4.5. Financials (Based on Availability)
- 16.2.5 Gelymar
- 16.2.5.1. Overview
- 16.2.5.2. Products
- 16.2.5.3. SWOT Analysis
- 16.2.5.4. Recent Developments
- 16.2.5.5. Financials (Based on Availability)
- 16.2.6 E I du Pont de Nemours & Company
- 16.2.6.1. Overview
- 16.2.6.2. Products
- 16.2.6.3. SWOT Analysis
- 16.2.6.4. Recent Developments
- 16.2.6.5. Financials (Based on Availability)
- 16.2.7 Rhodomaxx
- 16.2.7.1. Overview
- 16.2.7.2. Products
- 16.2.7.3. SWOT Analysis
- 16.2.7.4. Recent Developments
- 16.2.7.5. Financials (Based on Availability)
- 16.2.8 Algaia SA*List Not Exhaustive
- 16.2.8.1. Overview
- 16.2.8.2. Products
- 16.2.8.3. SWOT Analysis
- 16.2.8.4. Recent Developments
- 16.2.8.5. Financials (Based on Availability)
- 16.2.9 Dycolor Seaweed Industries
- 16.2.9.1. Overview
- 16.2.9.2. Products
- 16.2.9.3. SWOT Analysis
- 16.2.9.4. Recent Developments
- 16.2.9.5. Financials (Based on Availability)
- 16.2.10 Acadian Seaplants
- 16.2.10.1. Overview
- 16.2.10.2. Products
- 16.2.10.3. SWOT Analysis
- 16.2.10.4. Recent Developments
- 16.2.10.5. Financials (Based on Availability)
- 16.2.1 CP Kelco US Inc
List of Figures
- Figure 1: Global Commercial Seaweed Industry Revenue Breakdown (Million, %) by Region 2024 & 2032
- Figure 2: North America Commercial Seaweed Industry Revenue (Million), by Country 2024 & 2032
- Figure 3: North America Commercial Seaweed Industry Revenue Share (%), by Country 2024 & 2032
- Figure 4: Europe Commercial Seaweed Industry Revenue (Million), by Country 2024 & 2032
- Figure 5: Europe Commercial Seaweed Industry Revenue Share (%), by Country 2024 & 2032
- Figure 6: Asia Pacific Commercial Seaweed Industry Revenue (Million), by Country 2024 & 2032
- Figure 7: Asia Pacific Commercial Seaweed Industry Revenue Share (%), by Country 2024 & 2032
- Figure 8: South America Commercial Seaweed Industry Revenue (Million), by Country 2024 & 2032
- Figure 9: South America Commercial Seaweed Industry Revenue Share (%), by Country 2024 & 2032
- Figure 10: Middle East and Africa Commercial Seaweed Industry Revenue (Million), by Country 2024 & 2032
- Figure 11: Middle East and Africa Commercial Seaweed Industry Revenue Share (%), by Country 2024 & 2032
- Figure 12: North America Commercial Seaweed Industry Revenue (Million), by Product Type 2024 & 2032
- Figure 13: North America Commercial Seaweed Industry Revenue Share (%), by Product Type 2024 & 2032
- Figure 14: North America Commercial Seaweed Industry Revenue (Million), by Application 2024 & 2032
- Figure 15: North America Commercial Seaweed Industry Revenue Share (%), by Application 2024 & 2032
- Figure 16: North America Commercial Seaweed Industry Revenue (Million), by Country 2024 & 2032
- Figure 17: North America Commercial Seaweed Industry Revenue Share (%), by Country 2024 & 2032
- Figure 18: Europe Commercial Seaweed Industry Revenue (Million), by Product Type 2024 & 2032
- Figure 19: Europe Commercial Seaweed Industry Revenue Share (%), by Product Type 2024 & 2032
- Figure 20: Europe Commercial Seaweed Industry Revenue (Million), by Application 2024 & 2032
- Figure 21: Europe Commercial Seaweed Industry Revenue Share (%), by Application 2024 & 2032
- Figure 22: Europe Commercial Seaweed Industry Revenue (Million), by Country 2024 & 2032
- Figure 23: Europe Commercial Seaweed Industry Revenue Share (%), by Country 2024 & 2032
- Figure 24: Asia Pacific Commercial Seaweed Industry Revenue (Million), by Product Type 2024 & 2032
- Figure 25: Asia Pacific Commercial Seaweed Industry Revenue Share (%), by Product Type 2024 & 2032
- Figure 26: Asia Pacific Commercial Seaweed Industry Revenue (Million), by Application 2024 & 2032
- Figure 27: Asia Pacific Commercial Seaweed Industry Revenue Share (%), by Application 2024 & 2032
- Figure 28: Asia Pacific Commercial Seaweed Industry Revenue (Million), by Country 2024 & 2032
- Figure 29: Asia Pacific Commercial Seaweed Industry Revenue Share (%), by Country 2024 & 2032
- Figure 30: South America Commercial Seaweed Industry Revenue (Million), by Product Type 2024 & 2032
- Figure 31: South America Commercial Seaweed Industry Revenue Share (%), by Product Type 2024 & 2032
- Figure 32: South America Commercial Seaweed Industry Revenue (Million), by Application 2024 & 2032
- Figure 33: South America Commercial Seaweed Industry Revenue Share (%), by Application 2024 & 2032
- Figure 34: South America Commercial Seaweed Industry Revenue (Million), by Country 2024 & 2032
- Figure 35: South America Commercial Seaweed Industry Revenue Share (%), by Country 2024 & 2032
- Figure 36: Middle East and Africa Commercial Seaweed Industry Revenue (Million), by Product Type 2024 & 2032
- Figure 37: Middle East and Africa Commercial Seaweed Industry Revenue Share (%), by Product Type 2024 & 2032
- Figure 38: Middle East and Africa Commercial Seaweed Industry Revenue (Million), by Application 2024 & 2032
- Figure 39: Middle East and Africa Commercial Seaweed Industry Revenue Share (%), by Application 2024 & 2032
- Figure 40: Middle East and Africa Commercial Seaweed Industry Revenue (Million), by Country 2024 & 2032
- Figure 41: Middle East and Africa Commercial Seaweed Industry Revenue Share (%), by Country 2024 & 2032
List of Tables
- Table 1: Global Commercial Seaweed Industry Revenue Million Forecast, by Region 2019 & 2032
- Table 2: Global Commercial Seaweed Industry Revenue Million Forecast, by Product Type 2019 & 2032
- Table 3: Global Commercial Seaweed Industry Revenue Million Forecast, by Application 2019 & 2032
- Table 4: Global Commercial Seaweed Industry Revenue Million Forecast, by Region 2019 & 2032
- Table 5: Global Commercial Seaweed Industry Revenue Million Forecast, by Country 2019 & 2032
- Table 6: United States Commercial Seaweed Industry Revenue (Million) Forecast, by Application 2019 & 2032
- Table 7: Canada Commercial Seaweed Industry Revenue (Million) Forecast, by Application 2019 & 2032
- Table 8: Mexico Commercial Seaweed Industry Revenue (Million) Forecast, by Application 2019 & 2032
- Table 9: Rest of North America Commercial Seaweed Industry Revenue (Million) Forecast, by Application 2019 & 2032
- Table 10: Global Commercial Seaweed Industry Revenue Million Forecast, by Country 2019 & 2032
- Table 11: Germany Commercial Seaweed Industry Revenue (Million) Forecast, by Application 2019 & 2032
- Table 12: United Kingdom Commercial Seaweed Industry Revenue (Million) Forecast, by Application 2019 & 2032
- Table 13: France Commercial Seaweed Industry Revenue (Million) Forecast, by Application 2019 & 2032
- Table 14: Spain Commercial Seaweed Industry Revenue (Million) Forecast, by Application 2019 & 2032
- Table 15: Russia Commercial Seaweed Industry Revenue (Million) Forecast, by Application 2019 & 2032
- Table 16: Italy Commercial Seaweed Industry Revenue (Million) Forecast, by Application 2019 & 2032
- Table 17: Rest of Europe Commercial Seaweed Industry Revenue (Million) Forecast, by Application 2019 & 2032
- Table 18: Global Commercial Seaweed Industry Revenue Million Forecast, by Country 2019 & 2032
- Table 19: China Commercial Seaweed Industry Revenue (Million) Forecast, by Application 2019 & 2032
- Table 20: India Commercial Seaweed Industry Revenue (Million) Forecast, by Application 2019 & 2032
- Table 21: Japan Commercial Seaweed Industry Revenue (Million) Forecast, by Application 2019 & 2032
- Table 22: Australia Commercial Seaweed Industry Revenue (Million) Forecast, by Application 2019 & 2032
- Table 23: Rest of Asia Pacific Commercial Seaweed Industry Revenue (Million) Forecast, by Application 2019 & 2032
- Table 24: Global Commercial Seaweed Industry Revenue Million Forecast, by Country 2019 & 2032
- Table 25: Brazil Commercial Seaweed Industry Revenue (Million) Forecast, by Application 2019 & 2032
- Table 26: Argentina Commercial Seaweed Industry Revenue (Million) Forecast, by Application 2019 & 2032
- Table 27: Rest of South America Commercial Seaweed Industry Revenue (Million) Forecast, by Application 2019 & 2032
- Table 28: Global Commercial Seaweed Industry Revenue Million Forecast, by Country 2019 & 2032
- Table 29: United Arab Emirates Commercial Seaweed Industry Revenue (Million) Forecast, by Application 2019 & 2032
- Table 30: South Africa Commercial Seaweed Industry Revenue (Million) Forecast, by Application 2019 & 2032
- Table 31: Rest Middle East and Africa Commercial Seaweed Industry Revenue (Million) Forecast, by Application 2019 & 2032
- Table 32: Global Commercial Seaweed Industry Revenue Million Forecast, by Product Type 2019 & 2032
- Table 33: Global Commercial Seaweed Industry Revenue Million Forecast, by Application 2019 & 2032
- Table 34: Global Commercial Seaweed Industry Revenue Million Forecast, by Country 2019 & 2032
- Table 35: United States Commercial Seaweed Industry Revenue (Million) Forecast, by Application 2019 & 2032
- Table 36: Canada Commercial Seaweed Industry Revenue (Million) Forecast, by Application 2019 & 2032
- Table 37: Mexico Commercial Seaweed Industry Revenue (Million) Forecast, by Application 2019 & 2032
- Table 38: Rest of North America Commercial Seaweed Industry Revenue (Million) Forecast, by Application 2019 & 2032
- Table 39: Global Commercial Seaweed Industry Revenue Million Forecast, by Product Type 2019 & 2032
- Table 40: Global Commercial Seaweed Industry Revenue Million Forecast, by Application 2019 & 2032
- Table 41: Global Commercial Seaweed Industry Revenue Million Forecast, by Country 2019 & 2032
- Table 42: Germany Commercial Seaweed Industry Revenue (Million) Forecast, by Application 2019 & 2032
- Table 43: United Kingdom Commercial Seaweed Industry Revenue (Million) Forecast, by Application 2019 & 2032
- Table 44: France Commercial Seaweed Industry Revenue (Million) Forecast, by Application 2019 & 2032
- Table 45: Spain Commercial Seaweed Industry Revenue (Million) Forecast, by Application 2019 & 2032
- Table 46: Russia Commercial Seaweed Industry Revenue (Million) Forecast, by Application 2019 & 2032
- Table 47: Italy Commercial Seaweed Industry Revenue (Million) Forecast, by Application 2019 & 2032
- Table 48: Rest of Europe Commercial Seaweed Industry Revenue (Million) Forecast, by Application 2019 & 2032
- Table 49: Global Commercial Seaweed Industry Revenue Million Forecast, by Product Type 2019 & 2032
- Table 50: Global Commercial Seaweed Industry Revenue Million Forecast, by Application 2019 & 2032
- Table 51: Global Commercial Seaweed Industry Revenue Million Forecast, by Country 2019 & 2032
- Table 52: China Commercial Seaweed Industry Revenue (Million) Forecast, by Application 2019 & 2032
- Table 53: India Commercial Seaweed Industry Revenue (Million) Forecast, by Application 2019 & 2032
- Table 54: Japan Commercial Seaweed Industry Revenue (Million) Forecast, by Application 2019 & 2032
- Table 55: Australia Commercial Seaweed Industry Revenue (Million) Forecast, by Application 2019 & 2032
- Table 56: Rest of Asia Pacific Commercial Seaweed Industry Revenue (Million) Forecast, by Application 2019 & 2032
- Table 57: Global Commercial Seaweed Industry Revenue Million Forecast, by Product Type 2019 & 2032
- Table 58: Global Commercial Seaweed Industry Revenue Million Forecast, by Application 2019 & 2032
- Table 59: Global Commercial Seaweed Industry Revenue Million Forecast, by Country 2019 & 2032
- Table 60: Brazil Commercial Seaweed Industry Revenue (Million) Forecast, by Application 2019 & 2032
- Table 61: Argentina Commercial Seaweed Industry Revenue (Million) Forecast, by Application 2019 & 2032
- Table 62: Rest of South America Commercial Seaweed Industry Revenue (Million) Forecast, by Application 2019 & 2032
- Table 63: Global Commercial Seaweed Industry Revenue Million Forecast, by Product Type 2019 & 2032
- Table 64: Global Commercial Seaweed Industry Revenue Million Forecast, by Application 2019 & 2032
- Table 65: Global Commercial Seaweed Industry Revenue Million Forecast, by Country 2019 & 2032
- Table 66: United Arab Emirates Commercial Seaweed Industry Revenue (Million) Forecast, by Application 2019 & 2032
- Table 67: South Africa Commercial Seaweed Industry Revenue (Million) Forecast, by Application 2019 & 2032
- Table 68: Rest Middle East and Africa Commercial Seaweed Industry Revenue (Million) Forecast, by Application 2019 & 2032
Frequently Asked Questions
1. What is the projected Compound Annual Growth Rate (CAGR) of the Commercial Seaweed Industry?
The projected CAGR is approximately 8.18%.
2. Which companies are prominent players in the Commercial Seaweed Industry?
Key companies in the market include CP Kelco US Inc, Cargill Incorporated, Brandt Consolidated Inc, Seasol International, Gelymar, E I du Pont de Nemours & Company, Rhodomaxx, Algaia SA*List Not Exhaustive, Dycolor Seaweed Industries, Acadian Seaplants.
3. What are the main segments of the Commercial Seaweed Industry?
The market segments include Product Type, Application.
4. Can you provide details about the market size?
The market size is estimated to be USD 19.09 Million as of 2022.
5. What are some drivers contributing to market growth?
Increasing Demand for Low-Fat and Low-Calorie Food; Increasing Product Innovation.
6. What are the notable trends driving market growth?
Increased Usage of Seaweed in Food Sector due to it Functional Properties and Nutritional Benefits.
7. Are there any restraints impacting market growth?
; Threat of New Entrants; Bargaining Power of Buyers/Consumers; Bargaining Power of Suppliers; Threat of Substitute Products; Degree Of Competition.
8. Can you provide examples of recent developments in the market?
September 2022: CadalminTM LivCure extract, a patent-protected nutraceutical product developed by the ICAR-Central Marine Fisheries Research Institute (CMFRI) from seaweeds to combat non-alcoholic fatty liver disease, will be available in the market soon. The product contains 100% natural bioactive ingredients extracted from select seaweeds. The product is made using eco-friendly green technology to improve liver health and is the 9th nutraceutical developed by CMFRI
9. What pricing options are available for accessing the report?
Pricing options include single-user, multi-user, and enterprise licenses priced at USD 4750, USD 5250, and USD 8750 respectively.
10. Is the market size provided in terms of value or volume?
The market size is provided in terms of value, measured in Million.
11. Are there any specific market keywords associated with the report?
Yes, the market keyword associated with the report is "Commercial Seaweed Industry," which aids in identifying and referencing the specific market segment covered.
12. How do I determine which pricing option suits my needs best?
The pricing options vary based on user requirements and access needs. Individual users may opt for single-user licenses, while businesses requiring broader access may choose multi-user or enterprise licenses for cost-effective access to the report.
13. Are there any additional resources or data provided in the Commercial Seaweed Industry report?
While the report offers comprehensive insights, it's advisable to review the specific contents or supplementary materials provided to ascertain if additional resources or data are available.
14. How can I stay updated on further developments or reports in the Commercial Seaweed Industry?
To stay informed about further developments, trends, and reports in the Commercial Seaweed Industry, consider subscribing to industry newsletters, following relevant companies and organizations, or regularly checking reputable industry news sources and publications.
Methodology
Step 1 - Identification of Relevant Samples Size from Population Database


Step 2 - Approaches for Defining Global Market Size (Value, Volume* & Price*)

Note*: In applicable scenarios
Step 3 - Data Sources
Primary Research
- Web Analytics
- Survey Reports
- Research Institute
- Latest Research Reports
- Opinion Leaders
Secondary Research
- Annual Reports
- White Paper
- Latest Press Release
- Industry Association
- Paid Database
- Investor Presentations

Step 4 - Data Triangulation
Involves using different sources of information in order to increase the validity of a study
These sources are likely to be stakeholders in a program - participants, other researchers, program staff, other community members, and so on.
Then we put all data in single framework & apply various statistical tools to find out the dynamic on the market.
During the analysis stage, feedback from the stakeholder groups would be compared to determine areas of agreement as well as areas of divergence


