
Key Insights
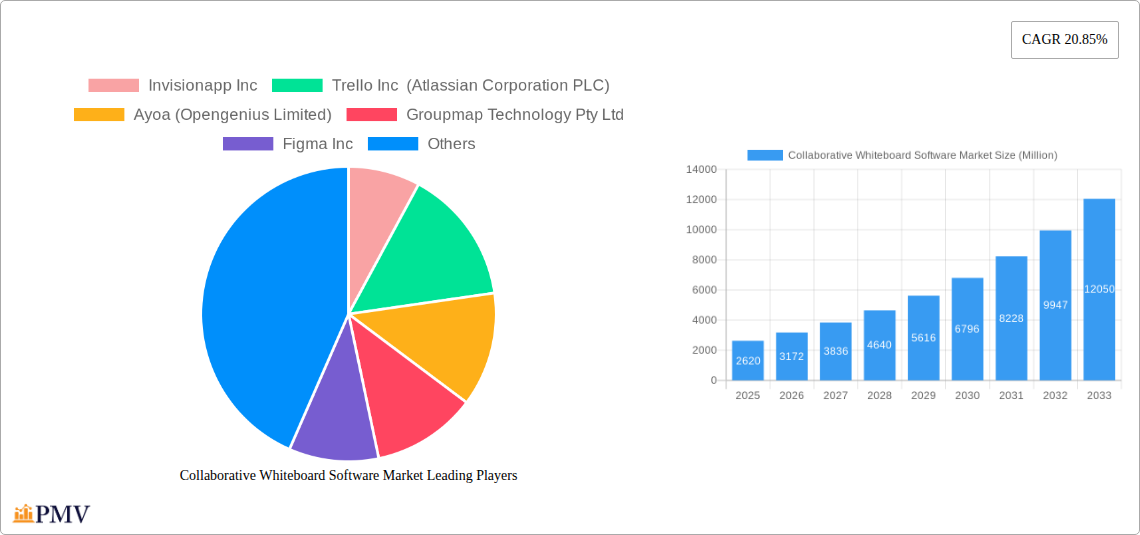
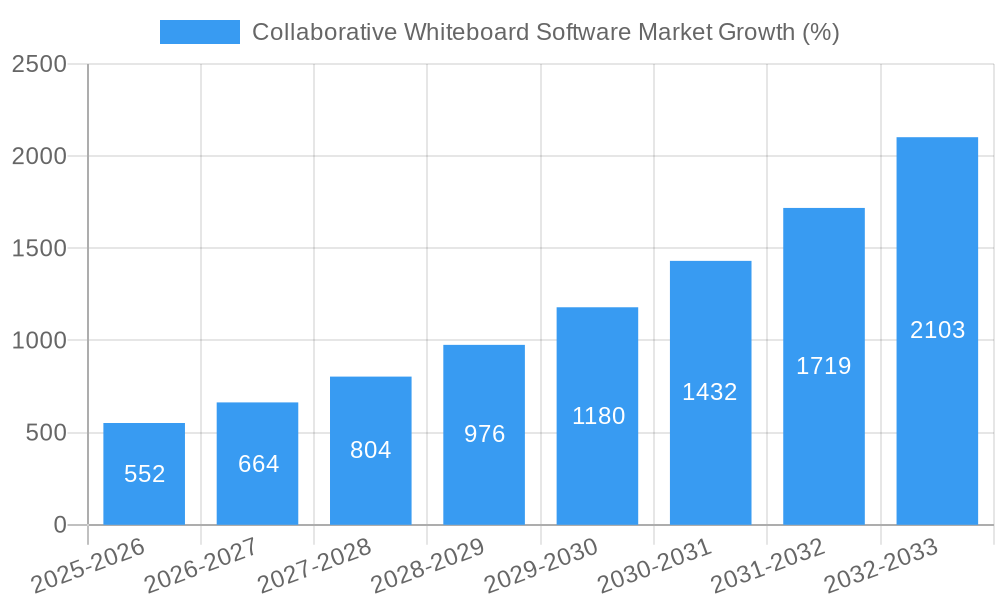
The Collaborative Whiteboard Software market is experiencing robust growth, projected to reach \$2.62 billion in 2025 and maintain a Compound Annual Growth Rate (CAGR) of 20.85% from 2025 to 2033. This expansion is driven by several key factors. The increasing adoption of remote work and hybrid work models necessitates efficient collaborative tools, fueling demand for virtual whiteboards. Furthermore, the rising need for enhanced communication and real-time collaboration across geographically dispersed teams is a significant market driver. Improved features such as real-time co-editing, integration with other productivity tools, and enhanced visual capabilities are boosting user engagement and adoption across various sectors. The market's segmentation reflects this diverse application, encompassing various operating systems (Windows, Web, iOS, Android), deployment modes (on-premise, cloud), organization sizes (large enterprises, SMEs), and end-user verticals (BFSI, healthcare, education, IT and telecommunications). Competition is fierce, with established players like Microsoft and Google alongside specialized startups vying for market share.
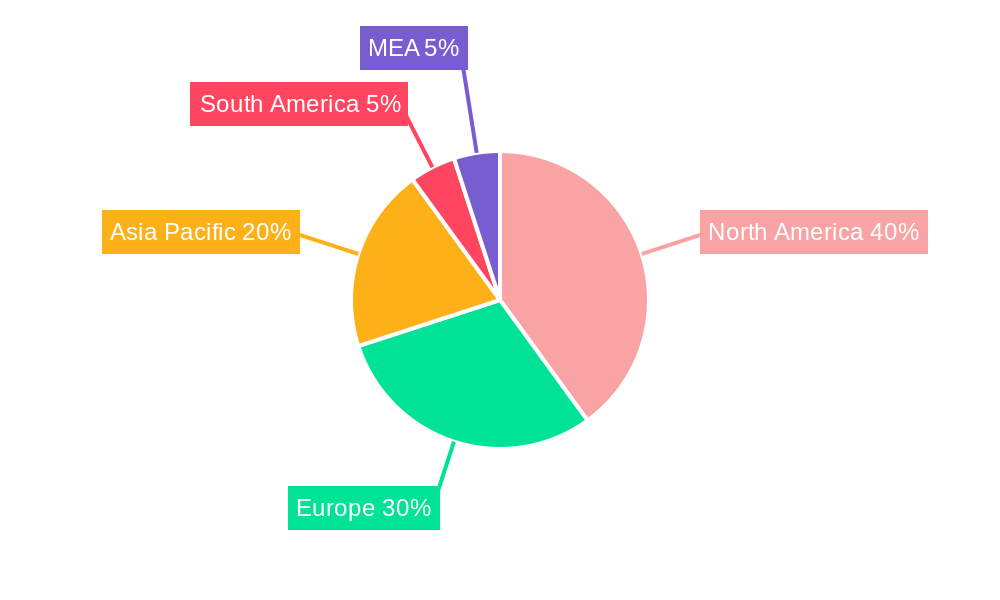
The North American market currently holds a significant share, attributed to the high adoption of advanced technologies and a robust IT infrastructure. However, the Asia-Pacific region is expected to witness the fastest growth due to increasing digitalization and a burgeoning tech-savvy workforce. While the cloud deployment mode dominates due to its scalability and cost-effectiveness, on-premise solutions retain a presence in sectors prioritizing data security and control. Future growth will likely be shaped by advancements in artificial intelligence (AI) integration for features like automated note-taking and idea generation, along with enhanced integration with other business software. The market faces challenges such as integration complexities, security concerns, and the need for user training, but the overall trajectory remains positive, promising significant market expansion throughout the forecast period.
Collaborative Whiteboard Software Market Report: 2019-2033
This comprehensive report provides a detailed analysis of the Collaborative Whiteboard Software market, offering invaluable insights for businesses, investors, and industry stakeholders. Covering the period from 2019 to 2033, with 2025 as the base year and a forecast period of 2025-2033, this report meticulously examines market size, growth drivers, competitive dynamics, and future trends. The global Collaborative Whiteboard Software market is projected to reach xx Million by 2033, exhibiting a CAGR of xx% during the forecast period.
Collaborative Whiteboard Software Market Structure & Competitive Dynamics
The Collaborative Whiteboard Software market exhibits a moderately concentrated structure, with several key players holding significant market share. However, the market is also characterized by a dynamic competitive landscape, driven by continuous innovation and the entry of new players. Market concentration is further analyzed through Herfindahl-Hirschman Index (HHI) calculation. The analysis includes assessing the impact of mergers and acquisitions (M&A) activities, such as the xx Million deal between Company A and Company B in 2024 (example). Major M&A activities are detailed and quantified.
- Market Share: Miro and Miro hold approximately xx% and xx% of the market share respectively (estimated). Other major players such as Microsoft, Google, and Mural collectively account for approximately xx%. Smaller players constitute the remaining market share.
- Innovation Ecosystems: The market's innovation ecosystem is robust, fueled by ongoing advancements in collaboration technologies, cloud computing, and artificial intelligence. This leads to frequent product updates and the emergence of new features such as real-time co-editing and advanced visualization tools.
- Regulatory Frameworks: Regulatory frameworks vary across regions, impacting data privacy and security. Compliance with GDPR and CCPA regulations is crucial for market players, influencing their strategies and operations.
- Product Substitutes: Traditional physical whiteboards and basic video conferencing tools pose a moderate threat as substitutes. However, the advantages of digital whiteboards in terms of collaboration, accessibility, and data storage are significantly outweighing these traditional methods, driving market growth.
- End-User Trends: Increasing adoption of hybrid and remote work models is a major driver. The need for seamless collaboration across geographical boundaries is fuelling the demand for collaborative whiteboard software.
Collaborative Whiteboard Software Market Industry Trends & Insights
The Collaborative Whiteboard Software market is experiencing significant growth, driven by several key factors. The increasing adoption of remote work models due to the pandemic accelerated market expansion. Technological advancements, such as improved user interfaces, integration with other productivity tools, and enhanced real-time collaboration capabilities, have further boosted market growth. Changing consumer preferences toward user-friendly, feature-rich applications are crucial, leading to the development of sophisticated solutions for diverse end-user needs. Competitive dynamics, marked by innovation and strategic partnerships, continue to reshape the landscape. The market’s growth is also fueled by the rising adoption of cloud-based solutions. Cloud-based deployment offers scalability, accessibility, and cost-effectiveness. The CAGR is projected to remain robust at xx% throughout the forecast period. Market penetration has increased by xx% from 2019 to 2024 (estimated).
Dominant Markets & Segments in Collaborative Whiteboard Software Market
The Cloud deployment mode segment dominates the Collaborative Whiteboard Software market, driven by the increasing popularity of SaaS solutions. The large enterprises segment also holds a significant share due to the higher adoption rates and larger budgets for these solutions. The Windows and Web operating system segment also shows high dominance due to its widespread use across enterprises. Geographically, North America currently holds the largest market share, followed by Europe. Asia-Pacific is projected to experience the highest growth rate during the forecast period.
- Key Drivers (Windows and Web): Widespread compatibility and accessibility across diverse devices.
- Key Drivers (Cloud Deployment): Scalability, cost-effectiveness, and enhanced accessibility.
- Key Drivers (Large Enterprises): High adoption rates and larger budgets for collaboration tools.
- Key Drivers (North America): High technological adoption, robust IT infrastructure, and presence of major market players.
Collaborative Whiteboard Software Market Product Innovations
Recent product innovations in the Collaborative Whiteboard Software market have focused on enhancing usability, integration capabilities, and the addition of AI-powered features. New products emphasize intuitive interfaces, seamless integration with other workplace tools, and features such as real-time co-editing, version control, and advanced visual tools. These developments enhance collaboration, improve efficiency, and cater to the evolving needs of businesses.
Report Segmentation & Scope
This report segments the Collaborative Whiteboard Software market based on operating system (Windows and Web, iOS, Android), deployment mode (on-premise, cloud), organization size (large enterprises, small and medium enterprises), and end-user vertical (BFSI, healthcare, education, IT and telecommunications, other). Each segment’s growth projections, market size, and competitive dynamics are analyzed in detail. The market size for each segment is estimated and projected for the forecast period.
Key Drivers of Collaborative Whiteboard Software Market Growth
The Collaborative Whiteboard Software market's growth is primarily fueled by technological advancements, increasing adoption of remote work models, and the rising demand for enhanced collaboration capabilities. Further, government initiatives supporting digital transformation and investment in IT infrastructure contribute significantly.
Challenges in the Collaborative Whiteboard Software Market Sector
Challenges include data security and privacy concerns, the need for robust integration with existing systems, and intense competition among numerous vendors. High initial investment costs for some solutions and concerns around user adoption also pose challenges.
Leading Players in the Collaborative Whiteboard Software Market
- Invisionapp Inc
- Trello Inc (Atlassian Corporation PLC)
- Ayoa (Opengenius Limited)
- Groupmap Technology Pty Ltd
- Figma Inc
- Stormboard
- Conceptboard
- Vizetto
- Limnu
- Collaboard
- Lucidspark
- Cisco Systems Inc
- Eztalks
- Microsoft Corporation
- Beecanvas
- Miro
- Explain Everything
- Edrawmind (Wondershare)
- Twiddla
- Ziteboard - Overview
- Bluescape
- Google Jamboard (Alphabet Inc)
- Zira Technologies Inc
- Zoom Video Communications
- Mural
Key Developments in Collaborative Whiteboard Software Market Sector
- Dec 2022: Apple launched Freeform, integrating it into iOS, iPadOS, and macOS, enhancing collaborative capabilities.
- Apr 2022: Introduction of FreehandsOn, a tactile digital whiteboard system for hybrid and remote teams.
Strategic Collaborative Whiteboard Software Market Outlook
The Collaborative Whiteboard Software market holds significant potential for future growth, driven by ongoing technological advancements, increasing digital transformation initiatives, and the expanding adoption of hybrid work models. Strategic opportunities exist in developing innovative features, strengthening integrations with other productivity tools, and focusing on niche market segments. The market's future is bright, with continued expansion expected across various regions and industries.
Collaborative Whiteboard Software Market Segmentation
-
1. Operating System
- 1.1. Windows and Web
- 1.2. iOS
- 1.3. Android
-
2. Deployment Mode
- 2.1. On-premise
- 2.2. Cloud
-
3. Organization Size
- 3.1. Large Enterprises
- 3.2. Small and Medium Enterprises
-
4. End-user Vertical
- 4.1. BFSI
- 4.2. Healthcare
- 4.3. Education
- 4.4. IT and Telecommunications
- 4.5. Other End-user Verticals
Collaborative Whiteboard Software Market Segmentation By Geography
- 1. North America
- 2. Europe
- 3. Asia Pacific
- 4. Latin America
- 5. Middle East and Africa
Collaborative Whiteboard Software Market REPORT HIGHLIGHTS
| Aspects | Details |
|---|---|
| Study Period | 2019-2033 |
| Base Year | 2024 |
| Estimated Year | 2025 |
| Forecast Period | 2025-2033 |
| Historical Period | 2019-2024 |
| Growth Rate | CAGR of 20.85% from 2019-2033 |
| Segmentation |
|
Table of Contents
- 1. Introduction
- 1.1. Research Scope
- 1.2. Market Segmentation
- 1.3. Research Methodology
- 1.4. Definitions and Assumptions
- 2. Executive Summary
- 2.1. Introduction
- 3. Market Dynamics
- 3.1. Introduction
- 3.2. Market Drivers
- 3.2.1. Increasing Remote Working and Real-time Collaboration in Organizations
- 3.3. Market Restrains
- 3.3.1. Lack of Awareness and Digital Resources in Developing Countries
- 3.4. Market Trends
- 3.4.1. Increasing Remote Working and Real-time Collaboration in Organizations
- 4. Market Factor Analysis
- 4.1. Porters Five Forces
- 4.2. Supply/Value Chain
- 4.3. PESTEL analysis
- 4.4. Market Entropy
- 4.5. Patent/Trademark Analysis
- 5. Global Collaborative Whiteboard Software Market Analysis, Insights and Forecast, 2019-2031
- 5.1. Market Analysis, Insights and Forecast - by Operating System
- 5.1.1. Windows and Web
- 5.1.2. iOS
- 5.1.3. Android
- 5.2. Market Analysis, Insights and Forecast - by Deployment Mode
- 5.2.1. On-premise
- 5.2.2. Cloud
- 5.3. Market Analysis, Insights and Forecast - by Organization Size
- 5.3.1. Large Enterprises
- 5.3.2. Small and Medium Enterprises
- 5.4. Market Analysis, Insights and Forecast - by End-user Vertical
- 5.4.1. BFSI
- 5.4.2. Healthcare
- 5.4.3. Education
- 5.4.4. IT and Telecommunications
- 5.4.5. Other End-user Verticals
- 5.5. Market Analysis, Insights and Forecast - by Region
- 5.5.1. North America
- 5.5.2. Europe
- 5.5.3. Asia Pacific
- 5.5.4. Latin America
- 5.5.5. Middle East and Africa
- 5.1. Market Analysis, Insights and Forecast - by Operating System
- 6. North America Collaborative Whiteboard Software Market Analysis, Insights and Forecast, 2019-2031
- 6.1. Market Analysis, Insights and Forecast - by Operating System
- 6.1.1. Windows and Web
- 6.1.2. iOS
- 6.1.3. Android
- 6.2. Market Analysis, Insights and Forecast - by Deployment Mode
- 6.2.1. On-premise
- 6.2.2. Cloud
- 6.3. Market Analysis, Insights and Forecast - by Organization Size
- 6.3.1. Large Enterprises
- 6.3.2. Small and Medium Enterprises
- 6.4. Market Analysis, Insights and Forecast - by End-user Vertical
- 6.4.1. BFSI
- 6.4.2. Healthcare
- 6.4.3. Education
- 6.4.4. IT and Telecommunications
- 6.4.5. Other End-user Verticals
- 6.1. Market Analysis, Insights and Forecast - by Operating System
- 7. Europe Collaborative Whiteboard Software Market Analysis, Insights and Forecast, 2019-2031
- 7.1. Market Analysis, Insights and Forecast - by Operating System
- 7.1.1. Windows and Web
- 7.1.2. iOS
- 7.1.3. Android
- 7.2. Market Analysis, Insights and Forecast - by Deployment Mode
- 7.2.1. On-premise
- 7.2.2. Cloud
- 7.3. Market Analysis, Insights and Forecast - by Organization Size
- 7.3.1. Large Enterprises
- 7.3.2. Small and Medium Enterprises
- 7.4. Market Analysis, Insights and Forecast - by End-user Vertical
- 7.4.1. BFSI
- 7.4.2. Healthcare
- 7.4.3. Education
- 7.4.4. IT and Telecommunications
- 7.4.5. Other End-user Verticals
- 7.1. Market Analysis, Insights and Forecast - by Operating System
- 8. Asia Pacific Collaborative Whiteboard Software Market Analysis, Insights and Forecast, 2019-2031
- 8.1. Market Analysis, Insights and Forecast - by Operating System
- 8.1.1. Windows and Web
- 8.1.2. iOS
- 8.1.3. Android
- 8.2. Market Analysis, Insights and Forecast - by Deployment Mode
- 8.2.1. On-premise
- 8.2.2. Cloud
- 8.3. Market Analysis, Insights and Forecast - by Organization Size
- 8.3.1. Large Enterprises
- 8.3.2. Small and Medium Enterprises
- 8.4. Market Analysis, Insights and Forecast - by End-user Vertical
- 8.4.1. BFSI
- 8.4.2. Healthcare
- 8.4.3. Education
- 8.4.4. IT and Telecommunications
- 8.4.5. Other End-user Verticals
- 8.1. Market Analysis, Insights and Forecast - by Operating System
- 9. Latin America Collaborative Whiteboard Software Market Analysis, Insights and Forecast, 2019-2031
- 9.1. Market Analysis, Insights and Forecast - by Operating System
- 9.1.1. Windows and Web
- 9.1.2. iOS
- 9.1.3. Android
- 9.2. Market Analysis, Insights and Forecast - by Deployment Mode
- 9.2.1. On-premise
- 9.2.2. Cloud
- 9.3. Market Analysis, Insights and Forecast - by Organization Size
- 9.3.1. Large Enterprises
- 9.3.2. Small and Medium Enterprises
- 9.4. Market Analysis, Insights and Forecast - by End-user Vertical
- 9.4.1. BFSI
- 9.4.2. Healthcare
- 9.4.3. Education
- 9.4.4. IT and Telecommunications
- 9.4.5. Other End-user Verticals
- 9.1. Market Analysis, Insights and Forecast - by Operating System
- 10. Middle East and Africa Collaborative Whiteboard Software Market Analysis, Insights and Forecast, 2019-2031
- 10.1. Market Analysis, Insights and Forecast - by Operating System
- 10.1.1. Windows and Web
- 10.1.2. iOS
- 10.1.3. Android
- 10.2. Market Analysis, Insights and Forecast - by Deployment Mode
- 10.2.1. On-premise
- 10.2.2. Cloud
- 10.3. Market Analysis, Insights and Forecast - by Organization Size
- 10.3.1. Large Enterprises
- 10.3.2. Small and Medium Enterprises
- 10.4. Market Analysis, Insights and Forecast - by End-user Vertical
- 10.4.1. BFSI
- 10.4.2. Healthcare
- 10.4.3. Education
- 10.4.4. IT and Telecommunications
- 10.4.5. Other End-user Verticals
- 10.1. Market Analysis, Insights and Forecast - by Operating System
- 11. North America Collaborative Whiteboard Software Market Analysis, Insights and Forecast, 2019-2031
- 11.1. Market Analysis, Insights and Forecast - By Country/Sub-region
- 11.1.1 United States
- 11.1.2 Canada
- 11.1.3 Mexico
- 12. Europe Collaborative Whiteboard Software Market Analysis, Insights and Forecast, 2019-2031
- 12.1. Market Analysis, Insights and Forecast - By Country/Sub-region
- 12.1.1 Germany
- 12.1.2 United Kingdom
- 12.1.3 France
- 12.1.4 Spain
- 12.1.5 Italy
- 12.1.6 Spain
- 12.1.7 Belgium
- 12.1.8 Netherland
- 12.1.9 Nordics
- 12.1.10 Rest of Europe
- 13. Asia Pacific Collaborative Whiteboard Software Market Analysis, Insights and Forecast, 2019-2031
- 13.1. Market Analysis, Insights and Forecast - By Country/Sub-region
- 13.1.1 China
- 13.1.2 Japan
- 13.1.3 India
- 13.1.4 South Korea
- 13.1.5 Southeast Asia
- 13.1.6 Australia
- 13.1.7 Indonesia
- 13.1.8 Phillipes
- 13.1.9 Singapore
- 13.1.10 Thailandc
- 13.1.11 Rest of Asia Pacific
- 14. South America Collaborative Whiteboard Software Market Analysis, Insights and Forecast, 2019-2031
- 14.1. Market Analysis, Insights and Forecast - By Country/Sub-region
- 14.1.1 Brazil
- 14.1.2 Argentina
- 14.1.3 Peru
- 14.1.4 Chile
- 14.1.5 Colombia
- 14.1.6 Ecuador
- 14.1.7 Venezuela
- 14.1.8 Rest of South America
- 15. North America Collaborative Whiteboard Software Market Analysis, Insights and Forecast, 2019-2031
- 15.1. Market Analysis, Insights and Forecast - By Country/Sub-region
- 15.1.1 United States
- 15.1.2 Canada
- 15.1.3 Mexico
- 16. MEA Collaborative Whiteboard Software Market Analysis, Insights and Forecast, 2019-2031
- 16.1. Market Analysis, Insights and Forecast - By Country/Sub-region
- 16.1.1 United Arab Emirates
- 16.1.2 Saudi Arabia
- 16.1.3 South Africa
- 16.1.4 Rest of Middle East and Africa
- 17. Competitive Analysis
- 17.1. Global Market Share Analysis 2024
- 17.2. Company Profiles
- 17.2.1 Invisionapp Inc
- 17.2.1.1. Overview
- 17.2.1.2. Products
- 17.2.1.3. SWOT Analysis
- 17.2.1.4. Recent Developments
- 17.2.1.5. Financials (Based on Availability)
- 17.2.2 Trello Inc (Atlassian Corporation PLC)
- 17.2.2.1. Overview
- 17.2.2.2. Products
- 17.2.2.3. SWOT Analysis
- 17.2.2.4. Recent Developments
- 17.2.2.5. Financials (Based on Availability)
- 17.2.3 Ayoa (Opengenius Limited)
- 17.2.3.1. Overview
- 17.2.3.2. Products
- 17.2.3.3. SWOT Analysis
- 17.2.3.4. Recent Developments
- 17.2.3.5. Financials (Based on Availability)
- 17.2.4 Groupmap Technology Pty Ltd
- 17.2.4.1. Overview
- 17.2.4.2. Products
- 17.2.4.3. SWOT Analysis
- 17.2.4.4. Recent Developments
- 17.2.4.5. Financials (Based on Availability)
- 17.2.5 Figma Inc
- 17.2.5.1. Overview
- 17.2.5.2. Products
- 17.2.5.3. SWOT Analysis
- 17.2.5.4. Recent Developments
- 17.2.5.5. Financials (Based on Availability)
- 17.2.6 Stormboard
- 17.2.6.1. Overview
- 17.2.6.2. Products
- 17.2.6.3. SWOT Analysis
- 17.2.6.4. Recent Developments
- 17.2.6.5. Financials (Based on Availability)
- 17.2.7 Conceptboard
- 17.2.7.1. Overview
- 17.2.7.2. Products
- 17.2.7.3. SWOT Analysis
- 17.2.7.4. Recent Developments
- 17.2.7.5. Financials (Based on Availability)
- 17.2.8 Vizetto
- 17.2.8.1. Overview
- 17.2.8.2. Products
- 17.2.8.3. SWOT Analysis
- 17.2.8.4. Recent Developments
- 17.2.8.5. Financials (Based on Availability)
- 17.2.9 Limnu
- 17.2.9.1. Overview
- 17.2.9.2. Products
- 17.2.9.3. SWOT Analysis
- 17.2.9.4. Recent Developments
- 17.2.9.5. Financials (Based on Availability)
- 17.2.10 Collaboard
- 17.2.10.1. Overview
- 17.2.10.2. Products
- 17.2.10.3. SWOT Analysis
- 17.2.10.4. Recent Developments
- 17.2.10.5. Financials (Based on Availability)
- 17.2.11 Lucidspark
- 17.2.11.1. Overview
- 17.2.11.2. Products
- 17.2.11.3. SWOT Analysis
- 17.2.11.4. Recent Developments
- 17.2.11.5. Financials (Based on Availability)
- 17.2.12 Cisco Systems Inc
- 17.2.12.1. Overview
- 17.2.12.2. Products
- 17.2.12.3. SWOT Analysis
- 17.2.12.4. Recent Developments
- 17.2.12.5. Financials (Based on Availability)
- 17.2.13 Eztalks
- 17.2.13.1. Overview
- 17.2.13.2. Products
- 17.2.13.3. SWOT Analysis
- 17.2.13.4. Recent Developments
- 17.2.13.5. Financials (Based on Availability)
- 17.2.14 Microsoft Corporation
- 17.2.14.1. Overview
- 17.2.14.2. Products
- 17.2.14.3. SWOT Analysis
- 17.2.14.4. Recent Developments
- 17.2.14.5. Financials (Based on Availability)
- 17.2.15 Beecanvas
- 17.2.15.1. Overview
- 17.2.15.2. Products
- 17.2.15.3. SWOT Analysis
- 17.2.15.4. Recent Developments
- 17.2.15.5. Financials (Based on Availability)
- 17.2.16 Miro
- 17.2.16.1. Overview
- 17.2.16.2. Products
- 17.2.16.3. SWOT Analysis
- 17.2.16.4. Recent Developments
- 17.2.16.5. Financials (Based on Availability)
- 17.2.17 Explain Everything
- 17.2.17.1. Overview
- 17.2.17.2. Products
- 17.2.17.3. SWOT Analysis
- 17.2.17.4. Recent Developments
- 17.2.17.5. Financials (Based on Availability)
- 17.2.18 Edrawmind (Wondershare)
- 17.2.18.1. Overview
- 17.2.18.2. Products
- 17.2.18.3. SWOT Analysis
- 17.2.18.4. Recent Developments
- 17.2.18.5. Financials (Based on Availability)
- 17.2.19 Twiddla
- 17.2.19.1. Overview
- 17.2.19.2. Products
- 17.2.19.3. SWOT Analysis
- 17.2.19.4. Recent Developments
- 17.2.19.5. Financials (Based on Availability)
- 17.2.20 Ziteboard - Overview
- 17.2.20.1. Overview
- 17.2.20.2. Products
- 17.2.20.3. SWOT Analysis
- 17.2.20.4. Recent Developments
- 17.2.20.5. Financials (Based on Availability)
- 17.2.21 Bluescape
- 17.2.21.1. Overview
- 17.2.21.2. Products
- 17.2.21.3. SWOT Analysis
- 17.2.21.4. Recent Developments
- 17.2.21.5. Financials (Based on Availability)
- 17.2.22 Google Jamboard (Alphabet Inc )
- 17.2.22.1. Overview
- 17.2.22.2. Products
- 17.2.22.3. SWOT Analysis
- 17.2.22.4. Recent Developments
- 17.2.22.5. Financials (Based on Availability)
- 17.2.23 Zira Technologies Inc
- 17.2.23.1. Overview
- 17.2.23.2. Products
- 17.2.23.3. SWOT Analysis
- 17.2.23.4. Recent Developments
- 17.2.23.5. Financials (Based on Availability)
- 17.2.24 Zoom Video Communications
- 17.2.24.1. Overview
- 17.2.24.2. Products
- 17.2.24.3. SWOT Analysis
- 17.2.24.4. Recent Developments
- 17.2.24.5. Financials (Based on Availability)
- 17.2.25 Mural
- 17.2.25.1. Overview
- 17.2.25.2. Products
- 17.2.25.3. SWOT Analysis
- 17.2.25.4. Recent Developments
- 17.2.25.5. Financials (Based on Availability)
- 17.2.1 Invisionapp Inc
List of Figures
- Figure 1: Global Collaborative Whiteboard Software Market Revenue Breakdown (Million, %) by Region 2024 & 2032
- Figure 2: North America Collaborative Whiteboard Software Market Revenue (Million), by Country 2024 & 2032
- Figure 3: North America Collaborative Whiteboard Software Market Revenue Share (%), by Country 2024 & 2032
- Figure 4: Europe Collaborative Whiteboard Software Market Revenue (Million), by Country 2024 & 2032
- Figure 5: Europe Collaborative Whiteboard Software Market Revenue Share (%), by Country 2024 & 2032
- Figure 6: Asia Pacific Collaborative Whiteboard Software Market Revenue (Million), by Country 2024 & 2032
- Figure 7: Asia Pacific Collaborative Whiteboard Software Market Revenue Share (%), by Country 2024 & 2032
- Figure 8: South America Collaborative Whiteboard Software Market Revenue (Million), by Country 2024 & 2032
- Figure 9: South America Collaborative Whiteboard Software Market Revenue Share (%), by Country 2024 & 2032
- Figure 10: North America Collaborative Whiteboard Software Market Revenue (Million), by Country 2024 & 2032
- Figure 11: North America Collaborative Whiteboard Software Market Revenue Share (%), by Country 2024 & 2032
- Figure 12: MEA Collaborative Whiteboard Software Market Revenue (Million), by Country 2024 & 2032
- Figure 13: MEA Collaborative Whiteboard Software Market Revenue Share (%), by Country 2024 & 2032
- Figure 14: North America Collaborative Whiteboard Software Market Revenue (Million), by Operating System 2024 & 2032
- Figure 15: North America Collaborative Whiteboard Software Market Revenue Share (%), by Operating System 2024 & 2032
- Figure 16: North America Collaborative Whiteboard Software Market Revenue (Million), by Deployment Mode 2024 & 2032
- Figure 17: North America Collaborative Whiteboard Software Market Revenue Share (%), by Deployment Mode 2024 & 2032
- Figure 18: North America Collaborative Whiteboard Software Market Revenue (Million), by Organization Size 2024 & 2032
- Figure 19: North America Collaborative Whiteboard Software Market Revenue Share (%), by Organization Size 2024 & 2032
- Figure 20: North America Collaborative Whiteboard Software Market Revenue (Million), by End-user Vertical 2024 & 2032
- Figure 21: North America Collaborative Whiteboard Software Market Revenue Share (%), by End-user Vertical 2024 & 2032
- Figure 22: North America Collaborative Whiteboard Software Market Revenue (Million), by Country 2024 & 2032
- Figure 23: North America Collaborative Whiteboard Software Market Revenue Share (%), by Country 2024 & 2032
- Figure 24: Europe Collaborative Whiteboard Software Market Revenue (Million), by Operating System 2024 & 2032
- Figure 25: Europe Collaborative Whiteboard Software Market Revenue Share (%), by Operating System 2024 & 2032
- Figure 26: Europe Collaborative Whiteboard Software Market Revenue (Million), by Deployment Mode 2024 & 2032
- Figure 27: Europe Collaborative Whiteboard Software Market Revenue Share (%), by Deployment Mode 2024 & 2032
- Figure 28: Europe Collaborative Whiteboard Software Market Revenue (Million), by Organization Size 2024 & 2032
- Figure 29: Europe Collaborative Whiteboard Software Market Revenue Share (%), by Organization Size 2024 & 2032
- Figure 30: Europe Collaborative Whiteboard Software Market Revenue (Million), by End-user Vertical 2024 & 2032
- Figure 31: Europe Collaborative Whiteboard Software Market Revenue Share (%), by End-user Vertical 2024 & 2032
- Figure 32: Europe Collaborative Whiteboard Software Market Revenue (Million), by Country 2024 & 2032
- Figure 33: Europe Collaborative Whiteboard Software Market Revenue Share (%), by Country 2024 & 2032
- Figure 34: Asia Pacific Collaborative Whiteboard Software Market Revenue (Million), by Operating System 2024 & 2032
- Figure 35: Asia Pacific Collaborative Whiteboard Software Market Revenue Share (%), by Operating System 2024 & 2032
- Figure 36: Asia Pacific Collaborative Whiteboard Software Market Revenue (Million), by Deployment Mode 2024 & 2032
- Figure 37: Asia Pacific Collaborative Whiteboard Software Market Revenue Share (%), by Deployment Mode 2024 & 2032
- Figure 38: Asia Pacific Collaborative Whiteboard Software Market Revenue (Million), by Organization Size 2024 & 2032
- Figure 39: Asia Pacific Collaborative Whiteboard Software Market Revenue Share (%), by Organization Size 2024 & 2032
- Figure 40: Asia Pacific Collaborative Whiteboard Software Market Revenue (Million), by End-user Vertical 2024 & 2032
- Figure 41: Asia Pacific Collaborative Whiteboard Software Market Revenue Share (%), by End-user Vertical 2024 & 2032
- Figure 42: Asia Pacific Collaborative Whiteboard Software Market Revenue (Million), by Country 2024 & 2032
- Figure 43: Asia Pacific Collaborative Whiteboard Software Market Revenue Share (%), by Country 2024 & 2032
- Figure 44: Latin America Collaborative Whiteboard Software Market Revenue (Million), by Operating System 2024 & 2032
- Figure 45: Latin America Collaborative Whiteboard Software Market Revenue Share (%), by Operating System 2024 & 2032
- Figure 46: Latin America Collaborative Whiteboard Software Market Revenue (Million), by Deployment Mode 2024 & 2032
- Figure 47: Latin America Collaborative Whiteboard Software Market Revenue Share (%), by Deployment Mode 2024 & 2032
- Figure 48: Latin America Collaborative Whiteboard Software Market Revenue (Million), by Organization Size 2024 & 2032
- Figure 49: Latin America Collaborative Whiteboard Software Market Revenue Share (%), by Organization Size 2024 & 2032
- Figure 50: Latin America Collaborative Whiteboard Software Market Revenue (Million), by End-user Vertical 2024 & 2032
- Figure 51: Latin America Collaborative Whiteboard Software Market Revenue Share (%), by End-user Vertical 2024 & 2032
- Figure 52: Latin America Collaborative Whiteboard Software Market Revenue (Million), by Country 2024 & 2032
- Figure 53: Latin America Collaborative Whiteboard Software Market Revenue Share (%), by Country 2024 & 2032
- Figure 54: Middle East and Africa Collaborative Whiteboard Software Market Revenue (Million), by Operating System 2024 & 2032
- Figure 55: Middle East and Africa Collaborative Whiteboard Software Market Revenue Share (%), by Operating System 2024 & 2032
- Figure 56: Middle East and Africa Collaborative Whiteboard Software Market Revenue (Million), by Deployment Mode 2024 & 2032
- Figure 57: Middle East and Africa Collaborative Whiteboard Software Market Revenue Share (%), by Deployment Mode 2024 & 2032
- Figure 58: Middle East and Africa Collaborative Whiteboard Software Market Revenue (Million), by Organization Size 2024 & 2032
- Figure 59: Middle East and Africa Collaborative Whiteboard Software Market Revenue Share (%), by Organization Size 2024 & 2032
- Figure 60: Middle East and Africa Collaborative Whiteboard Software Market Revenue (Million), by End-user Vertical 2024 & 2032
- Figure 61: Middle East and Africa Collaborative Whiteboard Software Market Revenue Share (%), by End-user Vertical 2024 & 2032
- Figure 62: Middle East and Africa Collaborative Whiteboard Software Market Revenue (Million), by Country 2024 & 2032
- Figure 63: Middle East and Africa Collaborative Whiteboard Software Market Revenue Share (%), by Country 2024 & 2032
List of Tables
- Table 1: Global Collaborative Whiteboard Software Market Revenue Million Forecast, by Region 2019 & 2032
- Table 2: Global Collaborative Whiteboard Software Market Revenue Million Forecast, by Operating System 2019 & 2032
- Table 3: Global Collaborative Whiteboard Software Market Revenue Million Forecast, by Deployment Mode 2019 & 2032
- Table 4: Global Collaborative Whiteboard Software Market Revenue Million Forecast, by Organization Size 2019 & 2032
- Table 5: Global Collaborative Whiteboard Software Market Revenue Million Forecast, by End-user Vertical 2019 & 2032
- Table 6: Global Collaborative Whiteboard Software Market Revenue Million Forecast, by Region 2019 & 2032
- Table 7: Global Collaborative Whiteboard Software Market Revenue Million Forecast, by Country 2019 & 2032
- Table 8: United States Collaborative Whiteboard Software Market Revenue (Million) Forecast, by Application 2019 & 2032
- Table 9: Canada Collaborative Whiteboard Software Market Revenue (Million) Forecast, by Application 2019 & 2032
- Table 10: Mexico Collaborative Whiteboard Software Market Revenue (Million) Forecast, by Application 2019 & 2032
- Table 11: Global Collaborative Whiteboard Software Market Revenue Million Forecast, by Country 2019 & 2032
- Table 12: Germany Collaborative Whiteboard Software Market Revenue (Million) Forecast, by Application 2019 & 2032
- Table 13: United Kingdom Collaborative Whiteboard Software Market Revenue (Million) Forecast, by Application 2019 & 2032
- Table 14: France Collaborative Whiteboard Software Market Revenue (Million) Forecast, by Application 2019 & 2032
- Table 15: Spain Collaborative Whiteboard Software Market Revenue (Million) Forecast, by Application 2019 & 2032
- Table 16: Italy Collaborative Whiteboard Software Market Revenue (Million) Forecast, by Application 2019 & 2032
- Table 17: Spain Collaborative Whiteboard Software Market Revenue (Million) Forecast, by Application 2019 & 2032
- Table 18: Belgium Collaborative Whiteboard Software Market Revenue (Million) Forecast, by Application 2019 & 2032
- Table 19: Netherland Collaborative Whiteboard Software Market Revenue (Million) Forecast, by Application 2019 & 2032
- Table 20: Nordics Collaborative Whiteboard Software Market Revenue (Million) Forecast, by Application 2019 & 2032
- Table 21: Rest of Europe Collaborative Whiteboard Software Market Revenue (Million) Forecast, by Application 2019 & 2032
- Table 22: Global Collaborative Whiteboard Software Market Revenue Million Forecast, by Country 2019 & 2032
- Table 23: China Collaborative Whiteboard Software Market Revenue (Million) Forecast, by Application 2019 & 2032
- Table 24: Japan Collaborative Whiteboard Software Market Revenue (Million) Forecast, by Application 2019 & 2032
- Table 25: India Collaborative Whiteboard Software Market Revenue (Million) Forecast, by Application 2019 & 2032
- Table 26: South Korea Collaborative Whiteboard Software Market Revenue (Million) Forecast, by Application 2019 & 2032
- Table 27: Southeast Asia Collaborative Whiteboard Software Market Revenue (Million) Forecast, by Application 2019 & 2032
- Table 28: Australia Collaborative Whiteboard Software Market Revenue (Million) Forecast, by Application 2019 & 2032
- Table 29: Indonesia Collaborative Whiteboard Software Market Revenue (Million) Forecast, by Application 2019 & 2032
- Table 30: Phillipes Collaborative Whiteboard Software Market Revenue (Million) Forecast, by Application 2019 & 2032
- Table 31: Singapore Collaborative Whiteboard Software Market Revenue (Million) Forecast, by Application 2019 & 2032
- Table 32: Thailandc Collaborative Whiteboard Software Market Revenue (Million) Forecast, by Application 2019 & 2032
- Table 33: Rest of Asia Pacific Collaborative Whiteboard Software Market Revenue (Million) Forecast, by Application 2019 & 2032
- Table 34: Global Collaborative Whiteboard Software Market Revenue Million Forecast, by Country 2019 & 2032
- Table 35: Brazil Collaborative Whiteboard Software Market Revenue (Million) Forecast, by Application 2019 & 2032
- Table 36: Argentina Collaborative Whiteboard Software Market Revenue (Million) Forecast, by Application 2019 & 2032
- Table 37: Peru Collaborative Whiteboard Software Market Revenue (Million) Forecast, by Application 2019 & 2032
- Table 38: Chile Collaborative Whiteboard Software Market Revenue (Million) Forecast, by Application 2019 & 2032
- Table 39: Colombia Collaborative Whiteboard Software Market Revenue (Million) Forecast, by Application 2019 & 2032
- Table 40: Ecuador Collaborative Whiteboard Software Market Revenue (Million) Forecast, by Application 2019 & 2032
- Table 41: Venezuela Collaborative Whiteboard Software Market Revenue (Million) Forecast, by Application 2019 & 2032
- Table 42: Rest of South America Collaborative Whiteboard Software Market Revenue (Million) Forecast, by Application 2019 & 2032
- Table 43: Global Collaborative Whiteboard Software Market Revenue Million Forecast, by Country 2019 & 2032
- Table 44: United States Collaborative Whiteboard Software Market Revenue (Million) Forecast, by Application 2019 & 2032
- Table 45: Canada Collaborative Whiteboard Software Market Revenue (Million) Forecast, by Application 2019 & 2032
- Table 46: Mexico Collaborative Whiteboard Software Market Revenue (Million) Forecast, by Application 2019 & 2032
- Table 47: Global Collaborative Whiteboard Software Market Revenue Million Forecast, by Country 2019 & 2032
- Table 48: United Arab Emirates Collaborative Whiteboard Software Market Revenue (Million) Forecast, by Application 2019 & 2032
- Table 49: Saudi Arabia Collaborative Whiteboard Software Market Revenue (Million) Forecast, by Application 2019 & 2032
- Table 50: South Africa Collaborative Whiteboard Software Market Revenue (Million) Forecast, by Application 2019 & 2032
- Table 51: Rest of Middle East and Africa Collaborative Whiteboard Software Market Revenue (Million) Forecast, by Application 2019 & 2032
- Table 52: Global Collaborative Whiteboard Software Market Revenue Million Forecast, by Operating System 2019 & 2032
- Table 53: Global Collaborative Whiteboard Software Market Revenue Million Forecast, by Deployment Mode 2019 & 2032
- Table 54: Global Collaborative Whiteboard Software Market Revenue Million Forecast, by Organization Size 2019 & 2032
- Table 55: Global Collaborative Whiteboard Software Market Revenue Million Forecast, by End-user Vertical 2019 & 2032
- Table 56: Global Collaborative Whiteboard Software Market Revenue Million Forecast, by Country 2019 & 2032
- Table 57: Global Collaborative Whiteboard Software Market Revenue Million Forecast, by Operating System 2019 & 2032
- Table 58: Global Collaborative Whiteboard Software Market Revenue Million Forecast, by Deployment Mode 2019 & 2032
- Table 59: Global Collaborative Whiteboard Software Market Revenue Million Forecast, by Organization Size 2019 & 2032
- Table 60: Global Collaborative Whiteboard Software Market Revenue Million Forecast, by End-user Vertical 2019 & 2032
- Table 61: Global Collaborative Whiteboard Software Market Revenue Million Forecast, by Country 2019 & 2032
- Table 62: Global Collaborative Whiteboard Software Market Revenue Million Forecast, by Operating System 2019 & 2032
- Table 63: Global Collaborative Whiteboard Software Market Revenue Million Forecast, by Deployment Mode 2019 & 2032
- Table 64: Global Collaborative Whiteboard Software Market Revenue Million Forecast, by Organization Size 2019 & 2032
- Table 65: Global Collaborative Whiteboard Software Market Revenue Million Forecast, by End-user Vertical 2019 & 2032
- Table 66: Global Collaborative Whiteboard Software Market Revenue Million Forecast, by Country 2019 & 2032
- Table 67: Global Collaborative Whiteboard Software Market Revenue Million Forecast, by Operating System 2019 & 2032
- Table 68: Global Collaborative Whiteboard Software Market Revenue Million Forecast, by Deployment Mode 2019 & 2032
- Table 69: Global Collaborative Whiteboard Software Market Revenue Million Forecast, by Organization Size 2019 & 2032
- Table 70: Global Collaborative Whiteboard Software Market Revenue Million Forecast, by End-user Vertical 2019 & 2032
- Table 71: Global Collaborative Whiteboard Software Market Revenue Million Forecast, by Country 2019 & 2032
- Table 72: Global Collaborative Whiteboard Software Market Revenue Million Forecast, by Operating System 2019 & 2032
- Table 73: Global Collaborative Whiteboard Software Market Revenue Million Forecast, by Deployment Mode 2019 & 2032
- Table 74: Global Collaborative Whiteboard Software Market Revenue Million Forecast, by Organization Size 2019 & 2032
- Table 75: Global Collaborative Whiteboard Software Market Revenue Million Forecast, by End-user Vertical 2019 & 2032
- Table 76: Global Collaborative Whiteboard Software Market Revenue Million Forecast, by Country 2019 & 2032
Frequently Asked Questions
1. What is the projected Compound Annual Growth Rate (CAGR) of the Collaborative Whiteboard Software Market?
The projected CAGR is approximately 20.85%.
2. Which companies are prominent players in the Collaborative Whiteboard Software Market?
Key companies in the market include Invisionapp Inc, Trello Inc (Atlassian Corporation PLC), Ayoa (Opengenius Limited), Groupmap Technology Pty Ltd, Figma Inc, Stormboard, Conceptboard, Vizetto, Limnu, Collaboard, Lucidspark, Cisco Systems Inc, Eztalks, Microsoft Corporation, Beecanvas, Miro, Explain Everything, Edrawmind (Wondershare), Twiddla, Ziteboard - Overview, Bluescape, Google Jamboard (Alphabet Inc ), Zira Technologies Inc, Zoom Video Communications, Mural.
3. What are the main segments of the Collaborative Whiteboard Software Market?
The market segments include Operating System, Deployment Mode, Organization Size, End-user Vertical.
4. Can you provide details about the market size?
The market size is estimated to be USD 2.62 Million as of 2022.
5. What are some drivers contributing to market growth?
Increasing Remote Working and Real-time Collaboration in Organizations.
6. What are the notable trends driving market growth?
Increasing Remote Working and Real-time Collaboration in Organizations.
7. Are there any restraints impacting market growth?
Lack of Awareness and Digital Resources in Developing Countries.
8. Can you provide examples of recent developments in the market?
Dec 2022: Apple announced that the company launched Freeform, which includes the latest versions of iOS, iPadOS, and macOS. Users of Freeform may see, share, and discuss in one location without worrying about layouts or page widths by organizing and aesthetically organizing material on a flexible canvas.
9. What pricing options are available for accessing the report?
Pricing options include single-user, multi-user, and enterprise licenses priced at USD 4750, USD 5250, and USD 8750 respectively.
10. Is the market size provided in terms of value or volume?
The market size is provided in terms of value, measured in Million.
11. Are there any specific market keywords associated with the report?
Yes, the market keyword associated with the report is "Collaborative Whiteboard Software Market," which aids in identifying and referencing the specific market segment covered.
12. How do I determine which pricing option suits my needs best?
The pricing options vary based on user requirements and access needs. Individual users may opt for single-user licenses, while businesses requiring broader access may choose multi-user or enterprise licenses for cost-effective access to the report.
13. Are there any additional resources or data provided in the Collaborative Whiteboard Software Market report?
While the report offers comprehensive insights, it's advisable to review the specific contents or supplementary materials provided to ascertain if additional resources or data are available.
14. How can I stay updated on further developments or reports in the Collaborative Whiteboard Software Market?
To stay informed about further developments, trends, and reports in the Collaborative Whiteboard Software Market, consider subscribing to industry newsletters, following relevant companies and organizations, or regularly checking reputable industry news sources and publications.
Methodology
Step 1 - Identification of Relevant Samples Size from Population Database


Step 2 - Approaches for Defining Global Market Size (Value, Volume* & Price*)

Note*: In applicable scenarios
Step 3 - Data Sources
Primary Research
- Web Analytics
- Survey Reports
- Research Institute
- Latest Research Reports
- Opinion Leaders
Secondary Research
- Annual Reports
- White Paper
- Latest Press Release
- Industry Association
- Paid Database
- Investor Presentations

Step 4 - Data Triangulation
Involves using different sources of information in order to increase the validity of a study
These sources are likely to be stakeholders in a program - participants, other researchers, program staff, other community members, and so on.
Then we put all data in single framework & apply various statistical tools to find out the dynamic on the market.
During the analysis stage, feedback from the stakeholder groups would be compared to determine areas of agreement as well as areas of divergence


