
Key Insights
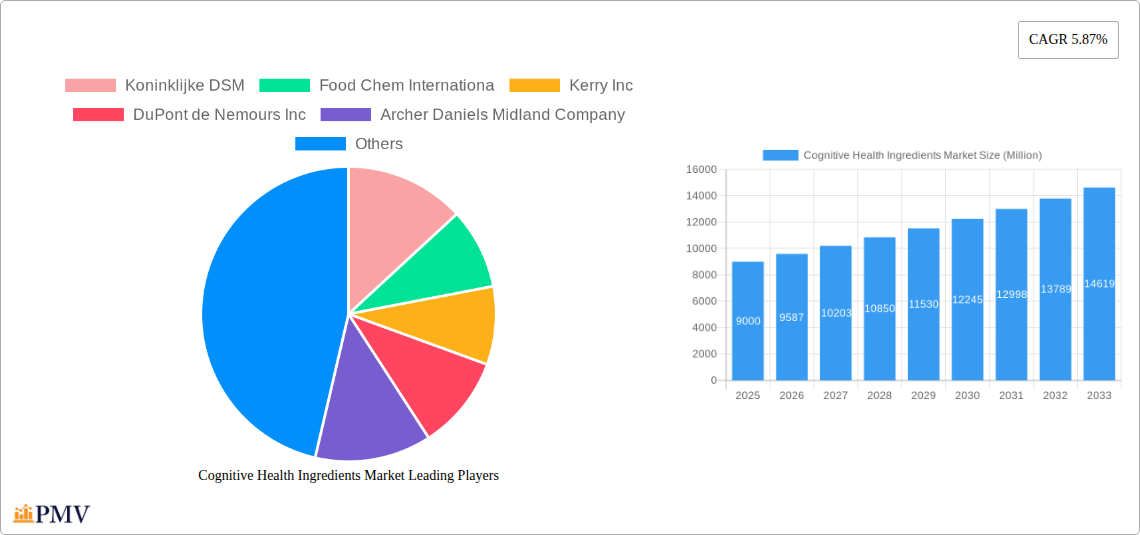
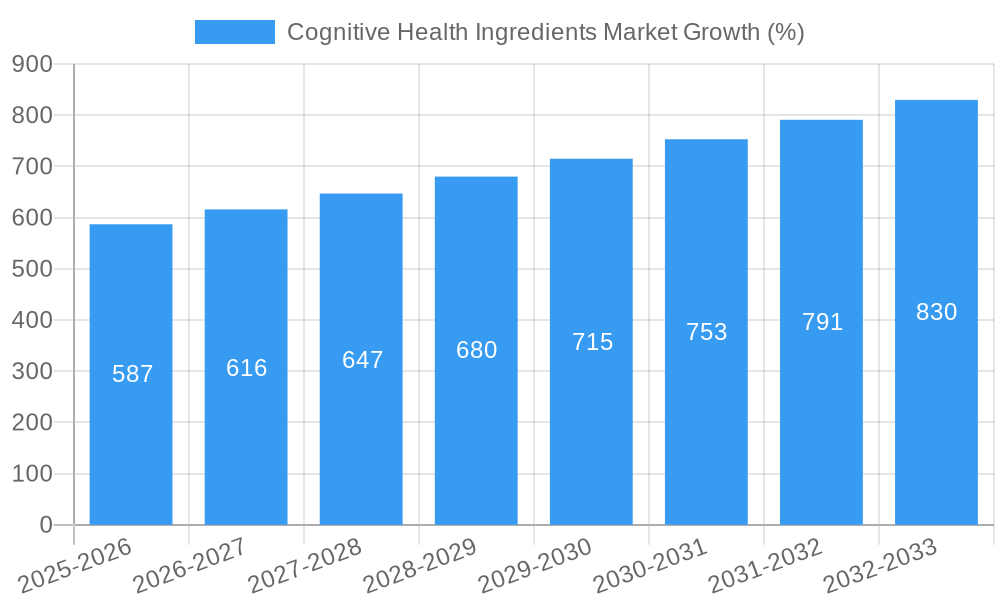
The Cognitive Health Ingredients market, currently valued at approximately $9 billion in 2025, is projected to experience robust growth, exhibiting a Compound Annual Growth Rate (CAGR) of 5.87% from 2025 to 2033. This expansion is driven by several key factors. The rising global prevalence of age-related cognitive decline, including Alzheimer's disease and dementia, fuels significant demand for effective cognitive enhancement solutions. Furthermore, increasing consumer awareness regarding the importance of brain health and proactive wellness strategies contributes to market growth. The incorporation of cognitive health ingredients into functional foods and beverages is gaining traction, offering convenient and accessible consumption methods. Product innovation, including the development of novel ingredients with enhanced efficacy and bioavailability, further propels market expansion. Significant investments in research and development are focusing on understanding the mechanisms of cognitive function and developing effective interventions, boosting market confidence and fueling growth. The market's segmentation, encompassing various ingredients like vitamins and minerals, omega-3 PUFAs, probiotics, and botanical extracts, caters to diverse consumer preferences and provides opportunities for specialized product development. The substantial market presence of key players like DSM, Kerry Inc., and BASF SE indicates a highly competitive but rapidly evolving landscape.
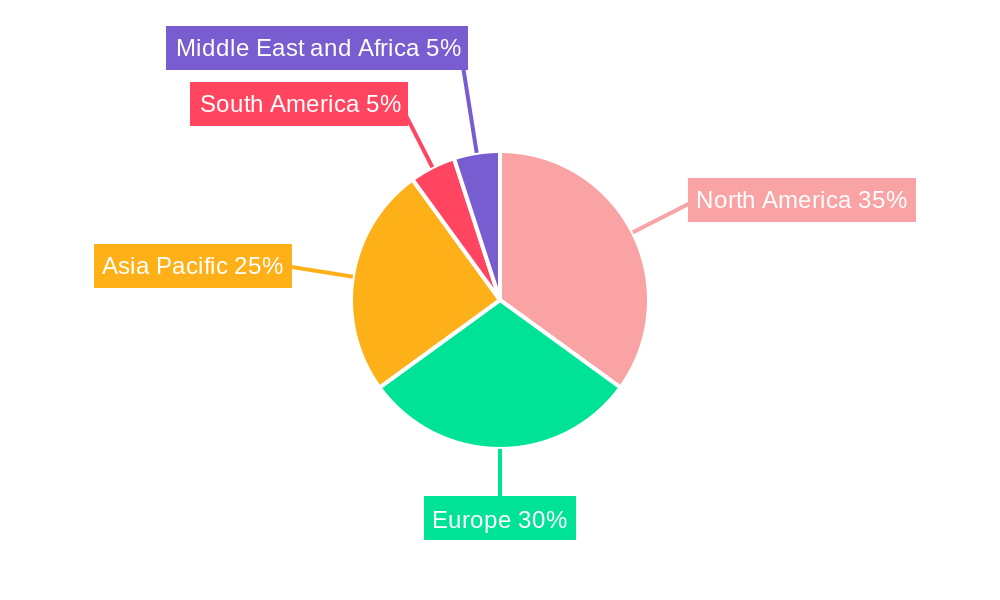
Geographically, North America and Europe currently hold a significant share of the market due to higher awareness, robust regulatory frameworks, and established research infrastructure. However, the Asia-Pacific region is expected to witness substantial growth in the coming years fueled by a burgeoning middle class, rising disposable incomes, and a growing elderly population. This presents promising growth prospects for companies focusing on regional expansion and tailored product offerings. While challenges exist, including stringent regulations and the need for robust clinical evidence to support efficacy claims, the overall market outlook for cognitive health ingredients remains positive, driven by an increasing global focus on brain health and wellness. The market's continued evolution will likely depend on further research, regulatory clarity, and successful innovation within the industry.
Cognitive Health Ingredients Market: A Comprehensive Report (2019-2033)
This comprehensive report provides an in-depth analysis of the Cognitive Health Ingredients market, offering valuable insights for businesses, investors, and researchers. Covering the period from 2019 to 2033, with a base year of 2025 and a forecast period of 2025-2033, this report meticulously examines market dynamics, growth drivers, challenges, and key players. The market size is projected to reach xx Million by 2033, exhibiting a CAGR of xx% during the forecast period.
Cognitive Health Ingredients Market Market Structure & Competitive Dynamics
The Cognitive Health Ingredients market is characterized by a moderately concentrated structure, with several major players holding significant market share. Koninklijke DSM, Food Chem International, Kerry Inc, DuPont de Nemours Inc, Archer Daniels Midland Company, BASF SE, Corbion N.V., Cargill Inc, Ingredion Incorporated, and Rousselot BV are key players shaping the market landscape. These companies compete based on product innovation, quality, pricing, and distribution networks. Market share analysis reveals that the top 5 players collectively hold approximately xx% of the market share in 2025. The market exhibits a dynamic innovation ecosystem, with continuous R&D efforts focusing on developing novel ingredients with enhanced cognitive benefits. Stringent regulatory frameworks, particularly concerning food safety and labeling, significantly influence market operations. The presence of substitute products, such as traditional herbal remedies, adds another layer of competitive pressure. End-user trends, including the growing demand for natural and functional ingredients, are driving market growth. The market has witnessed notable M&A activities in recent years, with deal values exceeding xx Million in the last five years. These acquisitions have primarily focused on expanding product portfolios, strengthening distribution networks, and gaining access to new technologies.
- Market Concentration: Moderately concentrated, with top 5 players holding xx% market share (2025).
- Innovation Ecosystem: Highly dynamic, focusing on novel ingredients and delivery systems.
- Regulatory Framework: Stringent regulations related to food safety and labeling.
- Product Substitutes: Traditional herbal remedies and other alternative health options.
- M&A Activity: Significant M&A activity, with deal values exceeding xx Million over the past five years.
Cognitive Health Ingredients Market Industry Trends & Insights
The Cognitive Health Ingredients market is experiencing robust growth driven by several factors. The rising global prevalence of age-related cognitive decline and neurodegenerative diseases is a significant market driver. Increasing consumer awareness of the importance of brain health and the potential benefits of cognitive-enhancing ingredients is fueling demand. Technological advancements in ingredient extraction, formulation, and delivery systems are enabling the development of more effective and convenient products. Changing consumer preferences towards natural and functional foods and supplements are also contributing to market growth. The market is witnessing significant technological disruptions, including the emergence of personalized nutrition solutions and the use of advanced analytical techniques to assess ingredient efficacy. The competitive landscape is characterized by intense competition among established players and emerging companies, leading to continuous product innovation and market expansion. The market is expected to witness a CAGR of xx% during the forecast period (2025-2033), with market penetration reaching xx% by 2033.
Dominant Markets & Segments in Cognitive Health Ingredients Market
The North American region currently holds the dominant position in the Cognitive Health Ingredients market, driven by high consumer awareness, strong regulatory support, and a robust healthcare infrastructure. Within the product type segment, Vitamins and Minerals currently hold the largest market share, owing to their established efficacy and widespread availability. Dietary Supplements represents the leading application segment due to the increasing preference for convenient and targeted cognitive health solutions.
Key Drivers for North America Dominance:
- High consumer awareness of cognitive health.
- Robust healthcare infrastructure and regulatory support.
- Strong R&D activities and investments in the sector.
Dominant Product Type: Vitamins and Minerals (due to established efficacy and availability)
Dominant Application: Dietary Supplements (due to convenience and targeted approach)
Detailed Dominance Analysis: The dominance of North America is further solidified by the high per capita income and increased disposable income, facilitating higher spending on health and wellness products. Similarly, the dominance of Vitamins and Minerals within the product type segment is rooted in their established scientific backing and relatively lower cost compared to other segments. The Dietary Supplements application segment benefits from its ease of use and direct targeted approach to cognitive enhancement, making it increasingly popular among consumers.
Cognitive Health Ingredients Market Product Innovations
Recent product innovations in the Cognitive Health Ingredients market center around the development of enhanced delivery systems (e.g., liposomal formulations for improved bioavailability) and novel ingredient combinations designed to address specific cognitive functions. Companies are focusing on developing products with clinically proven efficacy and improved safety profiles. This trend is driven by increasing consumer demand for evidence-based solutions and a growing emphasis on product transparency. The integration of digital technologies, such as personalized nutrition platforms, is gaining traction, enabling customized cognitive health solutions tailored to individual needs. The market is increasingly focusing on creating products that align with the holistic well-being approach, addressing multiple aspects of cognitive health in one formulation.
Report Segmentation & Scope
This report segments the Cognitive Health Ingredients market by product type (Vitamins and Minerals, Omega PUFA, Probiotics & Prebiotics, Amino Acids, Proteins & Peptides, Fibers, Botanical Extracts) and application (Functional Food and Beverages, Dietary Supplements). Each segment is thoroughly analyzed to understand its market size, growth projections, and competitive landscape. For example, the Vitamins and Minerals segment is projected to witness significant growth due to increasing demand for fortified foods and supplements. The Omega PUFA segment is experiencing growth attributed to increasing awareness of its benefits for brain function. The Probiotics & Prebiotics segment shows promise due to growing research linking gut health to cognitive function. Within the application segment, the Functional Food and Beverages segment is projected to see substantial growth due to increased consumer preference for healthy and functional food products, while the Dietary Supplements segment will continue to grow owing to the convenience and targeted nature of these products.
Key Drivers of Cognitive Health Ingredients Market Growth
The Cognitive Health Ingredients market is experiencing robust growth due to several key drivers. The escalating prevalence of age-related cognitive decline and neurodegenerative diseases is a primary driver, prompting increased demand for preventative and therapeutic solutions. Technological advancements in ingredient extraction, formulation, and delivery systems are enabling the development of more effective and convenient products. Growing consumer awareness about the link between diet and brain health is driving the adoption of cognitive-enhancing ingredients. Furthermore, favorable regulatory frameworks in certain regions are fostering market growth. The increasing investment in research and development by key players is also accelerating market expansion.
Challenges in the Cognitive Health Ingredients Market Sector
The Cognitive Health Ingredients market faces several challenges. Strict regulatory hurdles related to ingredient approval and labeling requirements can hinder product development and market entry. Supply chain disruptions and fluctuations in raw material prices can impact production costs and profitability. Intense competition among existing players and the emergence of new entrants create competitive pressures. Concerns regarding the efficacy and safety of certain ingredients also pose a challenge. These factors can potentially limit market growth and profitability.
Leading Players in the Cognitive Health Ingredients Market Market
- Koninklijke DSM
- Food Chem International
- Kerry Inc
- DuPont de Nemours Inc
- Archer Daniels Midland Company
- BASF SE
- Corbion N.V.
- Cargill Inc
- Ingredion Incorporated
- Rousselot BV
Key Developments in Cognitive Health Ingredients Market Sector
- 2022 Q4: Koninklijke DSM launched a new line of phosphatidylserine ingredients for cognitive health.
- 2023 Q1: Kerry Inc. expanded its production capacity for omega-3 fatty acids used in cognitive health supplements.
- 2023 Q2: Archer Daniels Midland Company acquired a smaller company specializing in botanical extracts for brain health.
Strategic Cognitive Health Ingredients Market Market Outlook
The Cognitive Health Ingredients market presents a significant growth opportunity, driven by the increasing prevalence of age-related cognitive decline and the growing consumer demand for natural and functional ingredients. Strategic opportunities exist in developing innovative products with enhanced efficacy and bioavailability, expanding into new markets with high growth potential, and forging strategic partnerships to enhance distribution networks and access new technologies. Companies focusing on personalized nutrition solutions and incorporating digital technologies to enhance customer engagement are poised to gain a competitive edge. The market is expected to witness sustained growth in the coming years, propelled by continued R&D efforts and favorable regulatory support.
Cognitive Health Ingredients Market Segmentation
-
1. Product Type
- 1.1. Vitamins and Minerals
- 1.2. Omega PUFA
- 1.3. Probiotics & Prebiotics
- 1.4. Amino Acids, Proteins & Peptides
- 1.5. Fibers
- 1.6. Botanical Extracts
-
2. Application
- 2.1. Functional Food and Beverages
- 2.2. Dietary Supplements
Cognitive Health Ingredients Market Segmentation By Geography
-
1. North America
- 1.1. United States
- 1.2. Canada
- 1.3. Mexico
- 1.4. Rest of North America
-
2. Europe
- 2.1. Germany
- 2.2. United Kingdom
- 2.3. France
- 2.4. Russia
- 2.5. Spain
- 2.6. Italy
- 2.7. Rest of Europe
-
3. Asia Pacific
- 3.1. India
- 3.2. China
- 3.3. Japan
- 3.4. Australia
- 3.5. Rest of Asia Pacific
-
4. South America
- 4.1. Brazil
- 4.2. Argentina
- 4.3. Rest of South America
-
5. Middle East and Africa
- 5.1. South Africa
- 5.2. Saudi Arabia
- 5.3. Rest of Middle East and Africa
Cognitive Health Ingredients Market REPORT HIGHLIGHTS
| Aspects | Details |
|---|---|
| Study Period | 2019-2033 |
| Base Year | 2024 |
| Estimated Year | 2025 |
| Forecast Period | 2025-2033 |
| Historical Period | 2019-2024 |
| Growth Rate | CAGR of 5.87% from 2019-2033 |
| Segmentation |
|
Table of Contents
- 1. Introduction
- 1.1. Research Scope
- 1.2. Market Segmentation
- 1.3. Research Methodology
- 1.4. Definitions and Assumptions
- 2. Executive Summary
- 2.1. Introduction
- 3. Market Dynamics
- 3.1. Introduction
- 3.2. Market Drivers
- 3.2.1. Increasing Demand For Convenience & Processed Food
- 3.3. Market Restrains
- 3.3.1. Increased Consumer Awareness On Side-Effects Of Chemical Additives
- 3.4. Market Trends
- 3.4.1. Natural Health Ingredients Perceived to Be Highly Effective among Arthritis Patients
- 4. Market Factor Analysis
- 4.1. Porters Five Forces
- 4.2. Supply/Value Chain
- 4.3. PESTEL analysis
- 4.4. Market Entropy
- 4.5. Patent/Trademark Analysis
- 5. Global Cognitive Health Ingredients Market Analysis, Insights and Forecast, 2019-2031
- 5.1. Market Analysis, Insights and Forecast - by Product Type
- 5.1.1. Vitamins and Minerals
- 5.1.2. Omega PUFA
- 5.1.3. Probiotics & Prebiotics
- 5.1.4. Amino Acids, Proteins & Peptides
- 5.1.5. Fibers
- 5.1.6. Botanical Extracts
- 5.2. Market Analysis, Insights and Forecast - by Application
- 5.2.1. Functional Food and Beverages
- 5.2.2. Dietary Supplements
- 5.3. Market Analysis, Insights and Forecast - by Region
- 5.3.1. North America
- 5.3.2. Europe
- 5.3.3. Asia Pacific
- 5.3.4. South America
- 5.3.5. Middle East and Africa
- 5.1. Market Analysis, Insights and Forecast - by Product Type
- 6. North America Cognitive Health Ingredients Market Analysis, Insights and Forecast, 2019-2031
- 6.1. Market Analysis, Insights and Forecast - by Product Type
- 6.1.1. Vitamins and Minerals
- 6.1.2. Omega PUFA
- 6.1.3. Probiotics & Prebiotics
- 6.1.4. Amino Acids, Proteins & Peptides
- 6.1.5. Fibers
- 6.1.6. Botanical Extracts
- 6.2. Market Analysis, Insights and Forecast - by Application
- 6.2.1. Functional Food and Beverages
- 6.2.2. Dietary Supplements
- 6.1. Market Analysis, Insights and Forecast - by Product Type
- 7. Europe Cognitive Health Ingredients Market Analysis, Insights and Forecast, 2019-2031
- 7.1. Market Analysis, Insights and Forecast - by Product Type
- 7.1.1. Vitamins and Minerals
- 7.1.2. Omega PUFA
- 7.1.3. Probiotics & Prebiotics
- 7.1.4. Amino Acids, Proteins & Peptides
- 7.1.5. Fibers
- 7.1.6. Botanical Extracts
- 7.2. Market Analysis, Insights and Forecast - by Application
- 7.2.1. Functional Food and Beverages
- 7.2.2. Dietary Supplements
- 7.1. Market Analysis, Insights and Forecast - by Product Type
- 8. Asia Pacific Cognitive Health Ingredients Market Analysis, Insights and Forecast, 2019-2031
- 8.1. Market Analysis, Insights and Forecast - by Product Type
- 8.1.1. Vitamins and Minerals
- 8.1.2. Omega PUFA
- 8.1.3. Probiotics & Prebiotics
- 8.1.4. Amino Acids, Proteins & Peptides
- 8.1.5. Fibers
- 8.1.6. Botanical Extracts
- 8.2. Market Analysis, Insights and Forecast - by Application
- 8.2.1. Functional Food and Beverages
- 8.2.2. Dietary Supplements
- 8.1. Market Analysis, Insights and Forecast - by Product Type
- 9. South America Cognitive Health Ingredients Market Analysis, Insights and Forecast, 2019-2031
- 9.1. Market Analysis, Insights and Forecast - by Product Type
- 9.1.1. Vitamins and Minerals
- 9.1.2. Omega PUFA
- 9.1.3. Probiotics & Prebiotics
- 9.1.4. Amino Acids, Proteins & Peptides
- 9.1.5. Fibers
- 9.1.6. Botanical Extracts
- 9.2. Market Analysis, Insights and Forecast - by Application
- 9.2.1. Functional Food and Beverages
- 9.2.2. Dietary Supplements
- 9.1. Market Analysis, Insights and Forecast - by Product Type
- 10. Middle East and Africa Cognitive Health Ingredients Market Analysis, Insights and Forecast, 2019-2031
- 10.1. Market Analysis, Insights and Forecast - by Product Type
- 10.1.1. Vitamins and Minerals
- 10.1.2. Omega PUFA
- 10.1.3. Probiotics & Prebiotics
- 10.1.4. Amino Acids, Proteins & Peptides
- 10.1.5. Fibers
- 10.1.6. Botanical Extracts
- 10.2. Market Analysis, Insights and Forecast - by Application
- 10.2.1. Functional Food and Beverages
- 10.2.2. Dietary Supplements
- 10.1. Market Analysis, Insights and Forecast - by Product Type
- 11. North America Cognitive Health Ingredients Market Analysis, Insights and Forecast, 2019-2031
- 11.1. Market Analysis, Insights and Forecast - By Country/Sub-region
- 11.1.1 United States
- 11.1.2 Canada
- 11.1.3 Mexico
- 11.1.4 Rest of North America
- 12. Europe Cognitive Health Ingredients Market Analysis, Insights and Forecast, 2019-2031
- 12.1. Market Analysis, Insights and Forecast - By Country/Sub-region
- 12.1.1 Germany
- 12.1.2 United Kingdom
- 12.1.3 France
- 12.1.4 Russia
- 12.1.5 Spain
- 12.1.6 Italy
- 12.1.7 Rest of Europe
- 13. Asia Pacific Cognitive Health Ingredients Market Analysis, Insights and Forecast, 2019-2031
- 13.1. Market Analysis, Insights and Forecast - By Country/Sub-region
- 13.1.1 India
- 13.1.2 China
- 13.1.3 Japan
- 13.1.4 Australia
- 13.1.5 Rest of Asia Pacific
- 14. South America Cognitive Health Ingredients Market Analysis, Insights and Forecast, 2019-2031
- 14.1. Market Analysis, Insights and Forecast - By Country/Sub-region
- 14.1.1 Brazil
- 14.1.2 Argentina
- 14.1.3 Rest of South America
- 15. Middle East and Africa Cognitive Health Ingredients Market Analysis, Insights and Forecast, 2019-2031
- 15.1. Market Analysis, Insights and Forecast - By Country/Sub-region
- 15.1.1 South Africa
- 15.1.2 Saudi Arabia
- 15.1.3 Rest of Middle East and Africa
- 16. Competitive Analysis
- 16.1. Global Market Share Analysis 2024
- 16.2. Company Profiles
- 16.2.1 Koninklijke DSM
- 16.2.1.1. Overview
- 16.2.1.2. Products
- 16.2.1.3. SWOT Analysis
- 16.2.1.4. Recent Developments
- 16.2.1.5. Financials (Based on Availability)
- 16.2.2 Food Chem Internationa
- 16.2.2.1. Overview
- 16.2.2.2. Products
- 16.2.2.3. SWOT Analysis
- 16.2.2.4. Recent Developments
- 16.2.2.5. Financials (Based on Availability)
- 16.2.3 Kerry Inc
- 16.2.3.1. Overview
- 16.2.3.2. Products
- 16.2.3.3. SWOT Analysis
- 16.2.3.4. Recent Developments
- 16.2.3.5. Financials (Based on Availability)
- 16.2.4 DuPont de Nemours Inc
- 16.2.4.1. Overview
- 16.2.4.2. Products
- 16.2.4.3. SWOT Analysis
- 16.2.4.4. Recent Developments
- 16.2.4.5. Financials (Based on Availability)
- 16.2.5 Archer Daniels Midland Company
- 16.2.5.1. Overview
- 16.2.5.2. Products
- 16.2.5.3. SWOT Analysis
- 16.2.5.4. Recent Developments
- 16.2.5.5. Financials (Based on Availability)
- 16.2.6 BASF SE
- 16.2.6.1. Overview
- 16.2.6.2. Products
- 16.2.6.3. SWOT Analysis
- 16.2.6.4. Recent Developments
- 16.2.6.5. Financials (Based on Availability)
- 16.2.7 Corbion N V
- 16.2.7.1. Overview
- 16.2.7.2. Products
- 16.2.7.3. SWOT Analysis
- 16.2.7.4. Recent Developments
- 16.2.7.5. Financials (Based on Availability)
- 16.2.8 Cargill Inc
- 16.2.8.1. Overview
- 16.2.8.2. Products
- 16.2.8.3. SWOT Analysis
- 16.2.8.4. Recent Developments
- 16.2.8.5. Financials (Based on Availability)
- 16.2.9 Ingredion Incorporated
- 16.2.9.1. Overview
- 16.2.9.2. Products
- 16.2.9.3. SWOT Analysis
- 16.2.9.4. Recent Developments
- 16.2.9.5. Financials (Based on Availability)
- 16.2.10 Rousselot BV
- 16.2.10.1. Overview
- 16.2.10.2. Products
- 16.2.10.3. SWOT Analysis
- 16.2.10.4. Recent Developments
- 16.2.10.5. Financials (Based on Availability)
- 16.2.1 Koninklijke DSM
List of Figures
- Figure 1: Global Cognitive Health Ingredients Market Revenue Breakdown (Million, %) by Region 2024 & 2032
- Figure 2: Global Cognitive Health Ingredients Market Volume Breakdown (K Tons, %) by Region 2024 & 2032
- Figure 3: North America Cognitive Health Ingredients Market Revenue (Million), by Country 2024 & 2032
- Figure 4: North America Cognitive Health Ingredients Market Volume (K Tons), by Country 2024 & 2032
- Figure 5: North America Cognitive Health Ingredients Market Revenue Share (%), by Country 2024 & 2032
- Figure 6: North America Cognitive Health Ingredients Market Volume Share (%), by Country 2024 & 2032
- Figure 7: Europe Cognitive Health Ingredients Market Revenue (Million), by Country 2024 & 2032
- Figure 8: Europe Cognitive Health Ingredients Market Volume (K Tons), by Country 2024 & 2032
- Figure 9: Europe Cognitive Health Ingredients Market Revenue Share (%), by Country 2024 & 2032
- Figure 10: Europe Cognitive Health Ingredients Market Volume Share (%), by Country 2024 & 2032
- Figure 11: Asia Pacific Cognitive Health Ingredients Market Revenue (Million), by Country 2024 & 2032
- Figure 12: Asia Pacific Cognitive Health Ingredients Market Volume (K Tons), by Country 2024 & 2032
- Figure 13: Asia Pacific Cognitive Health Ingredients Market Revenue Share (%), by Country 2024 & 2032
- Figure 14: Asia Pacific Cognitive Health Ingredients Market Volume Share (%), by Country 2024 & 2032
- Figure 15: South America Cognitive Health Ingredients Market Revenue (Million), by Country 2024 & 2032
- Figure 16: South America Cognitive Health Ingredients Market Volume (K Tons), by Country 2024 & 2032
- Figure 17: South America Cognitive Health Ingredients Market Revenue Share (%), by Country 2024 & 2032
- Figure 18: South America Cognitive Health Ingredients Market Volume Share (%), by Country 2024 & 2032
- Figure 19: Middle East and Africa Cognitive Health Ingredients Market Revenue (Million), by Country 2024 & 2032
- Figure 20: Middle East and Africa Cognitive Health Ingredients Market Volume (K Tons), by Country 2024 & 2032
- Figure 21: Middle East and Africa Cognitive Health Ingredients Market Revenue Share (%), by Country 2024 & 2032
- Figure 22: Middle East and Africa Cognitive Health Ingredients Market Volume Share (%), by Country 2024 & 2032
- Figure 23: North America Cognitive Health Ingredients Market Revenue (Million), by Product Type 2024 & 2032
- Figure 24: North America Cognitive Health Ingredients Market Volume (K Tons), by Product Type 2024 & 2032
- Figure 25: North America Cognitive Health Ingredients Market Revenue Share (%), by Product Type 2024 & 2032
- Figure 26: North America Cognitive Health Ingredients Market Volume Share (%), by Product Type 2024 & 2032
- Figure 27: North America Cognitive Health Ingredients Market Revenue (Million), by Application 2024 & 2032
- Figure 28: North America Cognitive Health Ingredients Market Volume (K Tons), by Application 2024 & 2032
- Figure 29: North America Cognitive Health Ingredients Market Revenue Share (%), by Application 2024 & 2032
- Figure 30: North America Cognitive Health Ingredients Market Volume Share (%), by Application 2024 & 2032
- Figure 31: North America Cognitive Health Ingredients Market Revenue (Million), by Country 2024 & 2032
- Figure 32: North America Cognitive Health Ingredients Market Volume (K Tons), by Country 2024 & 2032
- Figure 33: North America Cognitive Health Ingredients Market Revenue Share (%), by Country 2024 & 2032
- Figure 34: North America Cognitive Health Ingredients Market Volume Share (%), by Country 2024 & 2032
- Figure 35: Europe Cognitive Health Ingredients Market Revenue (Million), by Product Type 2024 & 2032
- Figure 36: Europe Cognitive Health Ingredients Market Volume (K Tons), by Product Type 2024 & 2032
- Figure 37: Europe Cognitive Health Ingredients Market Revenue Share (%), by Product Type 2024 & 2032
- Figure 38: Europe Cognitive Health Ingredients Market Volume Share (%), by Product Type 2024 & 2032
- Figure 39: Europe Cognitive Health Ingredients Market Revenue (Million), by Application 2024 & 2032
- Figure 40: Europe Cognitive Health Ingredients Market Volume (K Tons), by Application 2024 & 2032
- Figure 41: Europe Cognitive Health Ingredients Market Revenue Share (%), by Application 2024 & 2032
- Figure 42: Europe Cognitive Health Ingredients Market Volume Share (%), by Application 2024 & 2032
- Figure 43: Europe Cognitive Health Ingredients Market Revenue (Million), by Country 2024 & 2032
- Figure 44: Europe Cognitive Health Ingredients Market Volume (K Tons), by Country 2024 & 2032
- Figure 45: Europe Cognitive Health Ingredients Market Revenue Share (%), by Country 2024 & 2032
- Figure 46: Europe Cognitive Health Ingredients Market Volume Share (%), by Country 2024 & 2032
- Figure 47: Asia Pacific Cognitive Health Ingredients Market Revenue (Million), by Product Type 2024 & 2032
- Figure 48: Asia Pacific Cognitive Health Ingredients Market Volume (K Tons), by Product Type 2024 & 2032
- Figure 49: Asia Pacific Cognitive Health Ingredients Market Revenue Share (%), by Product Type 2024 & 2032
- Figure 50: Asia Pacific Cognitive Health Ingredients Market Volume Share (%), by Product Type 2024 & 2032
- Figure 51: Asia Pacific Cognitive Health Ingredients Market Revenue (Million), by Application 2024 & 2032
- Figure 52: Asia Pacific Cognitive Health Ingredients Market Volume (K Tons), by Application 2024 & 2032
- Figure 53: Asia Pacific Cognitive Health Ingredients Market Revenue Share (%), by Application 2024 & 2032
- Figure 54: Asia Pacific Cognitive Health Ingredients Market Volume Share (%), by Application 2024 & 2032
- Figure 55: Asia Pacific Cognitive Health Ingredients Market Revenue (Million), by Country 2024 & 2032
- Figure 56: Asia Pacific Cognitive Health Ingredients Market Volume (K Tons), by Country 2024 & 2032
- Figure 57: Asia Pacific Cognitive Health Ingredients Market Revenue Share (%), by Country 2024 & 2032
- Figure 58: Asia Pacific Cognitive Health Ingredients Market Volume Share (%), by Country 2024 & 2032
- Figure 59: South America Cognitive Health Ingredients Market Revenue (Million), by Product Type 2024 & 2032
- Figure 60: South America Cognitive Health Ingredients Market Volume (K Tons), by Product Type 2024 & 2032
- Figure 61: South America Cognitive Health Ingredients Market Revenue Share (%), by Product Type 2024 & 2032
- Figure 62: South America Cognitive Health Ingredients Market Volume Share (%), by Product Type 2024 & 2032
- Figure 63: South America Cognitive Health Ingredients Market Revenue (Million), by Application 2024 & 2032
- Figure 64: South America Cognitive Health Ingredients Market Volume (K Tons), by Application 2024 & 2032
- Figure 65: South America Cognitive Health Ingredients Market Revenue Share (%), by Application 2024 & 2032
- Figure 66: South America Cognitive Health Ingredients Market Volume Share (%), by Application 2024 & 2032
- Figure 67: South America Cognitive Health Ingredients Market Revenue (Million), by Country 2024 & 2032
- Figure 68: South America Cognitive Health Ingredients Market Volume (K Tons), by Country 2024 & 2032
- Figure 69: South America Cognitive Health Ingredients Market Revenue Share (%), by Country 2024 & 2032
- Figure 70: South America Cognitive Health Ingredients Market Volume Share (%), by Country 2024 & 2032
- Figure 71: Middle East and Africa Cognitive Health Ingredients Market Revenue (Million), by Product Type 2024 & 2032
- Figure 72: Middle East and Africa Cognitive Health Ingredients Market Volume (K Tons), by Product Type 2024 & 2032
- Figure 73: Middle East and Africa Cognitive Health Ingredients Market Revenue Share (%), by Product Type 2024 & 2032
- Figure 74: Middle East and Africa Cognitive Health Ingredients Market Volume Share (%), by Product Type 2024 & 2032
- Figure 75: Middle East and Africa Cognitive Health Ingredients Market Revenue (Million), by Application 2024 & 2032
- Figure 76: Middle East and Africa Cognitive Health Ingredients Market Volume (K Tons), by Application 2024 & 2032
- Figure 77: Middle East and Africa Cognitive Health Ingredients Market Revenue Share (%), by Application 2024 & 2032
- Figure 78: Middle East and Africa Cognitive Health Ingredients Market Volume Share (%), by Application 2024 & 2032
- Figure 79: Middle East and Africa Cognitive Health Ingredients Market Revenue (Million), by Country 2024 & 2032
- Figure 80: Middle East and Africa Cognitive Health Ingredients Market Volume (K Tons), by Country 2024 & 2032
- Figure 81: Middle East and Africa Cognitive Health Ingredients Market Revenue Share (%), by Country 2024 & 2032
- Figure 82: Middle East and Africa Cognitive Health Ingredients Market Volume Share (%), by Country 2024 & 2032
List of Tables
- Table 1: Global Cognitive Health Ingredients Market Revenue Million Forecast, by Region 2019 & 2032
- Table 2: Global Cognitive Health Ingredients Market Volume K Tons Forecast, by Region 2019 & 2032
- Table 3: Global Cognitive Health Ingredients Market Revenue Million Forecast, by Product Type 2019 & 2032
- Table 4: Global Cognitive Health Ingredients Market Volume K Tons Forecast, by Product Type 2019 & 2032
- Table 5: Global Cognitive Health Ingredients Market Revenue Million Forecast, by Application 2019 & 2032
- Table 6: Global Cognitive Health Ingredients Market Volume K Tons Forecast, by Application 2019 & 2032
- Table 7: Global Cognitive Health Ingredients Market Revenue Million Forecast, by Region 2019 & 2032
- Table 8: Global Cognitive Health Ingredients Market Volume K Tons Forecast, by Region 2019 & 2032
- Table 9: Global Cognitive Health Ingredients Market Revenue Million Forecast, by Country 2019 & 2032
- Table 10: Global Cognitive Health Ingredients Market Volume K Tons Forecast, by Country 2019 & 2032
- Table 11: United States Cognitive Health Ingredients Market Revenue (Million) Forecast, by Application 2019 & 2032
- Table 12: United States Cognitive Health Ingredients Market Volume (K Tons) Forecast, by Application 2019 & 2032
- Table 13: Canada Cognitive Health Ingredients Market Revenue (Million) Forecast, by Application 2019 & 2032
- Table 14: Canada Cognitive Health Ingredients Market Volume (K Tons) Forecast, by Application 2019 & 2032
- Table 15: Mexico Cognitive Health Ingredients Market Revenue (Million) Forecast, by Application 2019 & 2032
- Table 16: Mexico Cognitive Health Ingredients Market Volume (K Tons) Forecast, by Application 2019 & 2032
- Table 17: Rest of North America Cognitive Health Ingredients Market Revenue (Million) Forecast, by Application 2019 & 2032
- Table 18: Rest of North America Cognitive Health Ingredients Market Volume (K Tons) Forecast, by Application 2019 & 2032
- Table 19: Global Cognitive Health Ingredients Market Revenue Million Forecast, by Country 2019 & 2032
- Table 20: Global Cognitive Health Ingredients Market Volume K Tons Forecast, by Country 2019 & 2032
- Table 21: Germany Cognitive Health Ingredients Market Revenue (Million) Forecast, by Application 2019 & 2032
- Table 22: Germany Cognitive Health Ingredients Market Volume (K Tons) Forecast, by Application 2019 & 2032
- Table 23: United Kingdom Cognitive Health Ingredients Market Revenue (Million) Forecast, by Application 2019 & 2032
- Table 24: United Kingdom Cognitive Health Ingredients Market Volume (K Tons) Forecast, by Application 2019 & 2032
- Table 25: France Cognitive Health Ingredients Market Revenue (Million) Forecast, by Application 2019 & 2032
- Table 26: France Cognitive Health Ingredients Market Volume (K Tons) Forecast, by Application 2019 & 2032
- Table 27: Russia Cognitive Health Ingredients Market Revenue (Million) Forecast, by Application 2019 & 2032
- Table 28: Russia Cognitive Health Ingredients Market Volume (K Tons) Forecast, by Application 2019 & 2032
- Table 29: Spain Cognitive Health Ingredients Market Revenue (Million) Forecast, by Application 2019 & 2032
- Table 30: Spain Cognitive Health Ingredients Market Volume (K Tons) Forecast, by Application 2019 & 2032
- Table 31: Italy Cognitive Health Ingredients Market Revenue (Million) Forecast, by Application 2019 & 2032
- Table 32: Italy Cognitive Health Ingredients Market Volume (K Tons) Forecast, by Application 2019 & 2032
- Table 33: Rest of Europe Cognitive Health Ingredients Market Revenue (Million) Forecast, by Application 2019 & 2032
- Table 34: Rest of Europe Cognitive Health Ingredients Market Volume (K Tons) Forecast, by Application 2019 & 2032
- Table 35: Global Cognitive Health Ingredients Market Revenue Million Forecast, by Country 2019 & 2032
- Table 36: Global Cognitive Health Ingredients Market Volume K Tons Forecast, by Country 2019 & 2032
- Table 37: India Cognitive Health Ingredients Market Revenue (Million) Forecast, by Application 2019 & 2032
- Table 38: India Cognitive Health Ingredients Market Volume (K Tons) Forecast, by Application 2019 & 2032
- Table 39: China Cognitive Health Ingredients Market Revenue (Million) Forecast, by Application 2019 & 2032
- Table 40: China Cognitive Health Ingredients Market Volume (K Tons) Forecast, by Application 2019 & 2032
- Table 41: Japan Cognitive Health Ingredients Market Revenue (Million) Forecast, by Application 2019 & 2032
- Table 42: Japan Cognitive Health Ingredients Market Volume (K Tons) Forecast, by Application 2019 & 2032
- Table 43: Australia Cognitive Health Ingredients Market Revenue (Million) Forecast, by Application 2019 & 2032
- Table 44: Australia Cognitive Health Ingredients Market Volume (K Tons) Forecast, by Application 2019 & 2032
- Table 45: Rest of Asia Pacific Cognitive Health Ingredients Market Revenue (Million) Forecast, by Application 2019 & 2032
- Table 46: Rest of Asia Pacific Cognitive Health Ingredients Market Volume (K Tons) Forecast, by Application 2019 & 2032
- Table 47: Global Cognitive Health Ingredients Market Revenue Million Forecast, by Country 2019 & 2032
- Table 48: Global Cognitive Health Ingredients Market Volume K Tons Forecast, by Country 2019 & 2032
- Table 49: Brazil Cognitive Health Ingredients Market Revenue (Million) Forecast, by Application 2019 & 2032
- Table 50: Brazil Cognitive Health Ingredients Market Volume (K Tons) Forecast, by Application 2019 & 2032
- Table 51: Argentina Cognitive Health Ingredients Market Revenue (Million) Forecast, by Application 2019 & 2032
- Table 52: Argentina Cognitive Health Ingredients Market Volume (K Tons) Forecast, by Application 2019 & 2032
- Table 53: Rest of South America Cognitive Health Ingredients Market Revenue (Million) Forecast, by Application 2019 & 2032
- Table 54: Rest of South America Cognitive Health Ingredients Market Volume (K Tons) Forecast, by Application 2019 & 2032
- Table 55: Global Cognitive Health Ingredients Market Revenue Million Forecast, by Country 2019 & 2032
- Table 56: Global Cognitive Health Ingredients Market Volume K Tons Forecast, by Country 2019 & 2032
- Table 57: South Africa Cognitive Health Ingredients Market Revenue (Million) Forecast, by Application 2019 & 2032
- Table 58: South Africa Cognitive Health Ingredients Market Volume (K Tons) Forecast, by Application 2019 & 2032
- Table 59: Saudi Arabia Cognitive Health Ingredients Market Revenue (Million) Forecast, by Application 2019 & 2032
- Table 60: Saudi Arabia Cognitive Health Ingredients Market Volume (K Tons) Forecast, by Application 2019 & 2032
- Table 61: Rest of Middle East and Africa Cognitive Health Ingredients Market Revenue (Million) Forecast, by Application 2019 & 2032
- Table 62: Rest of Middle East and Africa Cognitive Health Ingredients Market Volume (K Tons) Forecast, by Application 2019 & 2032
- Table 63: Global Cognitive Health Ingredients Market Revenue Million Forecast, by Product Type 2019 & 2032
- Table 64: Global Cognitive Health Ingredients Market Volume K Tons Forecast, by Product Type 2019 & 2032
- Table 65: Global Cognitive Health Ingredients Market Revenue Million Forecast, by Application 2019 & 2032
- Table 66: Global Cognitive Health Ingredients Market Volume K Tons Forecast, by Application 2019 & 2032
- Table 67: Global Cognitive Health Ingredients Market Revenue Million Forecast, by Country 2019 & 2032
- Table 68: Global Cognitive Health Ingredients Market Volume K Tons Forecast, by Country 2019 & 2032
- Table 69: United States Cognitive Health Ingredients Market Revenue (Million) Forecast, by Application 2019 & 2032
- Table 70: United States Cognitive Health Ingredients Market Volume (K Tons) Forecast, by Application 2019 & 2032
- Table 71: Canada Cognitive Health Ingredients Market Revenue (Million) Forecast, by Application 2019 & 2032
- Table 72: Canada Cognitive Health Ingredients Market Volume (K Tons) Forecast, by Application 2019 & 2032
- Table 73: Mexico Cognitive Health Ingredients Market Revenue (Million) Forecast, by Application 2019 & 2032
- Table 74: Mexico Cognitive Health Ingredients Market Volume (K Tons) Forecast, by Application 2019 & 2032
- Table 75: Rest of North America Cognitive Health Ingredients Market Revenue (Million) Forecast, by Application 2019 & 2032
- Table 76: Rest of North America Cognitive Health Ingredients Market Volume (K Tons) Forecast, by Application 2019 & 2032
- Table 77: Global Cognitive Health Ingredients Market Revenue Million Forecast, by Product Type 2019 & 2032
- Table 78: Global Cognitive Health Ingredients Market Volume K Tons Forecast, by Product Type 2019 & 2032
- Table 79: Global Cognitive Health Ingredients Market Revenue Million Forecast, by Application 2019 & 2032
- Table 80: Global Cognitive Health Ingredients Market Volume K Tons Forecast, by Application 2019 & 2032
- Table 81: Global Cognitive Health Ingredients Market Revenue Million Forecast, by Country 2019 & 2032
- Table 82: Global Cognitive Health Ingredients Market Volume K Tons Forecast, by Country 2019 & 2032
- Table 83: Germany Cognitive Health Ingredients Market Revenue (Million) Forecast, by Application 2019 & 2032
- Table 84: Germany Cognitive Health Ingredients Market Volume (K Tons) Forecast, by Application 2019 & 2032
- Table 85: United Kingdom Cognitive Health Ingredients Market Revenue (Million) Forecast, by Application 2019 & 2032
- Table 86: United Kingdom Cognitive Health Ingredients Market Volume (K Tons) Forecast, by Application 2019 & 2032
- Table 87: France Cognitive Health Ingredients Market Revenue (Million) Forecast, by Application 2019 & 2032
- Table 88: France Cognitive Health Ingredients Market Volume (K Tons) Forecast, by Application 2019 & 2032
- Table 89: Russia Cognitive Health Ingredients Market Revenue (Million) Forecast, by Application 2019 & 2032
- Table 90: Russia Cognitive Health Ingredients Market Volume (K Tons) Forecast, by Application 2019 & 2032
- Table 91: Spain Cognitive Health Ingredients Market Revenue (Million) Forecast, by Application 2019 & 2032
- Table 92: Spain Cognitive Health Ingredients Market Volume (K Tons) Forecast, by Application 2019 & 2032
- Table 93: Italy Cognitive Health Ingredients Market Revenue (Million) Forecast, by Application 2019 & 2032
- Table 94: Italy Cognitive Health Ingredients Market Volume (K Tons) Forecast, by Application 2019 & 2032
- Table 95: Rest of Europe Cognitive Health Ingredients Market Revenue (Million) Forecast, by Application 2019 & 2032
- Table 96: Rest of Europe Cognitive Health Ingredients Market Volume (K Tons) Forecast, by Application 2019 & 2032
- Table 97: Global Cognitive Health Ingredients Market Revenue Million Forecast, by Product Type 2019 & 2032
- Table 98: Global Cognitive Health Ingredients Market Volume K Tons Forecast, by Product Type 2019 & 2032
- Table 99: Global Cognitive Health Ingredients Market Revenue Million Forecast, by Application 2019 & 2032
- Table 100: Global Cognitive Health Ingredients Market Volume K Tons Forecast, by Application 2019 & 2032
- Table 101: Global Cognitive Health Ingredients Market Revenue Million Forecast, by Country 2019 & 2032
- Table 102: Global Cognitive Health Ingredients Market Volume K Tons Forecast, by Country 2019 & 2032
- Table 103: India Cognitive Health Ingredients Market Revenue (Million) Forecast, by Application 2019 & 2032
- Table 104: India Cognitive Health Ingredients Market Volume (K Tons) Forecast, by Application 2019 & 2032
- Table 105: China Cognitive Health Ingredients Market Revenue (Million) Forecast, by Application 2019 & 2032
- Table 106: China Cognitive Health Ingredients Market Volume (K Tons) Forecast, by Application 2019 & 2032
- Table 107: Japan Cognitive Health Ingredients Market Revenue (Million) Forecast, by Application 2019 & 2032
- Table 108: Japan Cognitive Health Ingredients Market Volume (K Tons) Forecast, by Application 2019 & 2032
- Table 109: Australia Cognitive Health Ingredients Market Revenue (Million) Forecast, by Application 2019 & 2032
- Table 110: Australia Cognitive Health Ingredients Market Volume (K Tons) Forecast, by Application 2019 & 2032
- Table 111: Rest of Asia Pacific Cognitive Health Ingredients Market Revenue (Million) Forecast, by Application 2019 & 2032
- Table 112: Rest of Asia Pacific Cognitive Health Ingredients Market Volume (K Tons) Forecast, by Application 2019 & 2032
- Table 113: Global Cognitive Health Ingredients Market Revenue Million Forecast, by Product Type 2019 & 2032
- Table 114: Global Cognitive Health Ingredients Market Volume K Tons Forecast, by Product Type 2019 & 2032
- Table 115: Global Cognitive Health Ingredients Market Revenue Million Forecast, by Application 2019 & 2032
- Table 116: Global Cognitive Health Ingredients Market Volume K Tons Forecast, by Application 2019 & 2032
- Table 117: Global Cognitive Health Ingredients Market Revenue Million Forecast, by Country 2019 & 2032
- Table 118: Global Cognitive Health Ingredients Market Volume K Tons Forecast, by Country 2019 & 2032
- Table 119: Brazil Cognitive Health Ingredients Market Revenue (Million) Forecast, by Application 2019 & 2032
- Table 120: Brazil Cognitive Health Ingredients Market Volume (K Tons) Forecast, by Application 2019 & 2032
- Table 121: Argentina Cognitive Health Ingredients Market Revenue (Million) Forecast, by Application 2019 & 2032
- Table 122: Argentina Cognitive Health Ingredients Market Volume (K Tons) Forecast, by Application 2019 & 2032
- Table 123: Rest of South America Cognitive Health Ingredients Market Revenue (Million) Forecast, by Application 2019 & 2032
- Table 124: Rest of South America Cognitive Health Ingredients Market Volume (K Tons) Forecast, by Application 2019 & 2032
- Table 125: Global Cognitive Health Ingredients Market Revenue Million Forecast, by Product Type 2019 & 2032
- Table 126: Global Cognitive Health Ingredients Market Volume K Tons Forecast, by Product Type 2019 & 2032
- Table 127: Global Cognitive Health Ingredients Market Revenue Million Forecast, by Application 2019 & 2032
- Table 128: Global Cognitive Health Ingredients Market Volume K Tons Forecast, by Application 2019 & 2032
- Table 129: Global Cognitive Health Ingredients Market Revenue Million Forecast, by Country 2019 & 2032
- Table 130: Global Cognitive Health Ingredients Market Volume K Tons Forecast, by Country 2019 & 2032
- Table 131: South Africa Cognitive Health Ingredients Market Revenue (Million) Forecast, by Application 2019 & 2032
- Table 132: South Africa Cognitive Health Ingredients Market Volume (K Tons) Forecast, by Application 2019 & 2032
- Table 133: Saudi Arabia Cognitive Health Ingredients Market Revenue (Million) Forecast, by Application 2019 & 2032
- Table 134: Saudi Arabia Cognitive Health Ingredients Market Volume (K Tons) Forecast, by Application 2019 & 2032
- Table 135: Rest of Middle East and Africa Cognitive Health Ingredients Market Revenue (Million) Forecast, by Application 2019 & 2032
- Table 136: Rest of Middle East and Africa Cognitive Health Ingredients Market Volume (K Tons) Forecast, by Application 2019 & 2032
Frequently Asked Questions
1. What is the projected Compound Annual Growth Rate (CAGR) of the Cognitive Health Ingredients Market?
The projected CAGR is approximately 5.87%.
2. Which companies are prominent players in the Cognitive Health Ingredients Market?
Key companies in the market include Koninklijke DSM, Food Chem Internationa, Kerry Inc, DuPont de Nemours Inc, Archer Daniels Midland Company, BASF SE, Corbion N V, Cargill Inc, Ingredion Incorporated, Rousselot BV.
3. What are the main segments of the Cognitive Health Ingredients Market?
The market segments include Product Type, Application.
4. Can you provide details about the market size?
The market size is estimated to be USD 9000 Million as of 2022.
5. What are some drivers contributing to market growth?
Increasing Demand For Convenience & Processed Food.
6. What are the notable trends driving market growth?
Natural Health Ingredients Perceived to Be Highly Effective among Arthritis Patients.
7. Are there any restraints impacting market growth?
Increased Consumer Awareness On Side-Effects Of Chemical Additives.
8. Can you provide examples of recent developments in the market?
The launch of new products by major players
9. What pricing options are available for accessing the report?
Pricing options include single-user, multi-user, and enterprise licenses priced at USD 4750, USD 5250, and USD 8750 respectively.
10. Is the market size provided in terms of value or volume?
The market size is provided in terms of value, measured in Million and volume, measured in K Tons.
11. Are there any specific market keywords associated with the report?
Yes, the market keyword associated with the report is "Cognitive Health Ingredients Market," which aids in identifying and referencing the specific market segment covered.
12. How do I determine which pricing option suits my needs best?
The pricing options vary based on user requirements and access needs. Individual users may opt for single-user licenses, while businesses requiring broader access may choose multi-user or enterprise licenses for cost-effective access to the report.
13. Are there any additional resources or data provided in the Cognitive Health Ingredients Market report?
While the report offers comprehensive insights, it's advisable to review the specific contents or supplementary materials provided to ascertain if additional resources or data are available.
14. How can I stay updated on further developments or reports in the Cognitive Health Ingredients Market?
To stay informed about further developments, trends, and reports in the Cognitive Health Ingredients Market, consider subscribing to industry newsletters, following relevant companies and organizations, or regularly checking reputable industry news sources and publications.
Methodology
Step 1 - Identification of Relevant Samples Size from Population Database


Step 2 - Approaches for Defining Global Market Size (Value, Volume* & Price*)

Note*: In applicable scenarios
Step 3 - Data Sources
Primary Research
- Web Analytics
- Survey Reports
- Research Institute
- Latest Research Reports
- Opinion Leaders
Secondary Research
- Annual Reports
- White Paper
- Latest Press Release
- Industry Association
- Paid Database
- Investor Presentations

Step 4 - Data Triangulation
Involves using different sources of information in order to increase the validity of a study
These sources are likely to be stakeholders in a program - participants, other researchers, program staff, other community members, and so on.
Then we put all data in single framework & apply various statistical tools to find out the dynamic on the market.
During the analysis stage, feedback from the stakeholder groups would be compared to determine areas of agreement as well as areas of divergence


