
Key Insights
The global clinical trial industry, valued at $50.66 billion in 2025, is projected to experience robust growth, driven by a confluence of factors. The increasing prevalence of chronic diseases like cancer, diabetes, and cardiovascular conditions fuels demand for new therapies, necessitating extensive clinical trials. Advancements in technology, such as artificial intelligence (AI) and big data analytics, are streamlining trial design, data management, and patient recruitment, enhancing efficiency and reducing costs. Furthermore, the rising adoption of decentralized clinical trials (DCTs) expands access to geographically diverse patient populations and improves participant engagement. Regulatory changes promoting faster drug approvals and the increasing investment in research and development by pharmaceutical and biotechnology companies further contribute to market expansion. The industry is segmented across various design types (e.g., randomized controlled trials, observational studies), phases (Phase I-IV), and geographic regions, with North America currently holding a significant market share due to robust healthcare infrastructure and high research spending. Competitive dynamics are shaped by major players including Sanofi, Novo Nordisk, and Pfizer, who are constantly striving for innovation and strategic partnerships to maintain their market position.
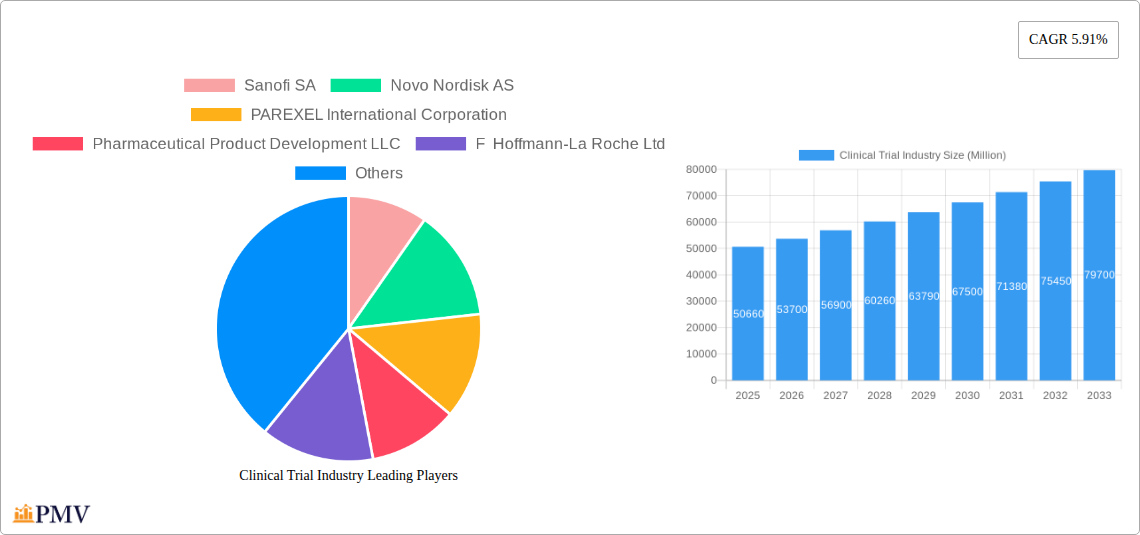
The projected Compound Annual Growth Rate (CAGR) of 5.91% indicates substantial growth throughout the forecast period (2025-2033). However, challenges remain. High costs associated with conducting clinical trials, stringent regulatory requirements, and complexities in patient recruitment pose significant hurdles. Despite these restraints, the industry's long-term outlook remains positive, fueled by ongoing technological advancements, increasing funding for biomedical research, and the persistent need for innovative treatments to address global health challenges. The market will likely see further consolidation among Contract Research Organizations (CROs) as larger companies acquire smaller ones to expand their service offerings and geographic reach. The growth in Asia-Pacific is expected to be particularly strong, driven by the rising middle class and increasing healthcare expenditure in countries like China and India.
Clinical Trial Industry Market Report: 2019-2033
This comprehensive report provides an in-depth analysis of the Clinical Trial Industry, offering invaluable insights for stakeholders, investors, and industry professionals. Covering the period from 2019 to 2033, with a focus on the 2025-2033 forecast period, this report details market segmentation, competitive dynamics, growth drivers, and key challenges, providing a clear path for strategic decision-making. The report projects a market value exceeding xx Million by 2033.
Clinical Trial Industry Market Structure & Competitive Dynamics
The clinical trial industry is characterized by a complex interplay of pharmaceutical giants, specialized contract research organizations (CROs), and technology providers. Market concentration is high, with a few large players dominating the landscape. Sanofi SA, Pfizer Inc, and Novo Nordisk AS, for instance, hold significant market share, driven by their extensive internal R&D and large-scale clinical trial programs. Smaller companies often specialize in niche areas or specific phases of clinical trials. The industry's innovation ecosystem is driven by advancements in technology, particularly in areas such as AI-powered data analytics, and the rising demand for decentralized clinical trials. The regulatory framework, varying across different geographies, plays a crucial role, impacting timelines and costs. Product substitutes are limited, with the focus primarily on optimizing existing methodologies and technologies. End-user trends, such as a rising focus on personalized medicine and patient-centric trials, are reshaping the industry landscape. M&A activity has been significant, with large CROs acquiring smaller companies to expand their service offerings and geographic reach. Deal values have fluctuated but remain in the hundreds of Millions, with deals exceeding xx Million not uncommon. Examples include (but aren't limited to) the acquisition of [Company A] by [Company B] in [Year], valued at xx Million.
- High Market Concentration: Dominated by a few major players.
- Significant M&A Activity: Driving consolidation and expansion of services.
- Technological Innovation: AI-powered data analytics and decentralized trials are key disruptors.
- Stringent Regulatory Frameworks: Impacting timelines and costs across geographies.
Clinical Trial Industry Industry Trends & Insights
The global clinical trial industry is experiencing robust growth, driven primarily by an increasing pipeline of new drugs and therapies, an aging global population leading to a higher prevalence of chronic diseases, and increased investment in R&D by pharmaceutical and biotechnology companies. Technological advancements, such as the use of wearable sensors and digital platforms for data collection, are significantly improving efficiency and reducing costs. A shift towards patient-centric trials is also underway, focusing on enhancing patient experience and improving recruitment and retention rates. This trend is further complemented by the adoption of decentralized clinical trials (DCTs) which enable greater patient participation. The market is projected to exhibit a Compound Annual Growth Rate (CAGR) of xx% during the forecast period (2025-2033). Market penetration of new technologies, like AI-driven analytics, is expected to increase substantially, reaching xx% by 2033. The competitive landscape is fiercely competitive, with companies vying for market share through innovation, strategic partnerships, and acquisitions.

Dominant Markets & Segments in Clinical Trial Industry
The North American region dominates the clinical trial market, driven by robust regulatory frameworks, substantial funding for research, and a large pool of skilled professionals. Within this region, the United States holds the largest market share.
- Design: Treatment studies constitute a larger market segment than non-randomized control trials (observational studies), due to the need for rigorous data to support drug approvals.
- Phase: Phase III trials represent the largest segment, requiring significant investment and participants before final regulatory approvals. Phase I trials have a smaller market size due to the relatively smaller number of participants involved.
- Key Drivers: Robust regulatory frameworks, substantial research funding, skilled workforce, strong technological infrastructure, and proactive government policies in North America are key growth drivers. The dominance of certain segments is also influenced by factors like the stage of drug development and the cost associated with conducting each phase.
Clinical Trial Industry Product Innovations
Recent innovations include advancements in data analytics, particularly AI and machine learning, improving trial design, patient recruitment, and data analysis. Decentralized clinical trial platforms are gaining traction, enabling remote data collection and increasing patient engagement. These innovations aim to streamline processes, reduce costs, and improve the overall efficiency of clinical trials. The market fit of these products is significant, as they address key challenges faced by the industry.
Report Segmentation & Scope
This report provides a detailed segmentation of the clinical trial industry across several key dimensions:
- Design: Treatment Studies and Non-randomized Control Trials (Observational Studies). Treatment studies are projected to hold the largest share, given their importance in drug development. Observational studies are expected to witness steady growth due to their increasing use in real-world data generation.
- Phase: Phase I, Phase II, Phase III, and Phase IV trials. Phase III trials will maintain the largest market share given the significant number of patients involved. The other phases all play essential, though comparatively smaller, roles in the overall drug development process. Each phase's market size and growth projections are detailed in the full report. Competitive dynamics within each phase differ, influenced by the level of specialization required and the scale of operations.
Key Drivers of Clinical Trial Industry Growth
Several key factors are driving the growth of the clinical trial industry. Increased R&D spending by pharmaceutical companies is a significant factor, fueled by the ongoing development of innovative therapies for various diseases. Technological advancements, particularly in AI and big data analytics, are improving efficiency and reducing costs. Favorable regulatory environments in certain regions and the increasing prevalence of chronic diseases are also contributing to market expansion.
Challenges in the Clinical Trial Industry Sector
The clinical trial industry faces several challenges, including stringent regulatory requirements that increase costs and complexity. Supply chain disruptions can impact timelines and budgets. Patient recruitment and retention remain significant hurdles, often leading to delays and increased costs. The high cost of clinical trials is a major barrier, particularly for smaller companies. Finally, intense competition among CROs and other service providers puts downward pressure on pricing.
Leading Players in the Clinical Trial Industry Market
- Sanofi SA
- Novo Nordisk AS
- PAREXEL International Corporation
- Pharmaceutical Product Development LLC
- F Hoffmann-La Roche Ltd
- Syneos Health
- ICON PLC
- Eli Lilly and Company
- ClinDatrix Inc
- Charles River Laboratory
- Clinipace
- IQVIA
- Laboratory Corporation of America
- Pfizer Inc
Key Developments in Clinical Trial Industry Sector
- July 2022: NIAID initiates an early-stage clinical trial for a Nipah virus vaccine. This highlights the ongoing focus on infectious disease research and development.
- May 2022: IAVI and Moderna begin a Phase I clinical trial of an mRNA vaccine antigen in Africa. This signifies the increasing adoption of mRNA technology and expansion of clinical trials into emerging markets.
Strategic Clinical Trial Industry Market Outlook
The clinical trial industry is poised for continued growth, driven by ongoing technological advancements, increasing R&D investment, and a rising prevalence of chronic diseases. Strategic opportunities exist for companies that can leverage technology to improve efficiency, reduce costs, and enhance patient engagement. Focus on personalized medicine, decentralized trials, and AI-powered data analytics will be crucial for success in the coming years. The market presents substantial potential for innovation and growth for companies that effectively navigate the challenges and capitalize on the opportunities presented.
Clinical Trial Industry Segmentation
-
1. Phase
- 1.1. Phase I
- 1.2. Phase II
- 1.3. Phase III
- 1.4. Phase IV
-
2. Design
-
2.1. Treatment Studies
- 2.1.1. Randomized Control Trial
- 2.1.2. Adaptive Clinical Trial
- 2.1.3. Non-randomized Control Trial
-
2.2. Observational Studies
- 2.2.1. Cohort Study
- 2.2.2. Case Control Study
- 2.2.3. Cross Sectional Study
- 2.2.4. Ecological Study
-
2.1. Treatment Studies
Clinical Trial Industry Segmentation By Geography
-
1. North America
- 1.1. United States
- 1.2. Canada
- 1.3. Mexico
-
2. Europe
- 2.1. Germany
- 2.2. United Kingdom
- 2.3. France
- 2.4. Italy
- 2.5. Spain
- 2.6. Rest of Europe
-
3. Asia Pacific
- 3.1. China
- 3.2. Japan
- 3.3. India
- 3.4. Australia
- 3.5. South Korea
- 3.6. Rest of Asia Pacific
-
4. Middle East and Africa
- 4.1. GCC
- 4.2. South Africa
- 4.3. Rest of Middle East and Africa
-
5. South America
- 5.1. Brazil
- 5.2. Argentina
- 5.3. Rest of South America

Clinical Trial Industry REPORT HIGHLIGHTS
| Aspects | Details |
|---|---|
| Study Period | 2019-2033 |
| Base Year | 2024 |
| Estimated Year | 2025 |
| Forecast Period | 2025-2033 |
| Historical Period | 2019-2024 |
| Growth Rate | CAGR of 5.91% from 2019-2033 |
| Segmentation |
|
Table of Contents
- 1. Introduction
- 1.1. Research Scope
- 1.2. Market Segmentation
- 1.3. Research Methodology
- 1.4. Definitions and Assumptions
- 2. Executive Summary
- 2.1. Introduction
- 3. Market Dynamics
- 3.1. Introduction
- 3.2. Market Drivers
- 3.2.1. Demand for Clinical Trials in the Emerging Markets; High R&D Expenditure of the Pharmaceutical Industry; Rising Prevalence of Diseases
- 3.3. Market Restrains
- 3.3.1. Lack of Skilled Workforce in Clinical Research; Stringent Regulations for Patient Enrollment
- 3.4. Market Trends
- 3.4.1. Phase III by Phase Segment is Expected to Grow Over the Forecast Period
- 4. Market Factor Analysis
- 4.1. Porters Five Forces
- 4.2. Supply/Value Chain
- 4.3. PESTEL analysis
- 4.4. Market Entropy
- 4.5. Patent/Trademark Analysis
- 5. Global Clinical Trial Industry Analysis, Insights and Forecast, 2019-2031
- 5.1. Market Analysis, Insights and Forecast - by Phase
- 5.1.1. Phase I
- 5.1.2. Phase II
- 5.1.3. Phase III
- 5.1.4. Phase IV
- 5.2. Market Analysis, Insights and Forecast - by Design
- 5.2.1. Treatment Studies
- 5.2.1.1. Randomized Control Trial
- 5.2.1.2. Adaptive Clinical Trial
- 5.2.1.3. Non-randomized Control Trial
- 5.2.2. Observational Studies
- 5.2.2.1. Cohort Study
- 5.2.2.2. Case Control Study
- 5.2.2.3. Cross Sectional Study
- 5.2.2.4. Ecological Study
- 5.2.1. Treatment Studies
- 5.3. Market Analysis, Insights and Forecast - by Region
- 5.3.1. North America
- 5.3.2. Europe
- 5.3.3. Asia Pacific
- 5.3.4. Middle East and Africa
- 5.3.5. South America
- 5.1. Market Analysis, Insights and Forecast - by Phase
- 6. North America Clinical Trial Industry Analysis, Insights and Forecast, 2019-2031
- 6.1. Market Analysis, Insights and Forecast - by Phase
- 6.1.1. Phase I
- 6.1.2. Phase II
- 6.1.3. Phase III
- 6.1.4. Phase IV
- 6.2. Market Analysis, Insights and Forecast - by Design
- 6.2.1. Treatment Studies
- 6.2.1.1. Randomized Control Trial
- 6.2.1.2. Adaptive Clinical Trial
- 6.2.1.3. Non-randomized Control Trial
- 6.2.2. Observational Studies
- 6.2.2.1. Cohort Study
- 6.2.2.2. Case Control Study
- 6.2.2.3. Cross Sectional Study
- 6.2.2.4. Ecological Study
- 6.2.1. Treatment Studies
- 6.1. Market Analysis, Insights and Forecast - by Phase
- 7. Europe Clinical Trial Industry Analysis, Insights and Forecast, 2019-2031
- 7.1. Market Analysis, Insights and Forecast - by Phase
- 7.1.1. Phase I
- 7.1.2. Phase II
- 7.1.3. Phase III
- 7.1.4. Phase IV
- 7.2. Market Analysis, Insights and Forecast - by Design
- 7.2.1. Treatment Studies
- 7.2.1.1. Randomized Control Trial
- 7.2.1.2. Adaptive Clinical Trial
- 7.2.1.3. Non-randomized Control Trial
- 7.2.2. Observational Studies
- 7.2.2.1. Cohort Study
- 7.2.2.2. Case Control Study
- 7.2.2.3. Cross Sectional Study
- 7.2.2.4. Ecological Study
- 7.2.1. Treatment Studies
- 7.1. Market Analysis, Insights and Forecast - by Phase
- 8. Asia Pacific Clinical Trial Industry Analysis, Insights and Forecast, 2019-2031
- 8.1. Market Analysis, Insights and Forecast - by Phase
- 8.1.1. Phase I
- 8.1.2. Phase II
- 8.1.3. Phase III
- 8.1.4. Phase IV
- 8.2. Market Analysis, Insights and Forecast - by Design
- 8.2.1. Treatment Studies
- 8.2.1.1. Randomized Control Trial
- 8.2.1.2. Adaptive Clinical Trial
- 8.2.1.3. Non-randomized Control Trial
- 8.2.2. Observational Studies
- 8.2.2.1. Cohort Study
- 8.2.2.2. Case Control Study
- 8.2.2.3. Cross Sectional Study
- 8.2.2.4. Ecological Study
- 8.2.1. Treatment Studies
- 8.1. Market Analysis, Insights and Forecast - by Phase
- 9. Middle East and Africa Clinical Trial Industry Analysis, Insights and Forecast, 2019-2031
- 9.1. Market Analysis, Insights and Forecast - by Phase
- 9.1.1. Phase I
- 9.1.2. Phase II
- 9.1.3. Phase III
- 9.1.4. Phase IV
- 9.2. Market Analysis, Insights and Forecast - by Design
- 9.2.1. Treatment Studies
- 9.2.1.1. Randomized Control Trial
- 9.2.1.2. Adaptive Clinical Trial
- 9.2.1.3. Non-randomized Control Trial
- 9.2.2. Observational Studies
- 9.2.2.1. Cohort Study
- 9.2.2.2. Case Control Study
- 9.2.2.3. Cross Sectional Study
- 9.2.2.4. Ecological Study
- 9.2.1. Treatment Studies
- 9.1. Market Analysis, Insights and Forecast - by Phase
- 10. South America Clinical Trial Industry Analysis, Insights and Forecast, 2019-2031
- 10.1. Market Analysis, Insights and Forecast - by Phase
- 10.1.1. Phase I
- 10.1.2. Phase II
- 10.1.3. Phase III
- 10.1.4. Phase IV
- 10.2. Market Analysis, Insights and Forecast - by Design
- 10.2.1. Treatment Studies
- 10.2.1.1. Randomized Control Trial
- 10.2.1.2. Adaptive Clinical Trial
- 10.2.1.3. Non-randomized Control Trial
- 10.2.2. Observational Studies
- 10.2.2.1. Cohort Study
- 10.2.2.2. Case Control Study
- 10.2.2.3. Cross Sectional Study
- 10.2.2.4. Ecological Study
- 10.2.1. Treatment Studies
- 10.1. Market Analysis, Insights and Forecast - by Phase
- 11. North America Clinical Trial Industry Analysis, Insights and Forecast, 2019-2031
- 11.1. Market Analysis, Insights and Forecast - By Country/Sub-region
- 11.1.1 United States
- 11.1.2 Canada
- 11.1.3 Mexico
- 12. Europe Clinical Trial Industry Analysis, Insights and Forecast, 2019-2031
- 12.1. Market Analysis, Insights and Forecast - By Country/Sub-region
- 12.1.1 Germany
- 12.1.2 United Kingdom
- 12.1.3 France
- 12.1.4 Italy
- 12.1.5 Spain
- 12.1.6 Rest of Europe
- 13. Asia Pacific Clinical Trial Industry Analysis, Insights and Forecast, 2019-2031
- 13.1. Market Analysis, Insights and Forecast - By Country/Sub-region
- 13.1.1 China
- 13.1.2 Japan
- 13.1.3 India
- 13.1.4 Australia
- 13.1.5 South Korea
- 13.1.6 Rest of Asia Pacific
- 14. Middle East and Africa Clinical Trial Industry Analysis, Insights and Forecast, 2019-2031
- 14.1. Market Analysis, Insights and Forecast - By Country/Sub-region
- 14.1.1 GCC
- 14.1.2 South Africa
- 14.1.3 Rest of Middle East and Africa
- 15. South America Clinical Trial Industry Analysis, Insights and Forecast, 2019-2031
- 15.1. Market Analysis, Insights and Forecast - By Country/Sub-region
- 15.1.1 Brazil
- 15.1.2 Argentina
- 15.1.3 Rest of South America
- 16. Competitive Analysis
- 16.1. Global Market Share Analysis 2024
- 16.2. Company Profiles
- 16.2.1 Sanofi SA
- 16.2.1.1. Overview
- 16.2.1.2. Products
- 16.2.1.3. SWOT Analysis
- 16.2.1.4. Recent Developments
- 16.2.1.5. Financials (Based on Availability)
- 16.2.2 Novo Nordisk AS
- 16.2.2.1. Overview
- 16.2.2.2. Products
- 16.2.2.3. SWOT Analysis
- 16.2.2.4. Recent Developments
- 16.2.2.5. Financials (Based on Availability)
- 16.2.3 PAREXEL International Corporation
- 16.2.3.1. Overview
- 16.2.3.2. Products
- 16.2.3.3. SWOT Analysis
- 16.2.3.4. Recent Developments
- 16.2.3.5. Financials (Based on Availability)
- 16.2.4 Pharmaceutical Product Development LLC
- 16.2.4.1. Overview
- 16.2.4.2. Products
- 16.2.4.3. SWOT Analysis
- 16.2.4.4. Recent Developments
- 16.2.4.5. Financials (Based on Availability)
- 16.2.5 F Hoffmann-La Roche Ltd
- 16.2.5.1. Overview
- 16.2.5.2. Products
- 16.2.5.3. SWOT Analysis
- 16.2.5.4. Recent Developments
- 16.2.5.5. Financials (Based on Availability)
- 16.2.6 Syneos Health
- 16.2.6.1. Overview
- 16.2.6.2. Products
- 16.2.6.3. SWOT Analysis
- 16.2.6.4. Recent Developments
- 16.2.6.5. Financials (Based on Availability)
- 16.2.7 ICON PLC
- 16.2.7.1. Overview
- 16.2.7.2. Products
- 16.2.7.3. SWOT Analysis
- 16.2.7.4. Recent Developments
- 16.2.7.5. Financials (Based on Availability)
- 16.2.8 Eli Lilly and Company
- 16.2.8.1. Overview
- 16.2.8.2. Products
- 16.2.8.3. SWOT Analysis
- 16.2.8.4. Recent Developments
- 16.2.8.5. Financials (Based on Availability)
- 16.2.9 ClinDatrix Inc
- 16.2.9.1. Overview
- 16.2.9.2. Products
- 16.2.9.3. SWOT Analysis
- 16.2.9.4. Recent Developments
- 16.2.9.5. Financials (Based on Availability)
- 16.2.10 Charles River Laboratory
- 16.2.10.1. Overview
- 16.2.10.2. Products
- 16.2.10.3. SWOT Analysis
- 16.2.10.4. Recent Developments
- 16.2.10.5. Financials (Based on Availability)
- 16.2.11 Clinipace
- 16.2.11.1. Overview
- 16.2.11.2. Products
- 16.2.11.3. SWOT Analysis
- 16.2.11.4. Recent Developments
- 16.2.11.5. Financials (Based on Availability)
- 16.2.12 IQVIA
- 16.2.12.1. Overview
- 16.2.12.2. Products
- 16.2.12.3. SWOT Analysis
- 16.2.12.4. Recent Developments
- 16.2.12.5. Financials (Based on Availability)
- 16.2.13 Laboratory Corporation of America
- 16.2.13.1. Overview
- 16.2.13.2. Products
- 16.2.13.3. SWOT Analysis
- 16.2.13.4. Recent Developments
- 16.2.13.5. Financials (Based on Availability)
- 16.2.14 Pfizer Inc
- 16.2.14.1. Overview
- 16.2.14.2. Products
- 16.2.14.3. SWOT Analysis
- 16.2.14.4. Recent Developments
- 16.2.14.5. Financials (Based on Availability)
- 16.2.1 Sanofi SA
List of Figures
- Figure 1: Global Clinical Trial Industry Revenue Breakdown (Million, %) by Region 2024 & 2032
- Figure 2: North America Clinical Trial Industry Revenue (Million), by Country 2024 & 2032
- Figure 3: North America Clinical Trial Industry Revenue Share (%), by Country 2024 & 2032
- Figure 4: Europe Clinical Trial Industry Revenue (Million), by Country 2024 & 2032
- Figure 5: Europe Clinical Trial Industry Revenue Share (%), by Country 2024 & 2032
- Figure 6: Asia Pacific Clinical Trial Industry Revenue (Million), by Country 2024 & 2032
- Figure 7: Asia Pacific Clinical Trial Industry Revenue Share (%), by Country 2024 & 2032
- Figure 8: Middle East and Africa Clinical Trial Industry Revenue (Million), by Country 2024 & 2032
- Figure 9: Middle East and Africa Clinical Trial Industry Revenue Share (%), by Country 2024 & 2032
- Figure 10: South America Clinical Trial Industry Revenue (Million), by Country 2024 & 2032
- Figure 11: South America Clinical Trial Industry Revenue Share (%), by Country 2024 & 2032
- Figure 12: North America Clinical Trial Industry Revenue (Million), by Phase 2024 & 2032
- Figure 13: North America Clinical Trial Industry Revenue Share (%), by Phase 2024 & 2032
- Figure 14: North America Clinical Trial Industry Revenue (Million), by Design 2024 & 2032
- Figure 15: North America Clinical Trial Industry Revenue Share (%), by Design 2024 & 2032
- Figure 16: North America Clinical Trial Industry Revenue (Million), by Country 2024 & 2032
- Figure 17: North America Clinical Trial Industry Revenue Share (%), by Country 2024 & 2032
- Figure 18: Europe Clinical Trial Industry Revenue (Million), by Phase 2024 & 2032
- Figure 19: Europe Clinical Trial Industry Revenue Share (%), by Phase 2024 & 2032
- Figure 20: Europe Clinical Trial Industry Revenue (Million), by Design 2024 & 2032
- Figure 21: Europe Clinical Trial Industry Revenue Share (%), by Design 2024 & 2032
- Figure 22: Europe Clinical Trial Industry Revenue (Million), by Country 2024 & 2032
- Figure 23: Europe Clinical Trial Industry Revenue Share (%), by Country 2024 & 2032
- Figure 24: Asia Pacific Clinical Trial Industry Revenue (Million), by Phase 2024 & 2032
- Figure 25: Asia Pacific Clinical Trial Industry Revenue Share (%), by Phase 2024 & 2032
- Figure 26: Asia Pacific Clinical Trial Industry Revenue (Million), by Design 2024 & 2032
- Figure 27: Asia Pacific Clinical Trial Industry Revenue Share (%), by Design 2024 & 2032
- Figure 28: Asia Pacific Clinical Trial Industry Revenue (Million), by Country 2024 & 2032
- Figure 29: Asia Pacific Clinical Trial Industry Revenue Share (%), by Country 2024 & 2032
- Figure 30: Middle East and Africa Clinical Trial Industry Revenue (Million), by Phase 2024 & 2032
- Figure 31: Middle East and Africa Clinical Trial Industry Revenue Share (%), by Phase 2024 & 2032
- Figure 32: Middle East and Africa Clinical Trial Industry Revenue (Million), by Design 2024 & 2032
- Figure 33: Middle East and Africa Clinical Trial Industry Revenue Share (%), by Design 2024 & 2032
- Figure 34: Middle East and Africa Clinical Trial Industry Revenue (Million), by Country 2024 & 2032
- Figure 35: Middle East and Africa Clinical Trial Industry Revenue Share (%), by Country 2024 & 2032
- Figure 36: South America Clinical Trial Industry Revenue (Million), by Phase 2024 & 2032
- Figure 37: South America Clinical Trial Industry Revenue Share (%), by Phase 2024 & 2032
- Figure 38: South America Clinical Trial Industry Revenue (Million), by Design 2024 & 2032
- Figure 39: South America Clinical Trial Industry Revenue Share (%), by Design 2024 & 2032
- Figure 40: South America Clinical Trial Industry Revenue (Million), by Country 2024 & 2032
- Figure 41: South America Clinical Trial Industry Revenue Share (%), by Country 2024 & 2032
List of Tables
- Table 1: Global Clinical Trial Industry Revenue Million Forecast, by Region 2019 & 2032
- Table 2: Global Clinical Trial Industry Revenue Million Forecast, by Phase 2019 & 2032
- Table 3: Global Clinical Trial Industry Revenue Million Forecast, by Design 2019 & 2032
- Table 4: Global Clinical Trial Industry Revenue Million Forecast, by Region 2019 & 2032
- Table 5: Global Clinical Trial Industry Revenue Million Forecast, by Country 2019 & 2032
- Table 6: United States Clinical Trial Industry Revenue (Million) Forecast, by Application 2019 & 2032
- Table 7: Canada Clinical Trial Industry Revenue (Million) Forecast, by Application 2019 & 2032
- Table 8: Mexico Clinical Trial Industry Revenue (Million) Forecast, by Application 2019 & 2032
- Table 9: Global Clinical Trial Industry Revenue Million Forecast, by Country 2019 & 2032
- Table 10: Germany Clinical Trial Industry Revenue (Million) Forecast, by Application 2019 & 2032
- Table 11: United Kingdom Clinical Trial Industry Revenue (Million) Forecast, by Application 2019 & 2032
- Table 12: France Clinical Trial Industry Revenue (Million) Forecast, by Application 2019 & 2032
- Table 13: Italy Clinical Trial Industry Revenue (Million) Forecast, by Application 2019 & 2032
- Table 14: Spain Clinical Trial Industry Revenue (Million) Forecast, by Application 2019 & 2032
- Table 15: Rest of Europe Clinical Trial Industry Revenue (Million) Forecast, by Application 2019 & 2032
- Table 16: Global Clinical Trial Industry Revenue Million Forecast, by Country 2019 & 2032
- Table 17: China Clinical Trial Industry Revenue (Million) Forecast, by Application 2019 & 2032
- Table 18: Japan Clinical Trial Industry Revenue (Million) Forecast, by Application 2019 & 2032
- Table 19: India Clinical Trial Industry Revenue (Million) Forecast, by Application 2019 & 2032
- Table 20: Australia Clinical Trial Industry Revenue (Million) Forecast, by Application 2019 & 2032
- Table 21: South Korea Clinical Trial Industry Revenue (Million) Forecast, by Application 2019 & 2032
- Table 22: Rest of Asia Pacific Clinical Trial Industry Revenue (Million) Forecast, by Application 2019 & 2032
- Table 23: Global Clinical Trial Industry Revenue Million Forecast, by Country 2019 & 2032
- Table 24: GCC Clinical Trial Industry Revenue (Million) Forecast, by Application 2019 & 2032
- Table 25: South Africa Clinical Trial Industry Revenue (Million) Forecast, by Application 2019 & 2032
- Table 26: Rest of Middle East and Africa Clinical Trial Industry Revenue (Million) Forecast, by Application 2019 & 2032
- Table 27: Global Clinical Trial Industry Revenue Million Forecast, by Country 2019 & 2032
- Table 28: Brazil Clinical Trial Industry Revenue (Million) Forecast, by Application 2019 & 2032
- Table 29: Argentina Clinical Trial Industry Revenue (Million) Forecast, by Application 2019 & 2032
- Table 30: Rest of South America Clinical Trial Industry Revenue (Million) Forecast, by Application 2019 & 2032
- Table 31: Global Clinical Trial Industry Revenue Million Forecast, by Phase 2019 & 2032
- Table 32: Global Clinical Trial Industry Revenue Million Forecast, by Design 2019 & 2032
- Table 33: Global Clinical Trial Industry Revenue Million Forecast, by Country 2019 & 2032
- Table 34: United States Clinical Trial Industry Revenue (Million) Forecast, by Application 2019 & 2032
- Table 35: Canada Clinical Trial Industry Revenue (Million) Forecast, by Application 2019 & 2032
- Table 36: Mexico Clinical Trial Industry Revenue (Million) Forecast, by Application 2019 & 2032
- Table 37: Global Clinical Trial Industry Revenue Million Forecast, by Phase 2019 & 2032
- Table 38: Global Clinical Trial Industry Revenue Million Forecast, by Design 2019 & 2032
- Table 39: Global Clinical Trial Industry Revenue Million Forecast, by Country 2019 & 2032
- Table 40: Germany Clinical Trial Industry Revenue (Million) Forecast, by Application 2019 & 2032
- Table 41: United Kingdom Clinical Trial Industry Revenue (Million) Forecast, by Application 2019 & 2032
- Table 42: France Clinical Trial Industry Revenue (Million) Forecast, by Application 2019 & 2032
- Table 43: Italy Clinical Trial Industry Revenue (Million) Forecast, by Application 2019 & 2032
- Table 44: Spain Clinical Trial Industry Revenue (Million) Forecast, by Application 2019 & 2032
- Table 45: Rest of Europe Clinical Trial Industry Revenue (Million) Forecast, by Application 2019 & 2032
- Table 46: Global Clinical Trial Industry Revenue Million Forecast, by Phase 2019 & 2032
- Table 47: Global Clinical Trial Industry Revenue Million Forecast, by Design 2019 & 2032
- Table 48: Global Clinical Trial Industry Revenue Million Forecast, by Country 2019 & 2032
- Table 49: China Clinical Trial Industry Revenue (Million) Forecast, by Application 2019 & 2032
- Table 50: Japan Clinical Trial Industry Revenue (Million) Forecast, by Application 2019 & 2032
- Table 51: India Clinical Trial Industry Revenue (Million) Forecast, by Application 2019 & 2032
- Table 52: Australia Clinical Trial Industry Revenue (Million) Forecast, by Application 2019 & 2032
- Table 53: South Korea Clinical Trial Industry Revenue (Million) Forecast, by Application 2019 & 2032
- Table 54: Rest of Asia Pacific Clinical Trial Industry Revenue (Million) Forecast, by Application 2019 & 2032
- Table 55: Global Clinical Trial Industry Revenue Million Forecast, by Phase 2019 & 2032
- Table 56: Global Clinical Trial Industry Revenue Million Forecast, by Design 2019 & 2032
- Table 57: Global Clinical Trial Industry Revenue Million Forecast, by Country 2019 & 2032
- Table 58: GCC Clinical Trial Industry Revenue (Million) Forecast, by Application 2019 & 2032
- Table 59: South Africa Clinical Trial Industry Revenue (Million) Forecast, by Application 2019 & 2032
- Table 60: Rest of Middle East and Africa Clinical Trial Industry Revenue (Million) Forecast, by Application 2019 & 2032
- Table 61: Global Clinical Trial Industry Revenue Million Forecast, by Phase 2019 & 2032
- Table 62: Global Clinical Trial Industry Revenue Million Forecast, by Design 2019 & 2032
- Table 63: Global Clinical Trial Industry Revenue Million Forecast, by Country 2019 & 2032
- Table 64: Brazil Clinical Trial Industry Revenue (Million) Forecast, by Application 2019 & 2032
- Table 65: Argentina Clinical Trial Industry Revenue (Million) Forecast, by Application 2019 & 2032
- Table 66: Rest of South America Clinical Trial Industry Revenue (Million) Forecast, by Application 2019 & 2032
Frequently Asked Questions
1. What is the projected Compound Annual Growth Rate (CAGR) of the Clinical Trial Industry?
The projected CAGR is approximately 5.91%.
2. Which companies are prominent players in the Clinical Trial Industry?
Key companies in the market include Sanofi SA, Novo Nordisk AS, PAREXEL International Corporation, Pharmaceutical Product Development LLC, F Hoffmann-La Roche Ltd, Syneos Health, ICON PLC, Eli Lilly and Company, ClinDatrix Inc, Charles River Laboratory, Clinipace, IQVIA, Laboratory Corporation of America, Pfizer Inc.
3. What are the main segments of the Clinical Trial Industry?
The market segments include Phase, Design.
4. Can you provide details about the market size?
The market size is estimated to be USD 50.66 Million as of 2022.
5. What are some drivers contributing to market growth?
Demand for Clinical Trials in the Emerging Markets; High R&D Expenditure of the Pharmaceutical Industry; Rising Prevalence of Diseases.
6. What are the notable trends driving market growth?
Phase III by Phase Segment is Expected to Grow Over the Forecast Period.
7. Are there any restraints impacting market growth?
Lack of Skilled Workforce in Clinical Research; Stringent Regulations for Patient Enrollment.
8. Can you provide examples of recent developments in the market?
July 2022: An early-stage clinical trial investigating an investigational vaccine to stave off Nipah virus infection was started by the National Institute of Allergy and Infectious Diseases (NIAID), a division of the National Institutes of Health (NIH) of the United States.
9. What pricing options are available for accessing the report?
Pricing options include single-user, multi-user, and enterprise licenses priced at USD 4750, USD 5250, and USD 8750 respectively.
10. Is the market size provided in terms of value or volume?
The market size is provided in terms of value, measured in Million.
11. Are there any specific market keywords associated with the report?
Yes, the market keyword associated with the report is "Clinical Trial Industry," which aids in identifying and referencing the specific market segment covered.
12. How do I determine which pricing option suits my needs best?
The pricing options vary based on user requirements and access needs. Individual users may opt for single-user licenses, while businesses requiring broader access may choose multi-user or enterprise licenses for cost-effective access to the report.
13. Are there any additional resources or data provided in the Clinical Trial Industry report?
While the report offers comprehensive insights, it's advisable to review the specific contents or supplementary materials provided to ascertain if additional resources or data are available.
14. How can I stay updated on further developments or reports in the Clinical Trial Industry?
To stay informed about further developments, trends, and reports in the Clinical Trial Industry, consider subscribing to industry newsletters, following relevant companies and organizations, or regularly checking reputable industry news sources and publications.
Methodology
Step 1 - Identification of Relevant Samples Size from Population Database


Step 2 - Approaches for Defining Global Market Size (Value, Volume* & Price*)

Note*: In applicable scenarios
Step 3 - Data Sources
Primary Research
- Web Analytics
- Survey Reports
- Research Institute
- Latest Research Reports
- Opinion Leaders
Secondary Research
- Annual Reports
- White Paper
- Latest Press Release
- Industry Association
- Paid Database
- Investor Presentations

Step 4 - Data Triangulation
Involves using different sources of information in order to increase the validity of a study
These sources are likely to be stakeholders in a program - participants, other researchers, program staff, other community members, and so on.
Then we put all data in single framework & apply various statistical tools to find out the dynamic on the market.
During the analysis stage, feedback from the stakeholder groups would be compared to determine areas of agreement as well as areas of divergence


