
Key Insights
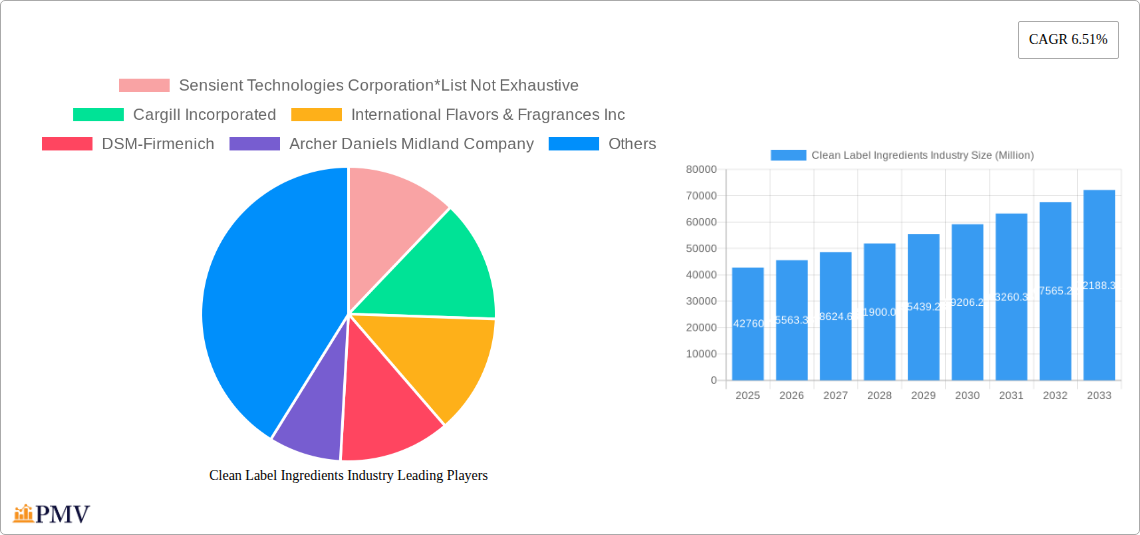
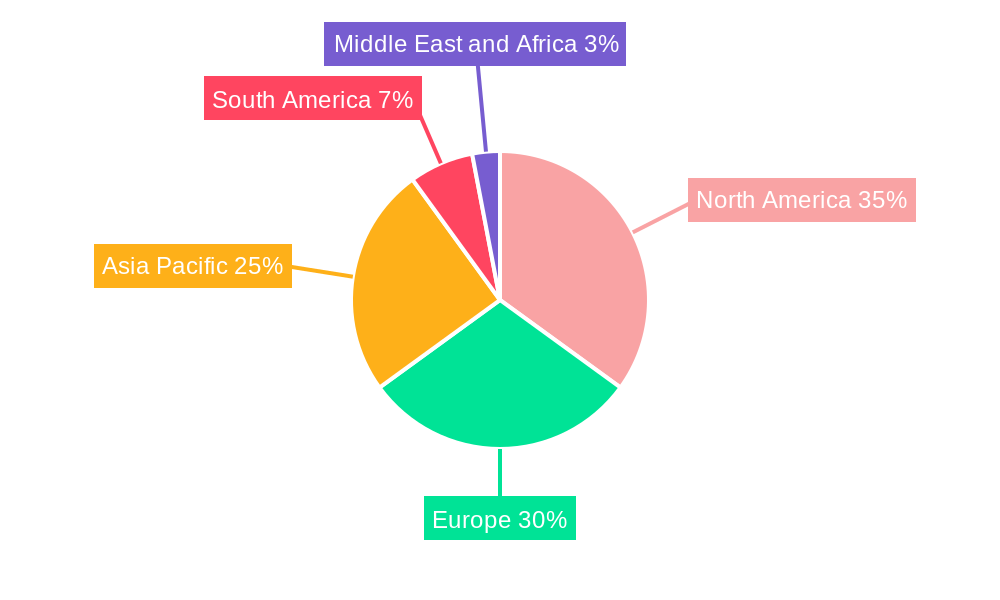
The clean label ingredients market, valued at $42.76 billion in 2025, is projected to experience robust growth, driven by increasing consumer demand for natural, minimally processed foods. This preference for transparency and readily understandable ingredient lists is fueling the market's expansion. Key drivers include the rising awareness of health and wellness, a growing aversion to artificial additives and preservatives, and a surge in popularity of plant-based and organic products. The market segmentation reveals significant opportunities across various product types, with food preservatives, sweeteners, and colorants holding substantial shares. Application-wise, bakery and confectionery, dairy, and beverage segments are major contributors to market revenue. While precise figures for individual segments are unavailable, a reasonable estimation based on industry trends suggests that food preservatives and sweeteners likely represent a larger portion of the market value compared to colorants or hydrocolloids. Similarly, bakery and confectionery applications likely command a significant share of the market due to high volume consumption and the increasing demand for clean label options in these categories. Geographic distribution shows North America and Europe as leading markets, followed by the Asia-Pacific region experiencing rapid growth due to increasing disposable incomes and changing consumer preferences. The market is characterized by a high degree of competition with established players such as Sensient Technologies, Cargill, and IFF leading the charge in innovation and product development within the clean label space.
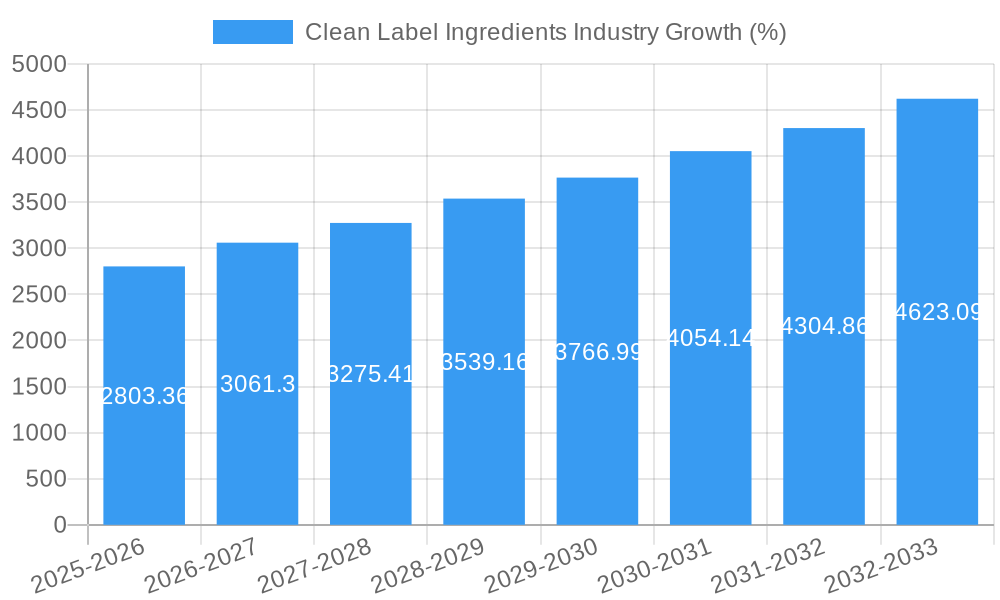
The forecast period (2025-2033) anticipates continued expansion, projected by a Compound Annual Growth Rate (CAGR) of 6.51%. This sustained growth will be influenced by factors such as innovative product development focusing on natural alternatives, increasing investments in research and development by key players, and the expanding range of clean label ingredients available to food manufacturers. Regulatory changes promoting transparency in food labeling also contribute positively to market growth. However, challenges remain, including higher production costs associated with clean label ingredients compared to conventional alternatives. This price differential can pose a barrier to entry for smaller manufacturers. Furthermore, maintaining the quality and consistency of naturally derived ingredients can present logistical hurdles for large-scale production. Despite these challenges, the long-term outlook for the clean label ingredients market remains positive, driven by persistent consumer demand and ongoing industry innovation.
Clean Label Ingredients Industry Market Report: 2019-2033
This comprehensive report provides a detailed analysis of the Clean Label Ingredients market, projecting a substantial growth trajectory throughout the forecast period (2025-2033). With a focus on key market segments, competitive dynamics, and emerging trends, this report offers invaluable insights for businesses operating within or seeking entry into this rapidly evolving sector. The report covers a historical period of 2019-2024, with 2025 serving as the base and estimated year. The study period encompasses 2019-2033, offering a long-term perspective on market evolution. The market is valued at xx Million in 2025 and is projected to reach xx Million by 2033, exhibiting a CAGR of xx%.
Clean Label Ingredients Industry Market Structure & Competitive Dynamics
The clean label ingredients market is characterized by a moderately consolidated structure, with several major players holding significant market share. Companies like Sensient Technologies Corporation, Cargill Incorporated, International Flavors & Fragrances Inc, DSM-Firmenich, Archer Daniels Midland Company, Ajinomoto Co Inc, Tate & Lyle PLC, Kerry Group PLC, Ingredion Incorporated, and Corbion NV are key contenders, constantly engaged in innovation and strategic acquisitions to maintain their competitive edge. Market share fluctuates based on product innovation, successful marketing, and strategic partnerships. For example, Cargill and ADM hold a combined market share estimated at approximately 30% in 2025, driven by their diverse product portfolios and strong distribution networks. Mergers and acquisitions (M&A) are a prominent feature, with deal values exceeding xx Million in the last five years, indicating a dynamic landscape shaped by consolidation and expansion strategies. The regulatory framework, particularly concerning food safety and labeling regulations, significantly influences market dynamics. Growing consumer demand for natural and transparent food products fuels the market’s growth, while the availability of substitutes, such as synthetic alternatives, poses a challenge to market penetration. Innovation in clean label ingredients is constantly driven by the increasing demand for healthier and more sustainable food choices. End-user trends, focused on health and wellness, further contribute to the market's expansion.
Clean Label Ingredients Industry Industry Trends & Insights
The clean label ingredients market is experiencing robust growth, driven by several interconnected factors. The rising consumer preference for natural, non-GMO, and organic products is a primary driver. Health-conscious consumers are increasingly scrutinizing ingredient lists, pushing manufacturers to adopt cleaner labeling practices. This trend is further amplified by heightened awareness of food allergies and intolerances, creating significant opportunities for clean label ingredient suppliers. Technological advancements, such as improved extraction techniques and fermentation processes, are also contributing to the market expansion. These advancements lead to more sustainable and efficient production of clean label ingredients. The market is witnessing a shift towards plant-based ingredients, reflecting growing concerns about animal welfare and environmental sustainability. The increasing popularity of plant-based meats and dairy alternatives is fueling demand for clean label ingredients specifically tailored to these applications. Competitive dynamics are characterized by intense innovation, strategic partnerships, and geographic expansion, as companies strive to capitalize on the growing market potential. The market penetration of clean label ingredients is rapidly increasing, particularly in developed economies like North America and Europe. The projected CAGR of xx% signifies the market's robust growth momentum.
Dominant Markets & Segments in Clean Label Ingredients Industry
- Leading Region/Country: North America (particularly the United States) holds the largest market share in the clean label ingredients sector. This dominance is primarily attributed to the high consumer awareness of clean labels, stringent regulatory frameworks pushing for transparency, and high disposable incomes enabling greater spending on premium food products. Europe is another significant region exhibiting strong growth, driven by similar consumer preferences and regulatory pressures.
- Dominant Product Types: Food flavors and enhancers hold a substantial market share, followed by food sweeteners and food preservatives. The demand for these product types is strongly linked to consumer preferences for natural flavors and extended shelf life. The increasing use of natural sweeteners as a healthier alternative is also a significant factor.
- Dominant Applications: The bakery and confectionery sector is a primary application area for clean label ingredients, driven by consumers’ desire for healthier treats and snacks. Dairy and frozen desserts, as well as beverages, are also important applications due to a similar focus on natural and healthy options.
Key drivers fueling the dominance of these segments and regions include:
- Strong consumer demand for natural and organic products.
- Favorable regulatory frameworks promoting transparency in food labeling.
- Growing awareness of health and wellness among consumers.
- Increasing investment in research and development of innovative clean label ingredients.
- Robust food processing and manufacturing industries.
Clean Label Ingredients Industry Product Innovations
Recent years have witnessed significant innovations in clean label ingredients, driven by consumer demand and technological advancements. New extraction methods are yielding more potent and sustainable natural colors and flavors. The development of plant-based alternatives to traditional ingredients like dairy and eggs is driving innovation in this sector. Companies are focusing on creating clean label ingredients that can mimic the functionality of their conventional counterparts, ensuring seamless integration into existing food products without compromising on taste or texture. This focus on functionality and performance is a key competitive advantage in a market increasingly demanding high-quality, clean alternatives.
Report Segmentation & Scope
The report segments the clean label ingredients market by product type (Food Preservatives, Food Sweeteners, Food Colorants, Food Hydrocolloids, Food Flavors and Enhancers, Other Product Types) and application (Bakery and Confectionery, Dairy and Frozen Desserts, Beverages, Meat and Meat Products, Sauces and Condiments, Other Applications). Each segment’s market size, growth projections, and competitive dynamics are comprehensively analyzed, providing a detailed understanding of the various market niches and their growth potentials. The report also includes an analysis of regional markets, examining geographical variations in consumer preferences, regulatory landscapes, and market maturity levels.
Key Drivers of Clean Label Ingredients Industry Growth
The growth of the clean label ingredients industry is propelled by several factors: the rising consumer awareness of health and wellness, a growing preference for natural and organic products, increased transparency demands in food labeling, and a surge in demand for sustainable and ethically sourced ingredients. Stringent regulations mandating cleaner labeling practices further fuel this market growth. Technological advancements in extraction and production processes enhance the efficiency and cost-effectiveness of clean label ingredients, while innovations like plant-based alternatives to conventional ingredients contribute to market expansion and diversification.
Challenges in the Clean Label Ingredients Industry Sector
The clean label ingredients industry faces certain challenges including cost-competitiveness with conventional ingredients, ensuring consistent quality and supply chain reliability for natural ingredients, and navigating complex regulatory landscapes varying across different regions. Maintaining the balance between cost-effectiveness and meeting stringent clean label standards is a crucial challenge faced by many companies. Supply chain vulnerabilities, especially for specific niche ingredients, can pose a significant risk to production consistency and market stability. Fluctuating raw material prices can impact profitability.
Leading Players in the Clean Label Ingredients Industry Market
- Sensient Technologies Corporation
- Cargill Incorporated
- International Flavors & Fragrances Inc
- DSM-Firmenich
- Archer Daniels Midland Company
- Ajinomoto Co Inc
- Tate & Lyle PLC
- Kerry Group PLC
- Ingredion Incorporated
- Corbion NV
Key Developments in Clean Label Ingredients Industry Sector
- February 2024: Ajinomoto Co. opened a new office in Silicon Valley, expanding its reach in the US clean label ingredients market. This signifies a strategic move to capture a larger share of the growing US market.
- October 2023: International Flavors & Fragrances Inc. launched Methanova, a novel methylcellulose for the biotechnology industry, showcasing innovation in plant-based biopolymers. This demonstrates the industry’s expansion beyond food applications.
- August 2022: Archer-Daniels-Midland Company partnered with New Culture, indicating a growing trend of collaborations focused on sustainable and innovative ingredients. This partnership underscores the industry's shift towards plant-based alternatives and sustainability.
Strategic Clean Label Ingredients Industry Market Outlook
The clean label ingredients market presents significant growth opportunities. Continued consumer demand for healthier and more sustainable food products, combined with ongoing technological advancements and strategic partnerships, will drive market expansion in the coming years. Companies focusing on innovation, sustainable sourcing, and building strong supply chains will be best positioned to capitalize on this growth. The market's future is promising, with substantial potential for expansion across various product types and applications. Expanding into new geographic regions and developing value-added products are likely to become key strategies for companies seeking competitive advantage.
Clean Label Ingredients Industry Segmentation
-
1. Product Type
- 1.1. Food Preservatives
- 1.2. Food Sweeteners
- 1.3. Food Colorants
- 1.4. Food Hydrocolloids
- 1.5. Food Flavors and Enhancers
- 1.6. Other Product Types
-
2. Application
- 2.1. Bakery and Confectionery
- 2.2. Dairy and Frozen Desserts
- 2.3. Beverages
- 2.4. Meat and Meat Products
- 2.5. Sauces and Condiments
- 2.6. Other Applications
Clean Label Ingredients Industry Segmentation By Geography
-
1. North America
- 1.1. United States
- 1.2. Canada
- 1.3. Mexico
- 1.4. Rest of North America
-
2. Europe
- 2.1. United Kingdom
- 2.2. Germany
- 2.3. Spain
- 2.4. France
- 2.5. Italy
- 2.6. Russia
- 2.7. Rest of Europe
-
3. Asia Pacific
- 3.1. China
- 3.2. Japan
- 3.3. India
- 3.4. Australia
- 3.5. Rest of Asia Pacific
-
4. South America
- 4.1. Brazil
- 4.2. Argentina
- 4.3. Rest of South America
-
5. Middle East and Africa
- 5.1. South Africa
- 5.2. Saudi Arabia
- 5.3. Rest of Middle East and Africa
Clean Label Ingredients Industry REPORT HIGHLIGHTS
| Aspects | Details |
|---|---|
| Study Period | 2019-2033 |
| Base Year | 2024 |
| Estimated Year | 2025 |
| Forecast Period | 2025-2033 |
| Historical Period | 2019-2024 |
| Growth Rate | CAGR of 6.51% from 2019-2033 |
| Segmentation |
|
Table of Contents
- 1. Introduction
- 1.1. Research Scope
- 1.2. Market Segmentation
- 1.3. Research Methodology
- 1.4. Definitions and Assumptions
- 2. Executive Summary
- 2.1. Introduction
- 3. Market Dynamics
- 3.1. Introduction
- 3.2. Market Drivers
- 3.2.1. Increasing Health and Wellness Trends Fueling Market Growth; Rising Demand for Natural Ingredients
- 3.3. Market Restrains
- 3.3.1. High Cost Hampering Market Growth
- 3.4. Market Trends
- 3.4.1. Increasing Health and Wellness Trends Fueling Market Growth
- 4. Market Factor Analysis
- 4.1. Porters Five Forces
- 4.2. Supply/Value Chain
- 4.3. PESTEL analysis
- 4.4. Market Entropy
- 4.5. Patent/Trademark Analysis
- 5. Global Clean Label Ingredients Industry Analysis, Insights and Forecast, 2019-2031
- 5.1. Market Analysis, Insights and Forecast - by Product Type
- 5.1.1. Food Preservatives
- 5.1.2. Food Sweeteners
- 5.1.3. Food Colorants
- 5.1.4. Food Hydrocolloids
- 5.1.5. Food Flavors and Enhancers
- 5.1.6. Other Product Types
- 5.2. Market Analysis, Insights and Forecast - by Application
- 5.2.1. Bakery and Confectionery
- 5.2.2. Dairy and Frozen Desserts
- 5.2.3. Beverages
- 5.2.4. Meat and Meat Products
- 5.2.5. Sauces and Condiments
- 5.2.6. Other Applications
- 5.3. Market Analysis, Insights and Forecast - by Region
- 5.3.1. North America
- 5.3.2. Europe
- 5.3.3. Asia Pacific
- 5.3.4. South America
- 5.3.5. Middle East and Africa
- 5.1. Market Analysis, Insights and Forecast - by Product Type
- 6. North America Clean Label Ingredients Industry Analysis, Insights and Forecast, 2019-2031
- 6.1. Market Analysis, Insights and Forecast - by Product Type
- 6.1.1. Food Preservatives
- 6.1.2. Food Sweeteners
- 6.1.3. Food Colorants
- 6.1.4. Food Hydrocolloids
- 6.1.5. Food Flavors and Enhancers
- 6.1.6. Other Product Types
- 6.2. Market Analysis, Insights and Forecast - by Application
- 6.2.1. Bakery and Confectionery
- 6.2.2. Dairy and Frozen Desserts
- 6.2.3. Beverages
- 6.2.4. Meat and Meat Products
- 6.2.5. Sauces and Condiments
- 6.2.6. Other Applications
- 6.1. Market Analysis, Insights and Forecast - by Product Type
- 7. Europe Clean Label Ingredients Industry Analysis, Insights and Forecast, 2019-2031
- 7.1. Market Analysis, Insights and Forecast - by Product Type
- 7.1.1. Food Preservatives
- 7.1.2. Food Sweeteners
- 7.1.3. Food Colorants
- 7.1.4. Food Hydrocolloids
- 7.1.5. Food Flavors and Enhancers
- 7.1.6. Other Product Types
- 7.2. Market Analysis, Insights and Forecast - by Application
- 7.2.1. Bakery and Confectionery
- 7.2.2. Dairy and Frozen Desserts
- 7.2.3. Beverages
- 7.2.4. Meat and Meat Products
- 7.2.5. Sauces and Condiments
- 7.2.6. Other Applications
- 7.1. Market Analysis, Insights and Forecast - by Product Type
- 8. Asia Pacific Clean Label Ingredients Industry Analysis, Insights and Forecast, 2019-2031
- 8.1. Market Analysis, Insights and Forecast - by Product Type
- 8.1.1. Food Preservatives
- 8.1.2. Food Sweeteners
- 8.1.3. Food Colorants
- 8.1.4. Food Hydrocolloids
- 8.1.5. Food Flavors and Enhancers
- 8.1.6. Other Product Types
- 8.2. Market Analysis, Insights and Forecast - by Application
- 8.2.1. Bakery and Confectionery
- 8.2.2. Dairy and Frozen Desserts
- 8.2.3. Beverages
- 8.2.4. Meat and Meat Products
- 8.2.5. Sauces and Condiments
- 8.2.6. Other Applications
- 8.1. Market Analysis, Insights and Forecast - by Product Type
- 9. South America Clean Label Ingredients Industry Analysis, Insights and Forecast, 2019-2031
- 9.1. Market Analysis, Insights and Forecast - by Product Type
- 9.1.1. Food Preservatives
- 9.1.2. Food Sweeteners
- 9.1.3. Food Colorants
- 9.1.4. Food Hydrocolloids
- 9.1.5. Food Flavors and Enhancers
- 9.1.6. Other Product Types
- 9.2. Market Analysis, Insights and Forecast - by Application
- 9.2.1. Bakery and Confectionery
- 9.2.2. Dairy and Frozen Desserts
- 9.2.3. Beverages
- 9.2.4. Meat and Meat Products
- 9.2.5. Sauces and Condiments
- 9.2.6. Other Applications
- 9.1. Market Analysis, Insights and Forecast - by Product Type
- 10. Middle East and Africa Clean Label Ingredients Industry Analysis, Insights and Forecast, 2019-2031
- 10.1. Market Analysis, Insights and Forecast - by Product Type
- 10.1.1. Food Preservatives
- 10.1.2. Food Sweeteners
- 10.1.3. Food Colorants
- 10.1.4. Food Hydrocolloids
- 10.1.5. Food Flavors and Enhancers
- 10.1.6. Other Product Types
- 10.2. Market Analysis, Insights and Forecast - by Application
- 10.2.1. Bakery and Confectionery
- 10.2.2. Dairy and Frozen Desserts
- 10.2.3. Beverages
- 10.2.4. Meat and Meat Products
- 10.2.5. Sauces and Condiments
- 10.2.6. Other Applications
- 10.1. Market Analysis, Insights and Forecast - by Product Type
- 11. North America Clean Label Ingredients Industry Analysis, Insights and Forecast, 2019-2031
- 11.1. Market Analysis, Insights and Forecast - By Country/Sub-region
- 11.1.1 United States
- 11.1.2 Canada
- 11.1.3 Mexico
- 11.1.4 Rest of North America
- 12. Europe Clean Label Ingredients Industry Analysis, Insights and Forecast, 2019-2031
- 12.1. Market Analysis, Insights and Forecast - By Country/Sub-region
- 12.1.1 United Kingdom
- 12.1.2 Germany
- 12.1.3 Spain
- 12.1.4 France
- 12.1.5 Italy
- 12.1.6 Russia
- 12.1.7 Rest of Europe
- 13. Asia Pacific Clean Label Ingredients Industry Analysis, Insights and Forecast, 2019-2031
- 13.1. Market Analysis, Insights and Forecast - By Country/Sub-region
- 13.1.1 China
- 13.1.2 Japan
- 13.1.3 India
- 13.1.4 Australia
- 13.1.5 Rest of Asia Pacific
- 14. South America Clean Label Ingredients Industry Analysis, Insights and Forecast, 2019-2031
- 14.1. Market Analysis, Insights and Forecast - By Country/Sub-region
- 14.1.1 Brazil
- 14.1.2 Argentina
- 14.1.3 Rest of South America
- 15. Middle East and Africa Clean Label Ingredients Industry Analysis, Insights and Forecast, 2019-2031
- 15.1. Market Analysis, Insights and Forecast - By Country/Sub-region
- 15.1.1 South Africa
- 15.1.2 Saudi Arabia
- 15.1.3 Rest of Middle East and Africa
- 16. Competitive Analysis
- 16.1. Global Market Share Analysis 2024
- 16.2. Company Profiles
- 16.2.1 Sensient Technologies Corporation*List Not Exhaustive
- 16.2.1.1. Overview
- 16.2.1.2. Products
- 16.2.1.3. SWOT Analysis
- 16.2.1.4. Recent Developments
- 16.2.1.5. Financials (Based on Availability)
- 16.2.2 Cargill Incorporated
- 16.2.2.1. Overview
- 16.2.2.2. Products
- 16.2.2.3. SWOT Analysis
- 16.2.2.4. Recent Developments
- 16.2.2.5. Financials (Based on Availability)
- 16.2.3 International Flavors & Fragrances Inc
- 16.2.3.1. Overview
- 16.2.3.2. Products
- 16.2.3.3. SWOT Analysis
- 16.2.3.4. Recent Developments
- 16.2.3.5. Financials (Based on Availability)
- 16.2.4 DSM-Firmenich
- 16.2.4.1. Overview
- 16.2.4.2. Products
- 16.2.4.3. SWOT Analysis
- 16.2.4.4. Recent Developments
- 16.2.4.5. Financials (Based on Availability)
- 16.2.5 Archer Daniels Midland Company
- 16.2.5.1. Overview
- 16.2.5.2. Products
- 16.2.5.3. SWOT Analysis
- 16.2.5.4. Recent Developments
- 16.2.5.5. Financials (Based on Availability)
- 16.2.6 Ajinomoto Co Inc
- 16.2.6.1. Overview
- 16.2.6.2. Products
- 16.2.6.3. SWOT Analysis
- 16.2.6.4. Recent Developments
- 16.2.6.5. Financials (Based on Availability)
- 16.2.7 Tate & Lyle PLC
- 16.2.7.1. Overview
- 16.2.7.2. Products
- 16.2.7.3. SWOT Analysis
- 16.2.7.4. Recent Developments
- 16.2.7.5. Financials (Based on Availability)
- 16.2.8 Kerry Group PLC
- 16.2.8.1. Overview
- 16.2.8.2. Products
- 16.2.8.3. SWOT Analysis
- 16.2.8.4. Recent Developments
- 16.2.8.5. Financials (Based on Availability)
- 16.2.9 Ingredion Incorporated
- 16.2.9.1. Overview
- 16.2.9.2. Products
- 16.2.9.3. SWOT Analysis
- 16.2.9.4. Recent Developments
- 16.2.9.5. Financials (Based on Availability)
- 16.2.10 Corbion NV
- 16.2.10.1. Overview
- 16.2.10.2. Products
- 16.2.10.3. SWOT Analysis
- 16.2.10.4. Recent Developments
- 16.2.10.5. Financials (Based on Availability)
- 16.2.1 Sensient Technologies Corporation*List Not Exhaustive
List of Figures
- Figure 1: Global Clean Label Ingredients Industry Revenue Breakdown (Million, %) by Region 2024 & 2032
- Figure 2: North America Clean Label Ingredients Industry Revenue (Million), by Country 2024 & 2032
- Figure 3: North America Clean Label Ingredients Industry Revenue Share (%), by Country 2024 & 2032
- Figure 4: Europe Clean Label Ingredients Industry Revenue (Million), by Country 2024 & 2032
- Figure 5: Europe Clean Label Ingredients Industry Revenue Share (%), by Country 2024 & 2032
- Figure 6: Asia Pacific Clean Label Ingredients Industry Revenue (Million), by Country 2024 & 2032
- Figure 7: Asia Pacific Clean Label Ingredients Industry Revenue Share (%), by Country 2024 & 2032
- Figure 8: South America Clean Label Ingredients Industry Revenue (Million), by Country 2024 & 2032
- Figure 9: South America Clean Label Ingredients Industry Revenue Share (%), by Country 2024 & 2032
- Figure 10: Middle East and Africa Clean Label Ingredients Industry Revenue (Million), by Country 2024 & 2032
- Figure 11: Middle East and Africa Clean Label Ingredients Industry Revenue Share (%), by Country 2024 & 2032
- Figure 12: North America Clean Label Ingredients Industry Revenue (Million), by Product Type 2024 & 2032
- Figure 13: North America Clean Label Ingredients Industry Revenue Share (%), by Product Type 2024 & 2032
- Figure 14: North America Clean Label Ingredients Industry Revenue (Million), by Application 2024 & 2032
- Figure 15: North America Clean Label Ingredients Industry Revenue Share (%), by Application 2024 & 2032
- Figure 16: North America Clean Label Ingredients Industry Revenue (Million), by Country 2024 & 2032
- Figure 17: North America Clean Label Ingredients Industry Revenue Share (%), by Country 2024 & 2032
- Figure 18: Europe Clean Label Ingredients Industry Revenue (Million), by Product Type 2024 & 2032
- Figure 19: Europe Clean Label Ingredients Industry Revenue Share (%), by Product Type 2024 & 2032
- Figure 20: Europe Clean Label Ingredients Industry Revenue (Million), by Application 2024 & 2032
- Figure 21: Europe Clean Label Ingredients Industry Revenue Share (%), by Application 2024 & 2032
- Figure 22: Europe Clean Label Ingredients Industry Revenue (Million), by Country 2024 & 2032
- Figure 23: Europe Clean Label Ingredients Industry Revenue Share (%), by Country 2024 & 2032
- Figure 24: Asia Pacific Clean Label Ingredients Industry Revenue (Million), by Product Type 2024 & 2032
- Figure 25: Asia Pacific Clean Label Ingredients Industry Revenue Share (%), by Product Type 2024 & 2032
- Figure 26: Asia Pacific Clean Label Ingredients Industry Revenue (Million), by Application 2024 & 2032
- Figure 27: Asia Pacific Clean Label Ingredients Industry Revenue Share (%), by Application 2024 & 2032
- Figure 28: Asia Pacific Clean Label Ingredients Industry Revenue (Million), by Country 2024 & 2032
- Figure 29: Asia Pacific Clean Label Ingredients Industry Revenue Share (%), by Country 2024 & 2032
- Figure 30: South America Clean Label Ingredients Industry Revenue (Million), by Product Type 2024 & 2032
- Figure 31: South America Clean Label Ingredients Industry Revenue Share (%), by Product Type 2024 & 2032
- Figure 32: South America Clean Label Ingredients Industry Revenue (Million), by Application 2024 & 2032
- Figure 33: South America Clean Label Ingredients Industry Revenue Share (%), by Application 2024 & 2032
- Figure 34: South America Clean Label Ingredients Industry Revenue (Million), by Country 2024 & 2032
- Figure 35: South America Clean Label Ingredients Industry Revenue Share (%), by Country 2024 & 2032
- Figure 36: Middle East and Africa Clean Label Ingredients Industry Revenue (Million), by Product Type 2024 & 2032
- Figure 37: Middle East and Africa Clean Label Ingredients Industry Revenue Share (%), by Product Type 2024 & 2032
- Figure 38: Middle East and Africa Clean Label Ingredients Industry Revenue (Million), by Application 2024 & 2032
- Figure 39: Middle East and Africa Clean Label Ingredients Industry Revenue Share (%), by Application 2024 & 2032
- Figure 40: Middle East and Africa Clean Label Ingredients Industry Revenue (Million), by Country 2024 & 2032
- Figure 41: Middle East and Africa Clean Label Ingredients Industry Revenue Share (%), by Country 2024 & 2032
List of Tables
- Table 1: Global Clean Label Ingredients Industry Revenue Million Forecast, by Region 2019 & 2032
- Table 2: Global Clean Label Ingredients Industry Revenue Million Forecast, by Product Type 2019 & 2032
- Table 3: Global Clean Label Ingredients Industry Revenue Million Forecast, by Application 2019 & 2032
- Table 4: Global Clean Label Ingredients Industry Revenue Million Forecast, by Region 2019 & 2032
- Table 5: Global Clean Label Ingredients Industry Revenue Million Forecast, by Country 2019 & 2032
- Table 6: United States Clean Label Ingredients Industry Revenue (Million) Forecast, by Application 2019 & 2032
- Table 7: Canada Clean Label Ingredients Industry Revenue (Million) Forecast, by Application 2019 & 2032
- Table 8: Mexico Clean Label Ingredients Industry Revenue (Million) Forecast, by Application 2019 & 2032
- Table 9: Rest of North America Clean Label Ingredients Industry Revenue (Million) Forecast, by Application 2019 & 2032
- Table 10: Global Clean Label Ingredients Industry Revenue Million Forecast, by Country 2019 & 2032
- Table 11: United Kingdom Clean Label Ingredients Industry Revenue (Million) Forecast, by Application 2019 & 2032
- Table 12: Germany Clean Label Ingredients Industry Revenue (Million) Forecast, by Application 2019 & 2032
- Table 13: Spain Clean Label Ingredients Industry Revenue (Million) Forecast, by Application 2019 & 2032
- Table 14: France Clean Label Ingredients Industry Revenue (Million) Forecast, by Application 2019 & 2032
- Table 15: Italy Clean Label Ingredients Industry Revenue (Million) Forecast, by Application 2019 & 2032
- Table 16: Russia Clean Label Ingredients Industry Revenue (Million) Forecast, by Application 2019 & 2032
- Table 17: Rest of Europe Clean Label Ingredients Industry Revenue (Million) Forecast, by Application 2019 & 2032
- Table 18: Global Clean Label Ingredients Industry Revenue Million Forecast, by Country 2019 & 2032
- Table 19: China Clean Label Ingredients Industry Revenue (Million) Forecast, by Application 2019 & 2032
- Table 20: Japan Clean Label Ingredients Industry Revenue (Million) Forecast, by Application 2019 & 2032
- Table 21: India Clean Label Ingredients Industry Revenue (Million) Forecast, by Application 2019 & 2032
- Table 22: Australia Clean Label Ingredients Industry Revenue (Million) Forecast, by Application 2019 & 2032
- Table 23: Rest of Asia Pacific Clean Label Ingredients Industry Revenue (Million) Forecast, by Application 2019 & 2032
- Table 24: Global Clean Label Ingredients Industry Revenue Million Forecast, by Country 2019 & 2032
- Table 25: Brazil Clean Label Ingredients Industry Revenue (Million) Forecast, by Application 2019 & 2032
- Table 26: Argentina Clean Label Ingredients Industry Revenue (Million) Forecast, by Application 2019 & 2032
- Table 27: Rest of South America Clean Label Ingredients Industry Revenue (Million) Forecast, by Application 2019 & 2032
- Table 28: Global Clean Label Ingredients Industry Revenue Million Forecast, by Country 2019 & 2032
- Table 29: South Africa Clean Label Ingredients Industry Revenue (Million) Forecast, by Application 2019 & 2032
- Table 30: Saudi Arabia Clean Label Ingredients Industry Revenue (Million) Forecast, by Application 2019 & 2032
- Table 31: Rest of Middle East and Africa Clean Label Ingredients Industry Revenue (Million) Forecast, by Application 2019 & 2032
- Table 32: Global Clean Label Ingredients Industry Revenue Million Forecast, by Product Type 2019 & 2032
- Table 33: Global Clean Label Ingredients Industry Revenue Million Forecast, by Application 2019 & 2032
- Table 34: Global Clean Label Ingredients Industry Revenue Million Forecast, by Country 2019 & 2032
- Table 35: United States Clean Label Ingredients Industry Revenue (Million) Forecast, by Application 2019 & 2032
- Table 36: Canada Clean Label Ingredients Industry Revenue (Million) Forecast, by Application 2019 & 2032
- Table 37: Mexico Clean Label Ingredients Industry Revenue (Million) Forecast, by Application 2019 & 2032
- Table 38: Rest of North America Clean Label Ingredients Industry Revenue (Million) Forecast, by Application 2019 & 2032
- Table 39: Global Clean Label Ingredients Industry Revenue Million Forecast, by Product Type 2019 & 2032
- Table 40: Global Clean Label Ingredients Industry Revenue Million Forecast, by Application 2019 & 2032
- Table 41: Global Clean Label Ingredients Industry Revenue Million Forecast, by Country 2019 & 2032
- Table 42: United Kingdom Clean Label Ingredients Industry Revenue (Million) Forecast, by Application 2019 & 2032
- Table 43: Germany Clean Label Ingredients Industry Revenue (Million) Forecast, by Application 2019 & 2032
- Table 44: Spain Clean Label Ingredients Industry Revenue (Million) Forecast, by Application 2019 & 2032
- Table 45: France Clean Label Ingredients Industry Revenue (Million) Forecast, by Application 2019 & 2032
- Table 46: Italy Clean Label Ingredients Industry Revenue (Million) Forecast, by Application 2019 & 2032
- Table 47: Russia Clean Label Ingredients Industry Revenue (Million) Forecast, by Application 2019 & 2032
- Table 48: Rest of Europe Clean Label Ingredients Industry Revenue (Million) Forecast, by Application 2019 & 2032
- Table 49: Global Clean Label Ingredients Industry Revenue Million Forecast, by Product Type 2019 & 2032
- Table 50: Global Clean Label Ingredients Industry Revenue Million Forecast, by Application 2019 & 2032
- Table 51: Global Clean Label Ingredients Industry Revenue Million Forecast, by Country 2019 & 2032
- Table 52: China Clean Label Ingredients Industry Revenue (Million) Forecast, by Application 2019 & 2032
- Table 53: Japan Clean Label Ingredients Industry Revenue (Million) Forecast, by Application 2019 & 2032
- Table 54: India Clean Label Ingredients Industry Revenue (Million) Forecast, by Application 2019 & 2032
- Table 55: Australia Clean Label Ingredients Industry Revenue (Million) Forecast, by Application 2019 & 2032
- Table 56: Rest of Asia Pacific Clean Label Ingredients Industry Revenue (Million) Forecast, by Application 2019 & 2032
- Table 57: Global Clean Label Ingredients Industry Revenue Million Forecast, by Product Type 2019 & 2032
- Table 58: Global Clean Label Ingredients Industry Revenue Million Forecast, by Application 2019 & 2032
- Table 59: Global Clean Label Ingredients Industry Revenue Million Forecast, by Country 2019 & 2032
- Table 60: Brazil Clean Label Ingredients Industry Revenue (Million) Forecast, by Application 2019 & 2032
- Table 61: Argentina Clean Label Ingredients Industry Revenue (Million) Forecast, by Application 2019 & 2032
- Table 62: Rest of South America Clean Label Ingredients Industry Revenue (Million) Forecast, by Application 2019 & 2032
- Table 63: Global Clean Label Ingredients Industry Revenue Million Forecast, by Product Type 2019 & 2032
- Table 64: Global Clean Label Ingredients Industry Revenue Million Forecast, by Application 2019 & 2032
- Table 65: Global Clean Label Ingredients Industry Revenue Million Forecast, by Country 2019 & 2032
- Table 66: South Africa Clean Label Ingredients Industry Revenue (Million) Forecast, by Application 2019 & 2032
- Table 67: Saudi Arabia Clean Label Ingredients Industry Revenue (Million) Forecast, by Application 2019 & 2032
- Table 68: Rest of Middle East and Africa Clean Label Ingredients Industry Revenue (Million) Forecast, by Application 2019 & 2032
Frequently Asked Questions
1. What is the projected Compound Annual Growth Rate (CAGR) of the Clean Label Ingredients Industry?
The projected CAGR is approximately 6.51%.
2. Which companies are prominent players in the Clean Label Ingredients Industry?
Key companies in the market include Sensient Technologies Corporation*List Not Exhaustive, Cargill Incorporated, International Flavors & Fragrances Inc, DSM-Firmenich, Archer Daniels Midland Company, Ajinomoto Co Inc, Tate & Lyle PLC, Kerry Group PLC, Ingredion Incorporated, Corbion NV.
3. What are the main segments of the Clean Label Ingredients Industry?
The market segments include Product Type, Application.
4. Can you provide details about the market size?
The market size is estimated to be USD 42.76 Million as of 2022.
5. What are some drivers contributing to market growth?
Increasing Health and Wellness Trends Fueling Market Growth; Rising Demand for Natural Ingredients.
6. What are the notable trends driving market growth?
Increasing Health and Wellness Trends Fueling Market Growth.
7. Are there any restraints impacting market growth?
High Cost Hampering Market Growth.
8. Can you provide examples of recent developments in the market?
February 2024: Ajinomoto Co. opened a new office in Silicon Valley, United States. The office provides different types of food solutions, including clean label ingredients in the US market. The purpose of this expansion was to expand the company’s business.
9. What pricing options are available for accessing the report?
Pricing options include single-user, multi-user, and enterprise licenses priced at USD 4750, USD 5250, and USD 8750 respectively.
10. Is the market size provided in terms of value or volume?
The market size is provided in terms of value, measured in Million.
11. Are there any specific market keywords associated with the report?
Yes, the market keyword associated with the report is "Clean Label Ingredients Industry," which aids in identifying and referencing the specific market segment covered.
12. How do I determine which pricing option suits my needs best?
The pricing options vary based on user requirements and access needs. Individual users may opt for single-user licenses, while businesses requiring broader access may choose multi-user or enterprise licenses for cost-effective access to the report.
13. Are there any additional resources or data provided in the Clean Label Ingredients Industry report?
While the report offers comprehensive insights, it's advisable to review the specific contents or supplementary materials provided to ascertain if additional resources or data are available.
14. How can I stay updated on further developments or reports in the Clean Label Ingredients Industry?
To stay informed about further developments, trends, and reports in the Clean Label Ingredients Industry, consider subscribing to industry newsletters, following relevant companies and organizations, or regularly checking reputable industry news sources and publications.
Methodology
Step 1 - Identification of Relevant Samples Size from Population Database


Step 2 - Approaches for Defining Global Market Size (Value, Volume* & Price*)

Note*: In applicable scenarios
Step 3 - Data Sources
Primary Research
- Web Analytics
- Survey Reports
- Research Institute
- Latest Research Reports
- Opinion Leaders
Secondary Research
- Annual Reports
- White Paper
- Latest Press Release
- Industry Association
- Paid Database
- Investor Presentations

Step 4 - Data Triangulation
Involves using different sources of information in order to increase the validity of a study
These sources are likely to be stakeholders in a program - participants, other researchers, program staff, other community members, and so on.
Then we put all data in single framework & apply various statistical tools to find out the dynamic on the market.
During the analysis stage, feedback from the stakeholder groups would be compared to determine areas of agreement as well as areas of divergence


