
Key Insights
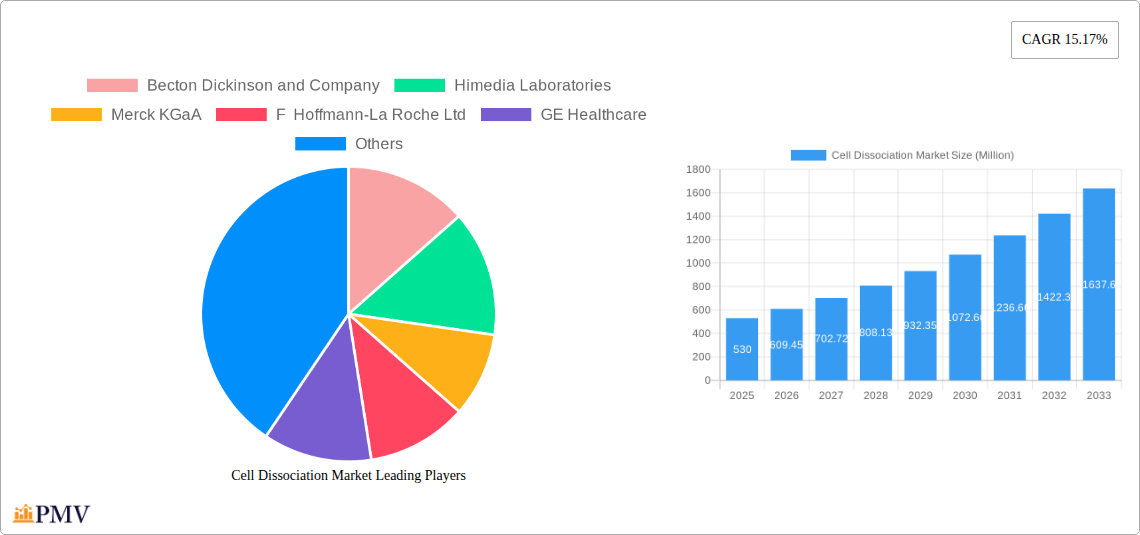
The global cell dissociation market, valued at $0.53 billion in 2025, is projected to experience robust growth, driven by the increasing demand for cell-based therapies and research in the pharmaceutical and biotechnology sectors. A Compound Annual Growth Rate (CAGR) of 15.17% from 2025 to 2033 indicates a significant expansion, primarily fueled by advancements in cell culture techniques, personalized medicine initiatives, and the rising prevalence of chronic diseases requiring advanced therapeutic interventions. The market is segmented by product type (enzymatic and non-enzymatic dissociation products, instruments and accessories), tissue type (connective, epithelial, and others), and end-user (pharmaceutical and biotechnology companies, research and academic institutes). The high demand for accurate and efficient cell isolation methods for regenerative medicine, drug discovery, and disease modeling is expected to propel growth across all segments. North America and Europe currently dominate the market, but the Asia-Pacific region is poised for significant growth due to increasing investments in life sciences research and a burgeoning pharmaceutical industry. Competitive pressures are high, with major players like Becton Dickinson, Merck KGaA, and Thermo Fisher Scientific vying for market share through product innovation and strategic partnerships. The continued development of novel dissociation techniques, coupled with technological advancements in automation and high-throughput screening, will further stimulate market expansion.
The market's growth trajectory is further influenced by several factors. Stringent regulatory approvals for cell-based therapies represent a constraint, potentially slowing down market penetration. However, the rising prevalence of diseases like cancer and autoimmune disorders continues to drive the need for effective cell-based treatments and research, offsetting these regulatory hurdles. The increasing adoption of automation and improved instrument design will contribute to enhanced efficiency and reduced processing times, thereby boosting the adoption of cell dissociation products and instruments. Furthermore, the growing focus on personalized medicine and the development of advanced cell therapies are key drivers pushing the market towards substantial growth in the coming years. The competitive landscape is characterized by both established players and emerging companies, leading to increased innovation and market diversification.
Cell Dissociation Market: A Comprehensive Report (2019-2033)
This in-depth report provides a comprehensive analysis of the Cell Dissociation Market, offering invaluable insights for stakeholders across the pharmaceutical, biotechnology, and research sectors. The study period spans from 2019 to 2033, with 2025 serving as both the base and estimated year. The report meticulously examines market segmentation, competitive dynamics, and future growth prospects, leveraging robust data and expert analysis.
Cell Dissociation Market Market Structure & Competitive Dynamics
The Cell Dissociation Market exhibits a moderately consolidated structure, with key players such as Becton Dickinson and Company, Thermo Fisher Scientific, Merck KGaA, and Miltenyi Biotec holding significant market share. Innovation within the market is driven by continuous advancements in enzymatic and non-enzymatic dissociation technologies, alongside the development of sophisticated instruments and accessories. Regulatory frameworks, particularly those governing the use of cell-based therapies and research, significantly influence market growth. The market witnesses considerable M&A activity, reflecting the strategic importance of cell dissociation technologies in various life science applications. For example, the acquisition of Company X by Company Y in 2023, valued at approximately USD xx Million, illustrates the consolidation trends. The market also experiences competitive pressure from substitute technologies; however, the advantages of cell dissociation methods in terms of efficiency and precision continue to maintain its strong position. End-user trends indicate a growing preference for automated and high-throughput solutions, further driving innovation.
- Market Concentration: Moderately Consolidated
- M&A Activity: Significant, with deals valued at USD xx Million annually (average).
- Key Players' Market Share: Becton Dickinson and Company (xx%), Thermo Fisher Scientific (xx%), Merck KGaA (xx%), Miltenyi Biotec (xx%), Others (xx%).
Cell Dissociation Market Industry Trends & Insights
The Cell Dissociation Market is experiencing robust growth, driven primarily by the burgeoning demand for cell-based therapies, increasing research activities in regenerative medicine, and the expanding adoption of personalized medicine approaches. Technological advancements, such as the development of more efficient and gentler dissociation methods, are also contributing to market expansion. The market is characterized by a steady increase in the adoption of automated systems, reducing manual labor and increasing throughput. Consumer preferences are shifting toward high-quality, reliable, and cost-effective dissociation solutions tailored to specific cell types and applications. The compound annual growth rate (CAGR) for the market is projected to be xx% during the forecast period (2025-2033), with market penetration expected to reach xx% by 2033. Competitive dynamics are characterized by both intense rivalry and strategic collaborations, with key players focusing on product innovation, geographic expansion, and strategic partnerships to gain a competitive edge.

Dominant Markets & Segments in Cell Dissociation Market
The North American region currently dominates the Cell Dissociation Market, driven by strong research funding, a robust biotechnology sector, and a high concentration of pharmaceutical companies. Within the product segment, Enzymatic Dissociation Products hold the largest market share due to their efficacy and wide applicability. The Epithelial Tissue segment demonstrates significant growth within the tissue category due to the increasing demand for cell-based assays and therapies related to skin and organ regeneration. Pharmaceutical and Biotechnology Companies represent the largest end-user segment, owing to the extensive use of cell dissociation technologies in drug discovery and development.
- Leading Region: North America
- Dominant Product Segment: Enzymatic Dissociation Products
- Fastest-Growing Tissue Segment: Epithelial Tissue
- Largest End-User Segment: Pharmaceutical and Biotechnology Companies
Key Drivers:
- North America: Strong R&D funding, well-established pharmaceutical and biotech industry.
- Enzymatic Dissociation Products: Wide applicability, high efficacy.
- Epithelial Tissue: Growing demand in skin regeneration and organoid research.
- Pharmaceutical & Biotech Companies: High usage in drug discovery and development.
Cell Dissociation Market Product Innovations
Recent innovations in the Cell Dissociation Market focus on developing gentler and more efficient dissociation methods that minimize cell damage. This includes advancements in enzymatic formulations, the introduction of novel non-enzymatic techniques, and the development of automated systems designed to improve throughput and reproducibility. These innovations are tailored to meet the specific needs of various cell types and applications, addressing challenges related to cell viability and function preservation. The market is witnessing a surge in the development of microfluidic-based devices and systems for high-throughput and single-cell dissociation.
Report Segmentation & Scope
The report segments the Cell Dissociation Market based on Product (Enzymatic Dissociation Products, Non-enzymatic Dissociation Products, Instruments and Accessories), Tissue (Connective Tissue, Epithelial Tissue, Other Tissues), and End-User (Pharmaceutical and Biotechnology Companies, Research and Academic Institutes, Other End-Users). Each segment is analyzed in detail, providing market size, growth projections, and competitive dynamics. The market for Enzymatic Dissociation Products is expected to experience significant growth due to its wide applicability. The Non-enzymatic segment is expected to witness substantial growth owing to the rising need for gentler dissociation techniques. The Instruments and Accessories segment is experiencing steady growth, driven by the adoption of automated solutions. The Epithelial Tissue segment demonstrates the highest growth rate, fuelled by advances in organoid and tissue engineering. Pharmaceutical and Biotechnology Companies comprise the dominant end-user segment. Growth projections for each segment are presented, reflecting the dynamic nature of the market.
Key Drivers of Cell Dissociation Market Growth
The Cell Dissociation Market's growth is fueled by several factors. The increasing prevalence of chronic diseases and the consequent demand for cell-based therapies are major drivers. Advancements in biotechnology and the development of innovative cell dissociation techniques are accelerating market growth. Furthermore, rising research and development investments in regenerative medicine and personalized medicine are creating substantial opportunities. Favorable regulatory environments in several key markets are also contributing positively. Government funding for research and development in life sciences is a further significant factor.
Challenges in the Cell Dissociation Market Sector
Despite its growth potential, the Cell Dissociation Market faces several challenges. Stringent regulatory requirements for cell-based therapies and products can slow down market entry and increase costs. The high cost of advanced instruments and technologies can limit accessibility for smaller research institutions. The variability in cell types and tissues can make standardization challenging and affect product efficacy. The supply chain disruptions caused by global events could also hinder the availability of raw materials. Competition among established players is intense and further complicates the sector.
Leading Players in the Cell Dissociation Market Market
- Becton Dickinson and Company
- Himedia Laboratories
- Merck KGaA
- F Hoffmann-La Roche Ltd
- GE Healthcare
- American Type Culture Collection
- Miltenyi Biotec
- Pan-Biotech
- Thermo Fisher Scientific
- Stemcell Technologies
Key Developments in Cell Dissociation Market Sector
- September 2022: Marinus Pharmaceuticals secured a USD 12.3 Million contract from BARDA to support US-based manufacturing of ganaxolone, boosting domestic production capabilities.
- March 2022: ThermoFisher Scientific invested USD 97 Million to expand its clinical research facilities in Richmond, Virginia, enhancing its capacity for cell-based research.
Strategic Cell Dissociation Market Market Outlook
The Cell Dissociation Market is poised for substantial growth over the forecast period, driven by the convergence of technological advancements, increasing demand for cell-based therapies, and ongoing research in regenerative medicine. Strategic opportunities exist for companies focusing on innovation, particularly in developing gentler, more efficient, and cost-effective dissociation methods. Expanding into emerging markets and forging strategic partnerships will be crucial for success. Focus on automation and high-throughput solutions will further enhance market competitiveness. The continuous evolution of cell-based therapies and increasing research funding will support sustained market growth in the coming years.
Cell Dissociation Market Segmentation
-
1. Product
- 1.1. Enzymatic Dissociation Products
- 1.2. Non-enzymatic Dissociation Products
- 1.3. Instruments and Accessories
-
2. Tissue
- 2.1. Connective Tissue
- 2.2. Epithelial Tissue
- 2.3. Other Tissues
-
3. End-User
- 3.1. Pharmaceutical and Biotechnology Companies
- 3.2. Research and Academic Institutes
- 3.3. Other End-Users
Cell Dissociation Market Segmentation By Geography
-
1. North America
- 1.1. United States
- 1.2. Canada
- 1.3. Mexico
-
2. Europe
- 2.1. Germany
- 2.2. United Kingdom
- 2.3. France
- 2.4. Italy
- 2.5. Spain
- 2.6. Rest of Europe
-
3. Asia Pacific
- 3.1. China
- 3.2. Japan
- 3.3. India
- 3.4. Australia
- 3.5. South Korea
- 3.6. Rest of Asia Pacific
-
4. Middle East and Africa
- 4.1. GCC
- 4.2. South Africa
- 4.3. Rest of Middle East and Africa
-
5. South America
- 5.1. Brazil
- 5.2. Argentina
- 5.3. Rest of South America

Cell Dissociation Market REPORT HIGHLIGHTS
| Aspects | Details |
|---|---|
| Study Period | 2019-2033 |
| Base Year | 2024 |
| Estimated Year | 2025 |
| Forecast Period | 2025-2033 |
| Historical Period | 2019-2024 |
| Growth Rate | CAGR of 15.17% from 2019-2033 |
| Segmentation |
|
Table of Contents
- 1. Introduction
- 1.1. Research Scope
- 1.2. Market Segmentation
- 1.3. Research Methodology
- 1.4. Definitions and Assumptions
- 2. Executive Summary
- 2.1. Introduction
- 3. Market Dynamics
- 3.1. Introduction
- 3.2. Market Drivers
- 3.2.1. Increasing R&D Activities in Biopharmaceutical Companies; Favourable Funding Scenario for Cancer Research
- 3.3. Market Restrains
- 3.3.1. High cost of Tissue- and Cell-based Procedures
- 3.4. Market Trends
- 3.4.1. Pharmaceutical and Biotechnology Companies Segment is Expected to Witness a Healthy Growth Over the Forecast Period
- 4. Market Factor Analysis
- 4.1. Porters Five Forces
- 4.2. Supply/Value Chain
- 4.3. PESTEL analysis
- 4.4. Market Entropy
- 4.5. Patent/Trademark Analysis
- 5. Global Cell Dissociation Market Analysis, Insights and Forecast, 2019-2031
- 5.1. Market Analysis, Insights and Forecast - by Product
- 5.1.1. Enzymatic Dissociation Products
- 5.1.2. Non-enzymatic Dissociation Products
- 5.1.3. Instruments and Accessories
- 5.2. Market Analysis, Insights and Forecast - by Tissue
- 5.2.1. Connective Tissue
- 5.2.2. Epithelial Tissue
- 5.2.3. Other Tissues
- 5.3. Market Analysis, Insights and Forecast - by End-User
- 5.3.1. Pharmaceutical and Biotechnology Companies
- 5.3.2. Research and Academic Institutes
- 5.3.3. Other End-Users
- 5.4. Market Analysis, Insights and Forecast - by Region
- 5.4.1. North America
- 5.4.2. Europe
- 5.4.3. Asia Pacific
- 5.4.4. Middle East and Africa
- 5.4.5. South America
- 5.1. Market Analysis, Insights and Forecast - by Product
- 6. North America Cell Dissociation Market Analysis, Insights and Forecast, 2019-2031
- 6.1. Market Analysis, Insights and Forecast - by Product
- 6.1.1. Enzymatic Dissociation Products
- 6.1.2. Non-enzymatic Dissociation Products
- 6.1.3. Instruments and Accessories
- 6.2. Market Analysis, Insights and Forecast - by Tissue
- 6.2.1. Connective Tissue
- 6.2.2. Epithelial Tissue
- 6.2.3. Other Tissues
- 6.3. Market Analysis, Insights and Forecast - by End-User
- 6.3.1. Pharmaceutical and Biotechnology Companies
- 6.3.2. Research and Academic Institutes
- 6.3.3. Other End-Users
- 6.1. Market Analysis, Insights and Forecast - by Product
- 7. Europe Cell Dissociation Market Analysis, Insights and Forecast, 2019-2031
- 7.1. Market Analysis, Insights and Forecast - by Product
- 7.1.1. Enzymatic Dissociation Products
- 7.1.2. Non-enzymatic Dissociation Products
- 7.1.3. Instruments and Accessories
- 7.2. Market Analysis, Insights and Forecast - by Tissue
- 7.2.1. Connective Tissue
- 7.2.2. Epithelial Tissue
- 7.2.3. Other Tissues
- 7.3. Market Analysis, Insights and Forecast - by End-User
- 7.3.1. Pharmaceutical and Biotechnology Companies
- 7.3.2. Research and Academic Institutes
- 7.3.3. Other End-Users
- 7.1. Market Analysis, Insights and Forecast - by Product
- 8. Asia Pacific Cell Dissociation Market Analysis, Insights and Forecast, 2019-2031
- 8.1. Market Analysis, Insights and Forecast - by Product
- 8.1.1. Enzymatic Dissociation Products
- 8.1.2. Non-enzymatic Dissociation Products
- 8.1.3. Instruments and Accessories
- 8.2. Market Analysis, Insights and Forecast - by Tissue
- 8.2.1. Connective Tissue
- 8.2.2. Epithelial Tissue
- 8.2.3. Other Tissues
- 8.3. Market Analysis, Insights and Forecast - by End-User
- 8.3.1. Pharmaceutical and Biotechnology Companies
- 8.3.2. Research and Academic Institutes
- 8.3.3. Other End-Users
- 8.1. Market Analysis, Insights and Forecast - by Product
- 9. Middle East and Africa Cell Dissociation Market Analysis, Insights and Forecast, 2019-2031
- 9.1. Market Analysis, Insights and Forecast - by Product
- 9.1.1. Enzymatic Dissociation Products
- 9.1.2. Non-enzymatic Dissociation Products
- 9.1.3. Instruments and Accessories
- 9.2. Market Analysis, Insights and Forecast - by Tissue
- 9.2.1. Connective Tissue
- 9.2.2. Epithelial Tissue
- 9.2.3. Other Tissues
- 9.3. Market Analysis, Insights and Forecast - by End-User
- 9.3.1. Pharmaceutical and Biotechnology Companies
- 9.3.2. Research and Academic Institutes
- 9.3.3. Other End-Users
- 9.1. Market Analysis, Insights and Forecast - by Product
- 10. South America Cell Dissociation Market Analysis, Insights and Forecast, 2019-2031
- 10.1. Market Analysis, Insights and Forecast - by Product
- 10.1.1. Enzymatic Dissociation Products
- 10.1.2. Non-enzymatic Dissociation Products
- 10.1.3. Instruments and Accessories
- 10.2. Market Analysis, Insights and Forecast - by Tissue
- 10.2.1. Connective Tissue
- 10.2.2. Epithelial Tissue
- 10.2.3. Other Tissues
- 10.3. Market Analysis, Insights and Forecast - by End-User
- 10.3.1. Pharmaceutical and Biotechnology Companies
- 10.3.2. Research and Academic Institutes
- 10.3.3. Other End-Users
- 10.1. Market Analysis, Insights and Forecast - by Product
- 11. North America Cell Dissociation Market Analysis, Insights and Forecast, 2019-2031
- 11.1. Market Analysis, Insights and Forecast - By Country/Sub-region
- 11.1.1 United States
- 11.1.2 Canada
- 11.1.3 Mexico
- 12. Europe Cell Dissociation Market Analysis, Insights and Forecast, 2019-2031
- 12.1. Market Analysis, Insights and Forecast - By Country/Sub-region
- 12.1.1 Germany
- 12.1.2 United Kingdom
- 12.1.3 France
- 12.1.4 Italy
- 12.1.5 Spain
- 12.1.6 Rest of Europe
- 13. Asia Pacific Cell Dissociation Market Analysis, Insights and Forecast, 2019-2031
- 13.1. Market Analysis, Insights and Forecast - By Country/Sub-region
- 13.1.1 China
- 13.1.2 Japan
- 13.1.3 India
- 13.1.4 Australia
- 13.1.5 South Korea
- 13.1.6 Rest of Asia Pacific
- 14. Middle East and Africa Cell Dissociation Market Analysis, Insights and Forecast, 2019-2031
- 14.1. Market Analysis, Insights and Forecast - By Country/Sub-region
- 14.1.1 GCC
- 14.1.2 South Africa
- 14.1.3 Rest of Middle East and Africa
- 15. South America Cell Dissociation Market Analysis, Insights and Forecast, 2019-2031
- 15.1. Market Analysis, Insights and Forecast - By Country/Sub-region
- 15.1.1 Brazil
- 15.1.2 Argentina
- 15.1.3 Rest of South America
- 16. Competitive Analysis
- 16.1. Global Market Share Analysis 2024
- 16.2. Company Profiles
- 16.2.1 Becton Dickinson and Company
- 16.2.1.1. Overview
- 16.2.1.2. Products
- 16.2.1.3. SWOT Analysis
- 16.2.1.4. Recent Developments
- 16.2.1.5. Financials (Based on Availability)
- 16.2.2 Himedia Laboratories
- 16.2.2.1. Overview
- 16.2.2.2. Products
- 16.2.2.3. SWOT Analysis
- 16.2.2.4. Recent Developments
- 16.2.2.5. Financials (Based on Availability)
- 16.2.3 Merck KGaA
- 16.2.3.1. Overview
- 16.2.3.2. Products
- 16.2.3.3. SWOT Analysis
- 16.2.3.4. Recent Developments
- 16.2.3.5. Financials (Based on Availability)
- 16.2.4 F Hoffmann-La Roche Ltd
- 16.2.4.1. Overview
- 16.2.4.2. Products
- 16.2.4.3. SWOT Analysis
- 16.2.4.4. Recent Developments
- 16.2.4.5. Financials (Based on Availability)
- 16.2.5 GE Healthcare
- 16.2.5.1. Overview
- 16.2.5.2. Products
- 16.2.5.3. SWOT Analysis
- 16.2.5.4. Recent Developments
- 16.2.5.5. Financials (Based on Availability)
- 16.2.6 6 COMPETITIVE LANDSCAPE6 1 COMPANY PROFILES
- 16.2.6.1. Overview
- 16.2.6.2. Products
- 16.2.6.3. SWOT Analysis
- 16.2.6.4. Recent Developments
- 16.2.6.5. Financials (Based on Availability)
- 16.2.7 American Type Culture Collection
- 16.2.7.1. Overview
- 16.2.7.2. Products
- 16.2.7.3. SWOT Analysis
- 16.2.7.4. Recent Developments
- 16.2.7.5. Financials (Based on Availability)
- 16.2.8 Miltenyi Biotec
- 16.2.8.1. Overview
- 16.2.8.2. Products
- 16.2.8.3. SWOT Analysis
- 16.2.8.4. Recent Developments
- 16.2.8.5. Financials (Based on Availability)
- 16.2.9 Pan-Biotech
- 16.2.9.1. Overview
- 16.2.9.2. Products
- 16.2.9.3. SWOT Analysis
- 16.2.9.4. Recent Developments
- 16.2.9.5. Financials (Based on Availability)
- 16.2.10 Thermo Fisher Scientific
- 16.2.10.1. Overview
- 16.2.10.2. Products
- 16.2.10.3. SWOT Analysis
- 16.2.10.4. Recent Developments
- 16.2.10.5. Financials (Based on Availability)
- 16.2.11 Stemcell Technologies
- 16.2.11.1. Overview
- 16.2.11.2. Products
- 16.2.11.3. SWOT Analysis
- 16.2.11.4. Recent Developments
- 16.2.11.5. Financials (Based on Availability)
- 16.2.1 Becton Dickinson and Company
List of Figures
- Figure 1: Global Cell Dissociation Market Revenue Breakdown (Million, %) by Region 2024 & 2032
- Figure 2: Global Cell Dissociation Market Volume Breakdown (K Unit, %) by Region 2024 & 2032
- Figure 3: North America Cell Dissociation Market Revenue (Million), by Country 2024 & 2032
- Figure 4: North America Cell Dissociation Market Volume (K Unit), by Country 2024 & 2032
- Figure 5: North America Cell Dissociation Market Revenue Share (%), by Country 2024 & 2032
- Figure 6: North America Cell Dissociation Market Volume Share (%), by Country 2024 & 2032
- Figure 7: Europe Cell Dissociation Market Revenue (Million), by Country 2024 & 2032
- Figure 8: Europe Cell Dissociation Market Volume (K Unit), by Country 2024 & 2032
- Figure 9: Europe Cell Dissociation Market Revenue Share (%), by Country 2024 & 2032
- Figure 10: Europe Cell Dissociation Market Volume Share (%), by Country 2024 & 2032
- Figure 11: Asia Pacific Cell Dissociation Market Revenue (Million), by Country 2024 & 2032
- Figure 12: Asia Pacific Cell Dissociation Market Volume (K Unit), by Country 2024 & 2032
- Figure 13: Asia Pacific Cell Dissociation Market Revenue Share (%), by Country 2024 & 2032
- Figure 14: Asia Pacific Cell Dissociation Market Volume Share (%), by Country 2024 & 2032
- Figure 15: Middle East and Africa Cell Dissociation Market Revenue (Million), by Country 2024 & 2032
- Figure 16: Middle East and Africa Cell Dissociation Market Volume (K Unit), by Country 2024 & 2032
- Figure 17: Middle East and Africa Cell Dissociation Market Revenue Share (%), by Country 2024 & 2032
- Figure 18: Middle East and Africa Cell Dissociation Market Volume Share (%), by Country 2024 & 2032
- Figure 19: South America Cell Dissociation Market Revenue (Million), by Country 2024 & 2032
- Figure 20: South America Cell Dissociation Market Volume (K Unit), by Country 2024 & 2032
- Figure 21: South America Cell Dissociation Market Revenue Share (%), by Country 2024 & 2032
- Figure 22: South America Cell Dissociation Market Volume Share (%), by Country 2024 & 2032
- Figure 23: North America Cell Dissociation Market Revenue (Million), by Product 2024 & 2032
- Figure 24: North America Cell Dissociation Market Volume (K Unit), by Product 2024 & 2032
- Figure 25: North America Cell Dissociation Market Revenue Share (%), by Product 2024 & 2032
- Figure 26: North America Cell Dissociation Market Volume Share (%), by Product 2024 & 2032
- Figure 27: North America Cell Dissociation Market Revenue (Million), by Tissue 2024 & 2032
- Figure 28: North America Cell Dissociation Market Volume (K Unit), by Tissue 2024 & 2032
- Figure 29: North America Cell Dissociation Market Revenue Share (%), by Tissue 2024 & 2032
- Figure 30: North America Cell Dissociation Market Volume Share (%), by Tissue 2024 & 2032
- Figure 31: North America Cell Dissociation Market Revenue (Million), by End-User 2024 & 2032
- Figure 32: North America Cell Dissociation Market Volume (K Unit), by End-User 2024 & 2032
- Figure 33: North America Cell Dissociation Market Revenue Share (%), by End-User 2024 & 2032
- Figure 34: North America Cell Dissociation Market Volume Share (%), by End-User 2024 & 2032
- Figure 35: North America Cell Dissociation Market Revenue (Million), by Country 2024 & 2032
- Figure 36: North America Cell Dissociation Market Volume (K Unit), by Country 2024 & 2032
- Figure 37: North America Cell Dissociation Market Revenue Share (%), by Country 2024 & 2032
- Figure 38: North America Cell Dissociation Market Volume Share (%), by Country 2024 & 2032
- Figure 39: Europe Cell Dissociation Market Revenue (Million), by Product 2024 & 2032
- Figure 40: Europe Cell Dissociation Market Volume (K Unit), by Product 2024 & 2032
- Figure 41: Europe Cell Dissociation Market Revenue Share (%), by Product 2024 & 2032
- Figure 42: Europe Cell Dissociation Market Volume Share (%), by Product 2024 & 2032
- Figure 43: Europe Cell Dissociation Market Revenue (Million), by Tissue 2024 & 2032
- Figure 44: Europe Cell Dissociation Market Volume (K Unit), by Tissue 2024 & 2032
- Figure 45: Europe Cell Dissociation Market Revenue Share (%), by Tissue 2024 & 2032
- Figure 46: Europe Cell Dissociation Market Volume Share (%), by Tissue 2024 & 2032
- Figure 47: Europe Cell Dissociation Market Revenue (Million), by End-User 2024 & 2032
- Figure 48: Europe Cell Dissociation Market Volume (K Unit), by End-User 2024 & 2032
- Figure 49: Europe Cell Dissociation Market Revenue Share (%), by End-User 2024 & 2032
- Figure 50: Europe Cell Dissociation Market Volume Share (%), by End-User 2024 & 2032
- Figure 51: Europe Cell Dissociation Market Revenue (Million), by Country 2024 & 2032
- Figure 52: Europe Cell Dissociation Market Volume (K Unit), by Country 2024 & 2032
- Figure 53: Europe Cell Dissociation Market Revenue Share (%), by Country 2024 & 2032
- Figure 54: Europe Cell Dissociation Market Volume Share (%), by Country 2024 & 2032
- Figure 55: Asia Pacific Cell Dissociation Market Revenue (Million), by Product 2024 & 2032
- Figure 56: Asia Pacific Cell Dissociation Market Volume (K Unit), by Product 2024 & 2032
- Figure 57: Asia Pacific Cell Dissociation Market Revenue Share (%), by Product 2024 & 2032
- Figure 58: Asia Pacific Cell Dissociation Market Volume Share (%), by Product 2024 & 2032
- Figure 59: Asia Pacific Cell Dissociation Market Revenue (Million), by Tissue 2024 & 2032
- Figure 60: Asia Pacific Cell Dissociation Market Volume (K Unit), by Tissue 2024 & 2032
- Figure 61: Asia Pacific Cell Dissociation Market Revenue Share (%), by Tissue 2024 & 2032
- Figure 62: Asia Pacific Cell Dissociation Market Volume Share (%), by Tissue 2024 & 2032
- Figure 63: Asia Pacific Cell Dissociation Market Revenue (Million), by End-User 2024 & 2032
- Figure 64: Asia Pacific Cell Dissociation Market Volume (K Unit), by End-User 2024 & 2032
- Figure 65: Asia Pacific Cell Dissociation Market Revenue Share (%), by End-User 2024 & 2032
- Figure 66: Asia Pacific Cell Dissociation Market Volume Share (%), by End-User 2024 & 2032
- Figure 67: Asia Pacific Cell Dissociation Market Revenue (Million), by Country 2024 & 2032
- Figure 68: Asia Pacific Cell Dissociation Market Volume (K Unit), by Country 2024 & 2032
- Figure 69: Asia Pacific Cell Dissociation Market Revenue Share (%), by Country 2024 & 2032
- Figure 70: Asia Pacific Cell Dissociation Market Volume Share (%), by Country 2024 & 2032
- Figure 71: Middle East and Africa Cell Dissociation Market Revenue (Million), by Product 2024 & 2032
- Figure 72: Middle East and Africa Cell Dissociation Market Volume (K Unit), by Product 2024 & 2032
- Figure 73: Middle East and Africa Cell Dissociation Market Revenue Share (%), by Product 2024 & 2032
- Figure 74: Middle East and Africa Cell Dissociation Market Volume Share (%), by Product 2024 & 2032
- Figure 75: Middle East and Africa Cell Dissociation Market Revenue (Million), by Tissue 2024 & 2032
- Figure 76: Middle East and Africa Cell Dissociation Market Volume (K Unit), by Tissue 2024 & 2032
- Figure 77: Middle East and Africa Cell Dissociation Market Revenue Share (%), by Tissue 2024 & 2032
- Figure 78: Middle East and Africa Cell Dissociation Market Volume Share (%), by Tissue 2024 & 2032
- Figure 79: Middle East and Africa Cell Dissociation Market Revenue (Million), by End-User 2024 & 2032
- Figure 80: Middle East and Africa Cell Dissociation Market Volume (K Unit), by End-User 2024 & 2032
- Figure 81: Middle East and Africa Cell Dissociation Market Revenue Share (%), by End-User 2024 & 2032
- Figure 82: Middle East and Africa Cell Dissociation Market Volume Share (%), by End-User 2024 & 2032
- Figure 83: Middle East and Africa Cell Dissociation Market Revenue (Million), by Country 2024 & 2032
- Figure 84: Middle East and Africa Cell Dissociation Market Volume (K Unit), by Country 2024 & 2032
- Figure 85: Middle East and Africa Cell Dissociation Market Revenue Share (%), by Country 2024 & 2032
- Figure 86: Middle East and Africa Cell Dissociation Market Volume Share (%), by Country 2024 & 2032
- Figure 87: South America Cell Dissociation Market Revenue (Million), by Product 2024 & 2032
- Figure 88: South America Cell Dissociation Market Volume (K Unit), by Product 2024 & 2032
- Figure 89: South America Cell Dissociation Market Revenue Share (%), by Product 2024 & 2032
- Figure 90: South America Cell Dissociation Market Volume Share (%), by Product 2024 & 2032
- Figure 91: South America Cell Dissociation Market Revenue (Million), by Tissue 2024 & 2032
- Figure 92: South America Cell Dissociation Market Volume (K Unit), by Tissue 2024 & 2032
- Figure 93: South America Cell Dissociation Market Revenue Share (%), by Tissue 2024 & 2032
- Figure 94: South America Cell Dissociation Market Volume Share (%), by Tissue 2024 & 2032
- Figure 95: South America Cell Dissociation Market Revenue (Million), by End-User 2024 & 2032
- Figure 96: South America Cell Dissociation Market Volume (K Unit), by End-User 2024 & 2032
- Figure 97: South America Cell Dissociation Market Revenue Share (%), by End-User 2024 & 2032
- Figure 98: South America Cell Dissociation Market Volume Share (%), by End-User 2024 & 2032
- Figure 99: South America Cell Dissociation Market Revenue (Million), by Country 2024 & 2032
- Figure 100: South America Cell Dissociation Market Volume (K Unit), by Country 2024 & 2032
- Figure 101: South America Cell Dissociation Market Revenue Share (%), by Country 2024 & 2032
- Figure 102: South America Cell Dissociation Market Volume Share (%), by Country 2024 & 2032
List of Tables
- Table 1: Global Cell Dissociation Market Revenue Million Forecast, by Region 2019 & 2032
- Table 2: Global Cell Dissociation Market Volume K Unit Forecast, by Region 2019 & 2032
- Table 3: Global Cell Dissociation Market Revenue Million Forecast, by Product 2019 & 2032
- Table 4: Global Cell Dissociation Market Volume K Unit Forecast, by Product 2019 & 2032
- Table 5: Global Cell Dissociation Market Revenue Million Forecast, by Tissue 2019 & 2032
- Table 6: Global Cell Dissociation Market Volume K Unit Forecast, by Tissue 2019 & 2032
- Table 7: Global Cell Dissociation Market Revenue Million Forecast, by End-User 2019 & 2032
- Table 8: Global Cell Dissociation Market Volume K Unit Forecast, by End-User 2019 & 2032
- Table 9: Global Cell Dissociation Market Revenue Million Forecast, by Region 2019 & 2032
- Table 10: Global Cell Dissociation Market Volume K Unit Forecast, by Region 2019 & 2032
- Table 11: Global Cell Dissociation Market Revenue Million Forecast, by Country 2019 & 2032
- Table 12: Global Cell Dissociation Market Volume K Unit Forecast, by Country 2019 & 2032
- Table 13: United States Cell Dissociation Market Revenue (Million) Forecast, by Application 2019 & 2032
- Table 14: United States Cell Dissociation Market Volume (K Unit) Forecast, by Application 2019 & 2032
- Table 15: Canada Cell Dissociation Market Revenue (Million) Forecast, by Application 2019 & 2032
- Table 16: Canada Cell Dissociation Market Volume (K Unit) Forecast, by Application 2019 & 2032
- Table 17: Mexico Cell Dissociation Market Revenue (Million) Forecast, by Application 2019 & 2032
- Table 18: Mexico Cell Dissociation Market Volume (K Unit) Forecast, by Application 2019 & 2032
- Table 19: Global Cell Dissociation Market Revenue Million Forecast, by Country 2019 & 2032
- Table 20: Global Cell Dissociation Market Volume K Unit Forecast, by Country 2019 & 2032
- Table 21: Germany Cell Dissociation Market Revenue (Million) Forecast, by Application 2019 & 2032
- Table 22: Germany Cell Dissociation Market Volume (K Unit) Forecast, by Application 2019 & 2032
- Table 23: United Kingdom Cell Dissociation Market Revenue (Million) Forecast, by Application 2019 & 2032
- Table 24: United Kingdom Cell Dissociation Market Volume (K Unit) Forecast, by Application 2019 & 2032
- Table 25: France Cell Dissociation Market Revenue (Million) Forecast, by Application 2019 & 2032
- Table 26: France Cell Dissociation Market Volume (K Unit) Forecast, by Application 2019 & 2032
- Table 27: Italy Cell Dissociation Market Revenue (Million) Forecast, by Application 2019 & 2032
- Table 28: Italy Cell Dissociation Market Volume (K Unit) Forecast, by Application 2019 & 2032
- Table 29: Spain Cell Dissociation Market Revenue (Million) Forecast, by Application 2019 & 2032
- Table 30: Spain Cell Dissociation Market Volume (K Unit) Forecast, by Application 2019 & 2032
- Table 31: Rest of Europe Cell Dissociation Market Revenue (Million) Forecast, by Application 2019 & 2032
- Table 32: Rest of Europe Cell Dissociation Market Volume (K Unit) Forecast, by Application 2019 & 2032
- Table 33: Global Cell Dissociation Market Revenue Million Forecast, by Country 2019 & 2032
- Table 34: Global Cell Dissociation Market Volume K Unit Forecast, by Country 2019 & 2032
- Table 35: China Cell Dissociation Market Revenue (Million) Forecast, by Application 2019 & 2032
- Table 36: China Cell Dissociation Market Volume (K Unit) Forecast, by Application 2019 & 2032
- Table 37: Japan Cell Dissociation Market Revenue (Million) Forecast, by Application 2019 & 2032
- Table 38: Japan Cell Dissociation Market Volume (K Unit) Forecast, by Application 2019 & 2032
- Table 39: India Cell Dissociation Market Revenue (Million) Forecast, by Application 2019 & 2032
- Table 40: India Cell Dissociation Market Volume (K Unit) Forecast, by Application 2019 & 2032
- Table 41: Australia Cell Dissociation Market Revenue (Million) Forecast, by Application 2019 & 2032
- Table 42: Australia Cell Dissociation Market Volume (K Unit) Forecast, by Application 2019 & 2032
- Table 43: South Korea Cell Dissociation Market Revenue (Million) Forecast, by Application 2019 & 2032
- Table 44: South Korea Cell Dissociation Market Volume (K Unit) Forecast, by Application 2019 & 2032
- Table 45: Rest of Asia Pacific Cell Dissociation Market Revenue (Million) Forecast, by Application 2019 & 2032
- Table 46: Rest of Asia Pacific Cell Dissociation Market Volume (K Unit) Forecast, by Application 2019 & 2032
- Table 47: Global Cell Dissociation Market Revenue Million Forecast, by Country 2019 & 2032
- Table 48: Global Cell Dissociation Market Volume K Unit Forecast, by Country 2019 & 2032
- Table 49: GCC Cell Dissociation Market Revenue (Million) Forecast, by Application 2019 & 2032
- Table 50: GCC Cell Dissociation Market Volume (K Unit) Forecast, by Application 2019 & 2032
- Table 51: South Africa Cell Dissociation Market Revenue (Million) Forecast, by Application 2019 & 2032
- Table 52: South Africa Cell Dissociation Market Volume (K Unit) Forecast, by Application 2019 & 2032
- Table 53: Rest of Middle East and Africa Cell Dissociation Market Revenue (Million) Forecast, by Application 2019 & 2032
- Table 54: Rest of Middle East and Africa Cell Dissociation Market Volume (K Unit) Forecast, by Application 2019 & 2032
- Table 55: Global Cell Dissociation Market Revenue Million Forecast, by Country 2019 & 2032
- Table 56: Global Cell Dissociation Market Volume K Unit Forecast, by Country 2019 & 2032
- Table 57: Brazil Cell Dissociation Market Revenue (Million) Forecast, by Application 2019 & 2032
- Table 58: Brazil Cell Dissociation Market Volume (K Unit) Forecast, by Application 2019 & 2032
- Table 59: Argentina Cell Dissociation Market Revenue (Million) Forecast, by Application 2019 & 2032
- Table 60: Argentina Cell Dissociation Market Volume (K Unit) Forecast, by Application 2019 & 2032
- Table 61: Rest of South America Cell Dissociation Market Revenue (Million) Forecast, by Application 2019 & 2032
- Table 62: Rest of South America Cell Dissociation Market Volume (K Unit) Forecast, by Application 2019 & 2032
- Table 63: Global Cell Dissociation Market Revenue Million Forecast, by Product 2019 & 2032
- Table 64: Global Cell Dissociation Market Volume K Unit Forecast, by Product 2019 & 2032
- Table 65: Global Cell Dissociation Market Revenue Million Forecast, by Tissue 2019 & 2032
- Table 66: Global Cell Dissociation Market Volume K Unit Forecast, by Tissue 2019 & 2032
- Table 67: Global Cell Dissociation Market Revenue Million Forecast, by End-User 2019 & 2032
- Table 68: Global Cell Dissociation Market Volume K Unit Forecast, by End-User 2019 & 2032
- Table 69: Global Cell Dissociation Market Revenue Million Forecast, by Country 2019 & 2032
- Table 70: Global Cell Dissociation Market Volume K Unit Forecast, by Country 2019 & 2032
- Table 71: United States Cell Dissociation Market Revenue (Million) Forecast, by Application 2019 & 2032
- Table 72: United States Cell Dissociation Market Volume (K Unit) Forecast, by Application 2019 & 2032
- Table 73: Canada Cell Dissociation Market Revenue (Million) Forecast, by Application 2019 & 2032
- Table 74: Canada Cell Dissociation Market Volume (K Unit) Forecast, by Application 2019 & 2032
- Table 75: Mexico Cell Dissociation Market Revenue (Million) Forecast, by Application 2019 & 2032
- Table 76: Mexico Cell Dissociation Market Volume (K Unit) Forecast, by Application 2019 & 2032
- Table 77: Global Cell Dissociation Market Revenue Million Forecast, by Product 2019 & 2032
- Table 78: Global Cell Dissociation Market Volume K Unit Forecast, by Product 2019 & 2032
- Table 79: Global Cell Dissociation Market Revenue Million Forecast, by Tissue 2019 & 2032
- Table 80: Global Cell Dissociation Market Volume K Unit Forecast, by Tissue 2019 & 2032
- Table 81: Global Cell Dissociation Market Revenue Million Forecast, by End-User 2019 & 2032
- Table 82: Global Cell Dissociation Market Volume K Unit Forecast, by End-User 2019 & 2032
- Table 83: Global Cell Dissociation Market Revenue Million Forecast, by Country 2019 & 2032
- Table 84: Global Cell Dissociation Market Volume K Unit Forecast, by Country 2019 & 2032
- Table 85: Germany Cell Dissociation Market Revenue (Million) Forecast, by Application 2019 & 2032
- Table 86: Germany Cell Dissociation Market Volume (K Unit) Forecast, by Application 2019 & 2032
- Table 87: United Kingdom Cell Dissociation Market Revenue (Million) Forecast, by Application 2019 & 2032
- Table 88: United Kingdom Cell Dissociation Market Volume (K Unit) Forecast, by Application 2019 & 2032
- Table 89: France Cell Dissociation Market Revenue (Million) Forecast, by Application 2019 & 2032
- Table 90: France Cell Dissociation Market Volume (K Unit) Forecast, by Application 2019 & 2032
- Table 91: Italy Cell Dissociation Market Revenue (Million) Forecast, by Application 2019 & 2032
- Table 92: Italy Cell Dissociation Market Volume (K Unit) Forecast, by Application 2019 & 2032
- Table 93: Spain Cell Dissociation Market Revenue (Million) Forecast, by Application 2019 & 2032
- Table 94: Spain Cell Dissociation Market Volume (K Unit) Forecast, by Application 2019 & 2032
- Table 95: Rest of Europe Cell Dissociation Market Revenue (Million) Forecast, by Application 2019 & 2032
- Table 96: Rest of Europe Cell Dissociation Market Volume (K Unit) Forecast, by Application 2019 & 2032
- Table 97: Global Cell Dissociation Market Revenue Million Forecast, by Product 2019 & 2032
- Table 98: Global Cell Dissociation Market Volume K Unit Forecast, by Product 2019 & 2032
- Table 99: Global Cell Dissociation Market Revenue Million Forecast, by Tissue 2019 & 2032
- Table 100: Global Cell Dissociation Market Volume K Unit Forecast, by Tissue 2019 & 2032
- Table 101: Global Cell Dissociation Market Revenue Million Forecast, by End-User 2019 & 2032
- Table 102: Global Cell Dissociation Market Volume K Unit Forecast, by End-User 2019 & 2032
- Table 103: Global Cell Dissociation Market Revenue Million Forecast, by Country 2019 & 2032
- Table 104: Global Cell Dissociation Market Volume K Unit Forecast, by Country 2019 & 2032
- Table 105: China Cell Dissociation Market Revenue (Million) Forecast, by Application 2019 & 2032
- Table 106: China Cell Dissociation Market Volume (K Unit) Forecast, by Application 2019 & 2032
- Table 107: Japan Cell Dissociation Market Revenue (Million) Forecast, by Application 2019 & 2032
- Table 108: Japan Cell Dissociation Market Volume (K Unit) Forecast, by Application 2019 & 2032
- Table 109: India Cell Dissociation Market Revenue (Million) Forecast, by Application 2019 & 2032
- Table 110: India Cell Dissociation Market Volume (K Unit) Forecast, by Application 2019 & 2032
- Table 111: Australia Cell Dissociation Market Revenue (Million) Forecast, by Application 2019 & 2032
- Table 112: Australia Cell Dissociation Market Volume (K Unit) Forecast, by Application 2019 & 2032
- Table 113: South Korea Cell Dissociation Market Revenue (Million) Forecast, by Application 2019 & 2032
- Table 114: South Korea Cell Dissociation Market Volume (K Unit) Forecast, by Application 2019 & 2032
- Table 115: Rest of Asia Pacific Cell Dissociation Market Revenue (Million) Forecast, by Application 2019 & 2032
- Table 116: Rest of Asia Pacific Cell Dissociation Market Volume (K Unit) Forecast, by Application 2019 & 2032
- Table 117: Global Cell Dissociation Market Revenue Million Forecast, by Product 2019 & 2032
- Table 118: Global Cell Dissociation Market Volume K Unit Forecast, by Product 2019 & 2032
- Table 119: Global Cell Dissociation Market Revenue Million Forecast, by Tissue 2019 & 2032
- Table 120: Global Cell Dissociation Market Volume K Unit Forecast, by Tissue 2019 & 2032
- Table 121: Global Cell Dissociation Market Revenue Million Forecast, by End-User 2019 & 2032
- Table 122: Global Cell Dissociation Market Volume K Unit Forecast, by End-User 2019 & 2032
- Table 123: Global Cell Dissociation Market Revenue Million Forecast, by Country 2019 & 2032
- Table 124: Global Cell Dissociation Market Volume K Unit Forecast, by Country 2019 & 2032
- Table 125: GCC Cell Dissociation Market Revenue (Million) Forecast, by Application 2019 & 2032
- Table 126: GCC Cell Dissociation Market Volume (K Unit) Forecast, by Application 2019 & 2032
- Table 127: South Africa Cell Dissociation Market Revenue (Million) Forecast, by Application 2019 & 2032
- Table 128: South Africa Cell Dissociation Market Volume (K Unit) Forecast, by Application 2019 & 2032
- Table 129: Rest of Middle East and Africa Cell Dissociation Market Revenue (Million) Forecast, by Application 2019 & 2032
- Table 130: Rest of Middle East and Africa Cell Dissociation Market Volume (K Unit) Forecast, by Application 2019 & 2032
- Table 131: Global Cell Dissociation Market Revenue Million Forecast, by Product 2019 & 2032
- Table 132: Global Cell Dissociation Market Volume K Unit Forecast, by Product 2019 & 2032
- Table 133: Global Cell Dissociation Market Revenue Million Forecast, by Tissue 2019 & 2032
- Table 134: Global Cell Dissociation Market Volume K Unit Forecast, by Tissue 2019 & 2032
- Table 135: Global Cell Dissociation Market Revenue Million Forecast, by End-User 2019 & 2032
- Table 136: Global Cell Dissociation Market Volume K Unit Forecast, by End-User 2019 & 2032
- Table 137: Global Cell Dissociation Market Revenue Million Forecast, by Country 2019 & 2032
- Table 138: Global Cell Dissociation Market Volume K Unit Forecast, by Country 2019 & 2032
- Table 139: Brazil Cell Dissociation Market Revenue (Million) Forecast, by Application 2019 & 2032
- Table 140: Brazil Cell Dissociation Market Volume (K Unit) Forecast, by Application 2019 & 2032
- Table 141: Argentina Cell Dissociation Market Revenue (Million) Forecast, by Application 2019 & 2032
- Table 142: Argentina Cell Dissociation Market Volume (K Unit) Forecast, by Application 2019 & 2032
- Table 143: Rest of South America Cell Dissociation Market Revenue (Million) Forecast, by Application 2019 & 2032
- Table 144: Rest of South America Cell Dissociation Market Volume (K Unit) Forecast, by Application 2019 & 2032
Frequently Asked Questions
1. What is the projected Compound Annual Growth Rate (CAGR) of the Cell Dissociation Market?
The projected CAGR is approximately 15.17%.
2. Which companies are prominent players in the Cell Dissociation Market?
Key companies in the market include Becton Dickinson and Company, Himedia Laboratories, Merck KGaA, F Hoffmann-La Roche Ltd, GE Healthcare, 6 COMPETITIVE LANDSCAPE6 1 COMPANY PROFILES, American Type Culture Collection, Miltenyi Biotec, Pan-Biotech, Thermo Fisher Scientific, Stemcell Technologies.
3. What are the main segments of the Cell Dissociation Market?
The market segments include Product, Tissue, End-User.
4. Can you provide details about the market size?
The market size is estimated to be USD 0.53 Million as of 2022.
5. What are some drivers contributing to market growth?
Increasing R&D Activities in Biopharmaceutical Companies; Favourable Funding Scenario for Cancer Research.
6. What are the notable trends driving market growth?
Pharmaceutical and Biotechnology Companies Segment is Expected to Witness a Healthy Growth Over the Forecast Period.
7. Are there any restraints impacting market growth?
High cost of Tissue- and Cell-based Procedures.
8. Can you provide examples of recent developments in the market?
September 2022: Marinus Pharmaceuticals exercised the first contract option by the Biomedical Advanced Research and Development Authority (BARDA), valued at approximately USD 12.3 million, to support the United States onshoring of the manufacturing capabilities for ganaxolone.
9. What pricing options are available for accessing the report?
Pricing options include single-user, multi-user, and enterprise licenses priced at USD 4750, USD 5250, and USD 8750 respectively.
10. Is the market size provided in terms of value or volume?
The market size is provided in terms of value, measured in Million and volume, measured in K Unit.
11. Are there any specific market keywords associated with the report?
Yes, the market keyword associated with the report is "Cell Dissociation Market," which aids in identifying and referencing the specific market segment covered.
12. How do I determine which pricing option suits my needs best?
The pricing options vary based on user requirements and access needs. Individual users may opt for single-user licenses, while businesses requiring broader access may choose multi-user or enterprise licenses for cost-effective access to the report.
13. Are there any additional resources or data provided in the Cell Dissociation Market report?
While the report offers comprehensive insights, it's advisable to review the specific contents or supplementary materials provided to ascertain if additional resources or data are available.
14. How can I stay updated on further developments or reports in the Cell Dissociation Market?
To stay informed about further developments, trends, and reports in the Cell Dissociation Market, consider subscribing to industry newsletters, following relevant companies and organizations, or regularly checking reputable industry news sources and publications.
Methodology
Step 1 - Identification of Relevant Samples Size from Population Database


Step 2 - Approaches for Defining Global Market Size (Value, Volume* & Price*)

Note*: In applicable scenarios
Step 3 - Data Sources
Primary Research
- Web Analytics
- Survey Reports
- Research Institute
- Latest Research Reports
- Opinion Leaders
Secondary Research
- Annual Reports
- White Paper
- Latest Press Release
- Industry Association
- Paid Database
- Investor Presentations

Step 4 - Data Triangulation
Involves using different sources of information in order to increase the validity of a study
These sources are likely to be stakeholders in a program - participants, other researchers, program staff, other community members, and so on.
Then we put all data in single framework & apply various statistical tools to find out the dynamic on the market.
During the analysis stage, feedback from the stakeholder groups would be compared to determine areas of agreement as well as areas of divergence


