
Key Insights
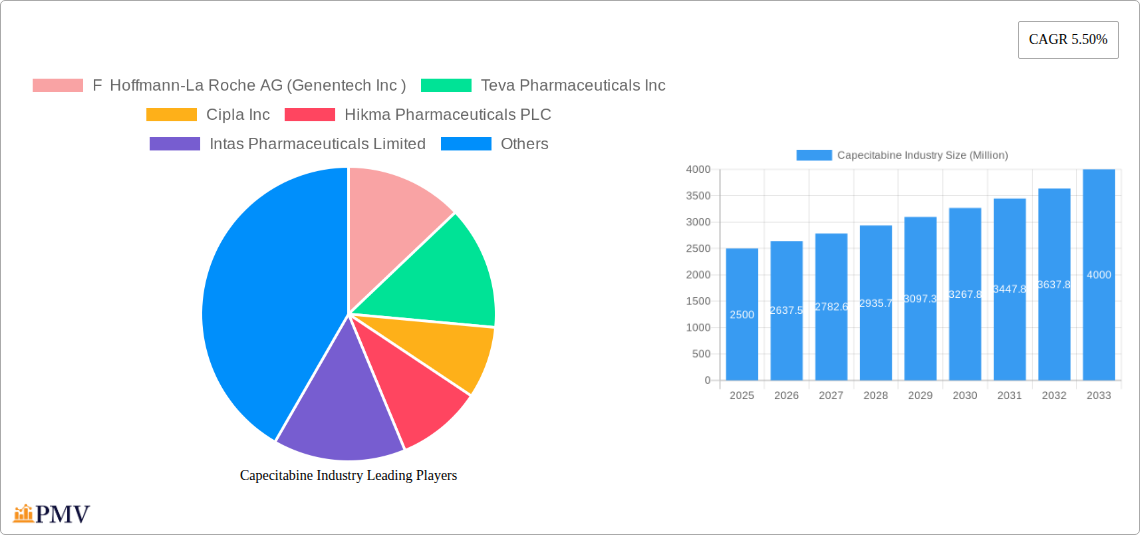
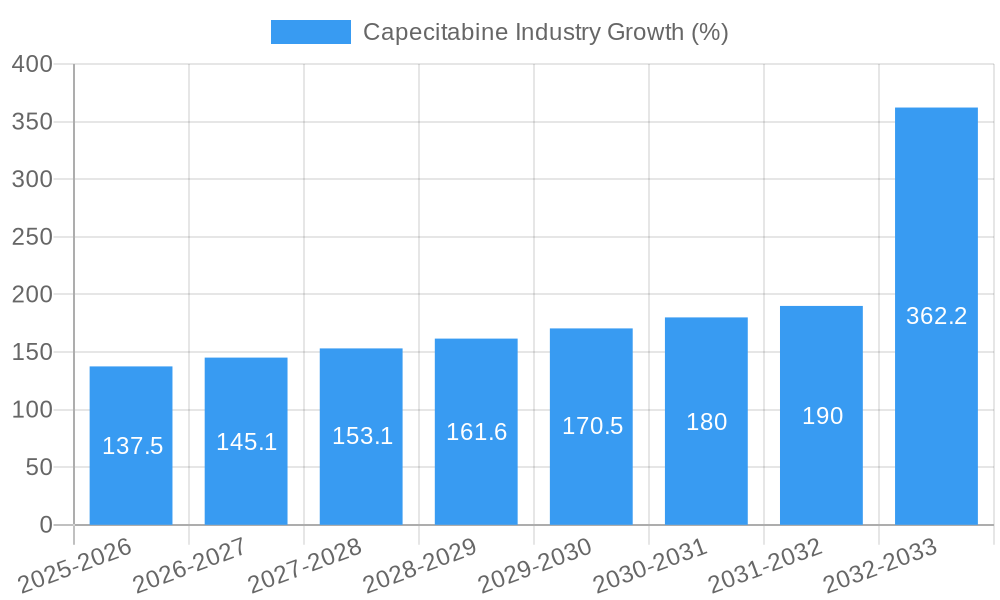
The global capecitabine market, valued at approximately $2.5 billion in 2025, is projected to experience robust growth, driven by a rising incidence of colorectal and breast cancers, the two primary indications for capecitabine. A compound annual growth rate (CAGR) of 5.50% from 2025 to 2033 indicates a significant market expansion, reaching an estimated $4 billion by 2033. This growth is fueled by increasing awareness of cancer and improved diagnostic capabilities, leading to earlier detection and treatment. Furthermore, the ongoing development of novel treatment regimens incorporating capecitabine, along with a growing geriatric population susceptible to these cancers, are significant contributing factors. The market is segmented by indication (colorectal cancer holding the largest share, followed by breast cancer and others), and distribution channel (hospitals and clinical laboratories being the dominant segments). Major players like Roche (Genentech), Teva Pharmaceuticals, Cipla, and others are actively involved in manufacturing and distributing capecitabine, contributing to the market's competitiveness. However, the market faces challenges including the emergence of biosimilar competition and the potential for side effects associated with capecitabine treatment, necessitating careful patient monitoring and management. Geographical variations exist, with North America and Europe expected to maintain substantial market shares due to high healthcare expenditure and advanced healthcare infrastructure. However, Asia-Pacific is projected to witness significant growth driven by increasing healthcare investments and rising cancer prevalence in the region.
The competitive landscape is characterized by both established pharmaceutical giants and emerging players. Strategic alliances, acquisitions, and the introduction of innovative formulations are key strategies employed by companies to gain a competitive edge. The pricing dynamics of capecitabine will likely be influenced by generic competition, patent expirations, and healthcare policy changes across different regions. The long-term outlook for the capecitabine market remains positive, predicated on sustained growth in cancer incidence and advancements in treatment approaches. Continued research and development efforts focused on improving efficacy and reducing side effects are crucial for sustaining market growth and patient benefit. Regulatory approvals and reimbursement policies also play a significant role in shaping the market trajectory.
Capecitabine Industry Market Report: 2019-2033
This comprehensive report provides a detailed analysis of the global Capecitabine industry, offering invaluable insights for stakeholders seeking to navigate this dynamic market. Covering the period 2019-2033, with a base year of 2025 and a forecast period of 2025-2033, this report delivers actionable intelligence for strategic decision-making. The global Capecitabine market is estimated at xx Million in 2025 and is projected to reach xx Million by 2033, exhibiting a CAGR of xx% during the forecast period.
Capecitabine Industry Market Structure & Competitive Dynamics
The Capecitabine market exhibits a moderately concentrated structure, with several key players holding significant market share. F Hoffmann-La Roche AG (Genentech Inc), Teva Pharmaceuticals Inc, and Cipla Inc are among the leading companies, collectively accounting for an estimated xx% of the market in 2025. The industry is characterized by a dynamic innovation ecosystem, with ongoing research and development efforts focused on improving drug efficacy and reducing side effects. Regulatory frameworks, such as those set by the FDA and EMA, play a significant role in shaping market access and product approvals. Generic competition is intense, impacting pricing strategies and market share dynamics. Substitutes, while limited, include other chemotherapeutic agents for colorectal and breast cancer. End-user trends reveal a growing preference for targeted therapies and personalized medicine approaches. Significant M&A activity in the pharmaceutical sector has influenced market consolidation, with deal values reaching billions of dollars in recent years. Key examples include [mention specific M&A deals with approximate values if available, or use "xx Million" if unavailable].
Capecitabine Industry Trends & Insights
The Capecitabine market is driven by several key factors, including the rising prevalence of colorectal and breast cancer globally. Increasing healthcare expenditure and growing awareness regarding cancer treatment options further fuel market growth. Technological advancements in drug delivery systems and personalized medicine are revolutionizing cancer treatment, impacting Capecitabine's market penetration. Changing consumer preferences towards minimally invasive treatments and improved quality of life are shaping the demand for efficient and tolerable chemotherapy regimens. The competitive landscape is characterized by both brand-name and generic drug manufacturers vying for market share, creating price pressures and driving innovation. The market is witnessing a shift towards biosimilar products, which could significantly affect the pricing and market share of originator drugs in the coming years. Market penetration rates vary across geographical regions, with developed economies exhibiting higher adoption rates than emerging markets due to factors such as higher healthcare spending and greater awareness.
Dominant Markets & Segments in Capecitabine Industry
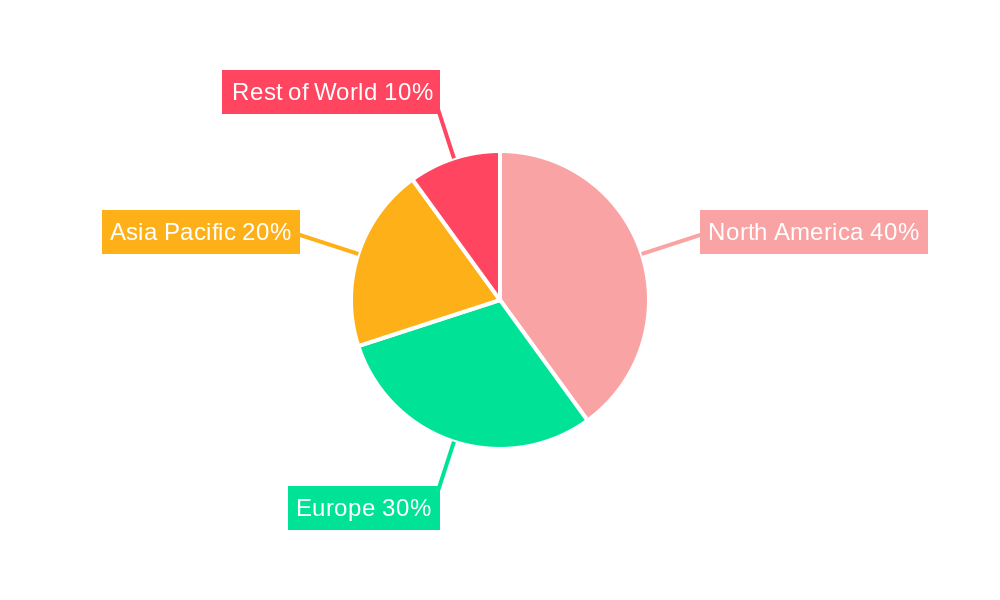
The Capecitabine market is geographically diverse, with significant presence in North America and Europe. However, the fastest growth is projected in emerging markets such as Asia-Pacific due to a large patient population, increasing healthcare spending, and rising cancer prevalence rates.
- Leading Regions: North America, Europe, Asia-Pacific
- Dominant Indications: Colorectal Cancer (largest segment due to high prevalence and efficacy of Capecitabine), Breast Cancer (significant segment due to approved use and efficacy)
- Key Distribution Channels: Hospitals (largest due to established infrastructure and administration), Clinical Laboratories (growing segment due to increased outsourcing of tests)
Dominance Analysis: The dominance of North America and Europe is primarily driven by robust healthcare infrastructure, high adoption of advanced therapies, and extensive research and development activities. The rise of colorectal cancer and breast cancer cases fuels market growth across these regions. Asia-Pacific's growth is fueled by its large population base and increased investments in the healthcare sector.
Capecitabine Industry Product Innovations
Recent innovations in Capecitabine focus on improving drug delivery methods, reducing side effects, and enhancing patient compliance. This includes the exploration of novel formulations such as targeted drug delivery systems to improve therapeutic efficacy while minimizing off-target effects. The market is also witnessing a rise in combination therapies incorporating Capecitabine with other anticancer agents. These developments are shaping the competitive landscape and contributing to the overall growth of the Capecitabine industry.
Report Segmentation & Scope
This report segments the Capecitabine market by indication (Colorectal Cancer, Breast Cancer, Others) and distribution channel (Hospitals, Clinical Laboratories, Others).
By Indication: Colorectal cancer is the largest segment, driven by high prevalence rates and effective use of Capecitabine. Breast cancer represents another substantial segment, with ongoing clinical research exploring its optimal usage. The "Others" segment includes various other cancers where Capecitabine might be used, although it holds a smaller market share.
By Distribution Channel: Hospitals dominate, representing the primary route for Capecitabine administration due to the complex nature of its usage. Clinical laboratories play a secondary role but are growing in importance, particularly due to increasing use of diagnostic tests related to Capecitabine therapy. The "Others" segment represents niche distribution channels with smaller market shares. Each segment's growth projection and competitive dynamics are analyzed in detail within the report.
Key Drivers of Capecitabine Industry Growth
Several factors contribute to the growth of the Capecitabine market. The rising incidence of colorectal and breast cancers is a key driver, necessitating greater use of effective chemotherapeutic agents. Advances in drug delivery and combination therapies enhance treatment efficacy, driving market expansion. Government initiatives promoting cancer awareness and supporting cancer research contribute significantly. Furthermore, increasing healthcare spending and improved access to healthcare services in emerging economies provide further impetus to market growth.
Challenges in the Capecitabine Industry Sector
The Capecitabine industry faces challenges, including stringent regulatory approvals which impact time-to-market and development costs. Generic competition exerts downward pressure on pricing. The potential for adverse side effects, such as hand-foot syndrome, necessitates close patient monitoring and management, impacting overall treatment costs. Supply chain disruptions can also affect the availability and pricing of Capecitabine. Lastly, the emergence of novel targeted therapies and immunotherapies presents competitive pressure for the Capecitabine market share.
Leading Players in the Capecitabine Industry Market
- F Hoffmann-La Roche AG (Genentech Inc)
- Teva Pharmaceuticals Inc
- Cipla Inc
- Hikma Pharmaceuticals PLC
- Intas Pharmaceuticals Limited
- Fresenius SE & Co KGaA
- Armas Pharmaceuticals Inc
- Sun Pharmaceutical Industries Limited
- Dr Reddy's Laboratories Ltd
- Mylan N V
Key Developments in Capecitabine Industry Sector
- 2022: [Insert specific development, e.g., Launch of a new Capecitabine formulation by Company X.]
- 2021: [Insert specific development, e.g., Approval of a new indication for Capecitabine in Country Y by regulatory authority Z]
- 2020: [Insert specific development, e.g., Major M&A activity involving a Capecitabine manufacturer]
- 2019: [Insert specific development, e.g., Publication of significant clinical trial data impacting Capecitabine usage]
Strategic Capecitabine Industry Market Outlook
The Capecitabine market is poised for continued growth, driven by increasing cancer prevalence, ongoing research and development efforts, and expanding access to healthcare. Strategic opportunities exist for companies focusing on developing innovative formulations, exploring combination therapies, and targeting emerging markets. A strong focus on personalized medicine and improved drug delivery systems will shape future market dynamics. The successful navigation of regulatory hurdles and effective management of generic competition will be crucial for sustained success in this competitive landscape.
Capecitabine Industry Segmentation
-
1. Indication
- 1.1. Colorectal Cancer
- 1.2. Breast Cancer
- 1.3. Others
-
2. Distribution Channel
- 2.1. Hospitals
- 2.2. Clinical Laboratories
- 2.3. Others
Capecitabine Industry Segmentation By Geography
-
1. North America
- 1.1. United States
- 1.2. Canada
- 1.3. Mexico
-
2. Europe
- 2.1. Germany
- 2.2. United Kingdom
- 2.3. France
- 2.4. Italy
- 2.5. Spain
- 2.6. Rest of Europe
-
3. Asia Pacific
- 3.1. China
- 3.2. Japan
- 3.3. India
- 3.4. Australia
- 3.5. South Korea
- 3.6. Rest of Asia Pacific
-
4. Middle East and Africa
- 4.1. GCC
- 4.2. South Africa
- 4.3. Rest of Middle East and Africa
-
5. South America
- 5.1. Brazil
- 5.2. Argentina
- 5.3. Rest of South America
Capecitabine Industry REPORT HIGHLIGHTS
| Aspects | Details |
|---|---|
| Study Period | 2019-2033 |
| Base Year | 2024 |
| Estimated Year | 2025 |
| Forecast Period | 2025-2033 |
| Historical Period | 2019-2024 |
| Growth Rate | CAGR of 5.50% from 2019-2033 |
| Segmentation |
|
Table of Contents
- 1. Introduction
- 1.1. Research Scope
- 1.2. Market Segmentation
- 1.3. Research Methodology
- 1.4. Definitions and Assumptions
- 2. Executive Summary
- 2.1. Introduction
- 3. Market Dynamics
- 3.1. Introduction
- 3.2. Market Drivers
- 3.2.1. ; Rising Government Initiatives to Control Growing Global Cancer Burden; Increasing Incidence of Cancers Around the World
- 3.3. Market Restrains
- 3.3.1 ; Highly Expensive Products and Treatment; Rising Adoption of Substitutes like Raltitrexed
- 3.3.2 Irinotecan and Leucovorin for Adjuvant Therapy
- 3.4. Market Trends
- 3.4.1. Breast Cancer by Indication is Expected to Hold the Largest Market Share in the Global Capecitabine Market
- 4. Market Factor Analysis
- 4.1. Porters Five Forces
- 4.2. Supply/Value Chain
- 4.3. PESTEL analysis
- 4.4. Market Entropy
- 4.5. Patent/Trademark Analysis
- 5. Global Capecitabine Industry Analysis, Insights and Forecast, 2019-2031
- 5.1. Market Analysis, Insights and Forecast - by Indication
- 5.1.1. Colorectal Cancer
- 5.1.2. Breast Cancer
- 5.1.3. Others
- 5.2. Market Analysis, Insights and Forecast - by Distribution Channel
- 5.2.1. Hospitals
- 5.2.2. Clinical Laboratories
- 5.2.3. Others
- 5.3. Market Analysis, Insights and Forecast - by Region
- 5.3.1. North America
- 5.3.2. Europe
- 5.3.3. Asia Pacific
- 5.3.4. Middle East and Africa
- 5.3.5. South America
- 5.1. Market Analysis, Insights and Forecast - by Indication
- 6. North America Capecitabine Industry Analysis, Insights and Forecast, 2019-2031
- 6.1. Market Analysis, Insights and Forecast - by Indication
- 6.1.1. Colorectal Cancer
- 6.1.2. Breast Cancer
- 6.1.3. Others
- 6.2. Market Analysis, Insights and Forecast - by Distribution Channel
- 6.2.1. Hospitals
- 6.2.2. Clinical Laboratories
- 6.2.3. Others
- 6.1. Market Analysis, Insights and Forecast - by Indication
- 7. Europe Capecitabine Industry Analysis, Insights and Forecast, 2019-2031
- 7.1. Market Analysis, Insights and Forecast - by Indication
- 7.1.1. Colorectal Cancer
- 7.1.2. Breast Cancer
- 7.1.3. Others
- 7.2. Market Analysis, Insights and Forecast - by Distribution Channel
- 7.2.1. Hospitals
- 7.2.2. Clinical Laboratories
- 7.2.3. Others
- 7.1. Market Analysis, Insights and Forecast - by Indication
- 8. Asia Pacific Capecitabine Industry Analysis, Insights and Forecast, 2019-2031
- 8.1. Market Analysis, Insights and Forecast - by Indication
- 8.1.1. Colorectal Cancer
- 8.1.2. Breast Cancer
- 8.1.3. Others
- 8.2. Market Analysis, Insights and Forecast - by Distribution Channel
- 8.2.1. Hospitals
- 8.2.2. Clinical Laboratories
- 8.2.3. Others
- 8.1. Market Analysis, Insights and Forecast - by Indication
- 9. Middle East and Africa Capecitabine Industry Analysis, Insights and Forecast, 2019-2031
- 9.1. Market Analysis, Insights and Forecast - by Indication
- 9.1.1. Colorectal Cancer
- 9.1.2. Breast Cancer
- 9.1.3. Others
- 9.2. Market Analysis, Insights and Forecast - by Distribution Channel
- 9.2.1. Hospitals
- 9.2.2. Clinical Laboratories
- 9.2.3. Others
- 9.1. Market Analysis, Insights and Forecast - by Indication
- 10. South America Capecitabine Industry Analysis, Insights and Forecast, 2019-2031
- 10.1. Market Analysis, Insights and Forecast - by Indication
- 10.1.1. Colorectal Cancer
- 10.1.2. Breast Cancer
- 10.1.3. Others
- 10.2. Market Analysis, Insights and Forecast - by Distribution Channel
- 10.2.1. Hospitals
- 10.2.2. Clinical Laboratories
- 10.2.3. Others
- 10.1. Market Analysis, Insights and Forecast - by Indication
- 11. North America Capecitabine Industry Analysis, Insights and Forecast, 2019-2031
- 11.1. Market Analysis, Insights and Forecast - By Country/Sub-region
- 11.1.1 United States
- 11.1.2 Canada
- 11.1.3 Mexico
- 12. Europe Capecitabine Industry Analysis, Insights and Forecast, 2019-2031
- 12.1. Market Analysis, Insights and Forecast - By Country/Sub-region
- 12.1.1 Germany
- 12.1.2 United Kingdom
- 12.1.3 France
- 12.1.4 Italy
- 12.1.5 Spain
- 12.1.6 Rest of Europe
- 13. Asia Pacific Capecitabine Industry Analysis, Insights and Forecast, 2019-2031
- 13.1. Market Analysis, Insights and Forecast - By Country/Sub-region
- 13.1.1 China
- 13.1.2 Japan
- 13.1.3 India
- 13.1.4 Australia
- 13.1.5 South Korea
- 13.1.6 Rest of Asia Pacific
- 14. Middle East and Africa Capecitabine Industry Analysis, Insights and Forecast, 2019-2031
- 14.1. Market Analysis, Insights and Forecast - By Country/Sub-region
- 14.1.1 GCC
- 14.1.2 South Africa
- 14.1.3 Rest of Middle East and Africa
- 15. South America Capecitabine Industry Analysis, Insights and Forecast, 2019-2031
- 15.1. Market Analysis, Insights and Forecast - By Country/Sub-region
- 15.1.1 Brazil
- 15.1.2 Argentina
- 15.1.3 Rest of South America
- 16. Competitive Analysis
- 16.1. Global Market Share Analysis 2024
- 16.2. Company Profiles
- 16.2.1 F Hoffmann-La Roche AG (Genentech Inc )
- 16.2.1.1. Overview
- 16.2.1.2. Products
- 16.2.1.3. SWOT Analysis
- 16.2.1.4. Recent Developments
- 16.2.1.5. Financials (Based on Availability)
- 16.2.2 Teva Pharmaceuticals Inc
- 16.2.2.1. Overview
- 16.2.2.2. Products
- 16.2.2.3. SWOT Analysis
- 16.2.2.4. Recent Developments
- 16.2.2.5. Financials (Based on Availability)
- 16.2.3 Cipla Inc
- 16.2.3.1. Overview
- 16.2.3.2. Products
- 16.2.3.3. SWOT Analysis
- 16.2.3.4. Recent Developments
- 16.2.3.5. Financials (Based on Availability)
- 16.2.4 Hikma Pharmaceuticals PLC
- 16.2.4.1. Overview
- 16.2.4.2. Products
- 16.2.4.3. SWOT Analysis
- 16.2.4.4. Recent Developments
- 16.2.4.5. Financials (Based on Availability)
- 16.2.5 Intas Pharmaceuticals Limited
- 16.2.5.1. Overview
- 16.2.5.2. Products
- 16.2.5.3. SWOT Analysis
- 16.2.5.4. Recent Developments
- 16.2.5.5. Financials (Based on Availability)
- 16.2.6 Fresenius SE & Co KGaA
- 16.2.6.1. Overview
- 16.2.6.2. Products
- 16.2.6.3. SWOT Analysis
- 16.2.6.4. Recent Developments
- 16.2.6.5. Financials (Based on Availability)
- 16.2.7 Armas Pharmaceuticals Inc
- 16.2.7.1. Overview
- 16.2.7.2. Products
- 16.2.7.3. SWOT Analysis
- 16.2.7.4. Recent Developments
- 16.2.7.5. Financials (Based on Availability)
- 16.2.8 Sun Pharmaceutical Industries Limited
- 16.2.8.1. Overview
- 16.2.8.2. Products
- 16.2.8.3. SWOT Analysis
- 16.2.8.4. Recent Developments
- 16.2.8.5. Financials (Based on Availability)
- 16.2.9 Dr Reddy's Laboratories Ltd
- 16.2.9.1. Overview
- 16.2.9.2. Products
- 16.2.9.3. SWOT Analysis
- 16.2.9.4. Recent Developments
- 16.2.9.5. Financials (Based on Availability)
- 16.2.10 Mylan N V
- 16.2.10.1. Overview
- 16.2.10.2. Products
- 16.2.10.3. SWOT Analysis
- 16.2.10.4. Recent Developments
- 16.2.10.5. Financials (Based on Availability)
- 16.2.1 F Hoffmann-La Roche AG (Genentech Inc )
List of Figures
- Figure 1: Global Capecitabine Industry Revenue Breakdown (Million, %) by Region 2024 & 2032
- Figure 2: Global Capecitabine Industry Volume Breakdown (K Unit, %) by Region 2024 & 2032
- Figure 3: North America Capecitabine Industry Revenue (Million), by Country 2024 & 2032
- Figure 4: North America Capecitabine Industry Volume (K Unit), by Country 2024 & 2032
- Figure 5: North America Capecitabine Industry Revenue Share (%), by Country 2024 & 2032
- Figure 6: North America Capecitabine Industry Volume Share (%), by Country 2024 & 2032
- Figure 7: Europe Capecitabine Industry Revenue (Million), by Country 2024 & 2032
- Figure 8: Europe Capecitabine Industry Volume (K Unit), by Country 2024 & 2032
- Figure 9: Europe Capecitabine Industry Revenue Share (%), by Country 2024 & 2032
- Figure 10: Europe Capecitabine Industry Volume Share (%), by Country 2024 & 2032
- Figure 11: Asia Pacific Capecitabine Industry Revenue (Million), by Country 2024 & 2032
- Figure 12: Asia Pacific Capecitabine Industry Volume (K Unit), by Country 2024 & 2032
- Figure 13: Asia Pacific Capecitabine Industry Revenue Share (%), by Country 2024 & 2032
- Figure 14: Asia Pacific Capecitabine Industry Volume Share (%), by Country 2024 & 2032
- Figure 15: Middle East and Africa Capecitabine Industry Revenue (Million), by Country 2024 & 2032
- Figure 16: Middle East and Africa Capecitabine Industry Volume (K Unit), by Country 2024 & 2032
- Figure 17: Middle East and Africa Capecitabine Industry Revenue Share (%), by Country 2024 & 2032
- Figure 18: Middle East and Africa Capecitabine Industry Volume Share (%), by Country 2024 & 2032
- Figure 19: South America Capecitabine Industry Revenue (Million), by Country 2024 & 2032
- Figure 20: South America Capecitabine Industry Volume (K Unit), by Country 2024 & 2032
- Figure 21: South America Capecitabine Industry Revenue Share (%), by Country 2024 & 2032
- Figure 22: South America Capecitabine Industry Volume Share (%), by Country 2024 & 2032
- Figure 23: North America Capecitabine Industry Revenue (Million), by Indication 2024 & 2032
- Figure 24: North America Capecitabine Industry Volume (K Unit), by Indication 2024 & 2032
- Figure 25: North America Capecitabine Industry Revenue Share (%), by Indication 2024 & 2032
- Figure 26: North America Capecitabine Industry Volume Share (%), by Indication 2024 & 2032
- Figure 27: North America Capecitabine Industry Revenue (Million), by Distribution Channel 2024 & 2032
- Figure 28: North America Capecitabine Industry Volume (K Unit), by Distribution Channel 2024 & 2032
- Figure 29: North America Capecitabine Industry Revenue Share (%), by Distribution Channel 2024 & 2032
- Figure 30: North America Capecitabine Industry Volume Share (%), by Distribution Channel 2024 & 2032
- Figure 31: North America Capecitabine Industry Revenue (Million), by Country 2024 & 2032
- Figure 32: North America Capecitabine Industry Volume (K Unit), by Country 2024 & 2032
- Figure 33: North America Capecitabine Industry Revenue Share (%), by Country 2024 & 2032
- Figure 34: North America Capecitabine Industry Volume Share (%), by Country 2024 & 2032
- Figure 35: Europe Capecitabine Industry Revenue (Million), by Indication 2024 & 2032
- Figure 36: Europe Capecitabine Industry Volume (K Unit), by Indication 2024 & 2032
- Figure 37: Europe Capecitabine Industry Revenue Share (%), by Indication 2024 & 2032
- Figure 38: Europe Capecitabine Industry Volume Share (%), by Indication 2024 & 2032
- Figure 39: Europe Capecitabine Industry Revenue (Million), by Distribution Channel 2024 & 2032
- Figure 40: Europe Capecitabine Industry Volume (K Unit), by Distribution Channel 2024 & 2032
- Figure 41: Europe Capecitabine Industry Revenue Share (%), by Distribution Channel 2024 & 2032
- Figure 42: Europe Capecitabine Industry Volume Share (%), by Distribution Channel 2024 & 2032
- Figure 43: Europe Capecitabine Industry Revenue (Million), by Country 2024 & 2032
- Figure 44: Europe Capecitabine Industry Volume (K Unit), by Country 2024 & 2032
- Figure 45: Europe Capecitabine Industry Revenue Share (%), by Country 2024 & 2032
- Figure 46: Europe Capecitabine Industry Volume Share (%), by Country 2024 & 2032
- Figure 47: Asia Pacific Capecitabine Industry Revenue (Million), by Indication 2024 & 2032
- Figure 48: Asia Pacific Capecitabine Industry Volume (K Unit), by Indication 2024 & 2032
- Figure 49: Asia Pacific Capecitabine Industry Revenue Share (%), by Indication 2024 & 2032
- Figure 50: Asia Pacific Capecitabine Industry Volume Share (%), by Indication 2024 & 2032
- Figure 51: Asia Pacific Capecitabine Industry Revenue (Million), by Distribution Channel 2024 & 2032
- Figure 52: Asia Pacific Capecitabine Industry Volume (K Unit), by Distribution Channel 2024 & 2032
- Figure 53: Asia Pacific Capecitabine Industry Revenue Share (%), by Distribution Channel 2024 & 2032
- Figure 54: Asia Pacific Capecitabine Industry Volume Share (%), by Distribution Channel 2024 & 2032
- Figure 55: Asia Pacific Capecitabine Industry Revenue (Million), by Country 2024 & 2032
- Figure 56: Asia Pacific Capecitabine Industry Volume (K Unit), by Country 2024 & 2032
- Figure 57: Asia Pacific Capecitabine Industry Revenue Share (%), by Country 2024 & 2032
- Figure 58: Asia Pacific Capecitabine Industry Volume Share (%), by Country 2024 & 2032
- Figure 59: Middle East and Africa Capecitabine Industry Revenue (Million), by Indication 2024 & 2032
- Figure 60: Middle East and Africa Capecitabine Industry Volume (K Unit), by Indication 2024 & 2032
- Figure 61: Middle East and Africa Capecitabine Industry Revenue Share (%), by Indication 2024 & 2032
- Figure 62: Middle East and Africa Capecitabine Industry Volume Share (%), by Indication 2024 & 2032
- Figure 63: Middle East and Africa Capecitabine Industry Revenue (Million), by Distribution Channel 2024 & 2032
- Figure 64: Middle East and Africa Capecitabine Industry Volume (K Unit), by Distribution Channel 2024 & 2032
- Figure 65: Middle East and Africa Capecitabine Industry Revenue Share (%), by Distribution Channel 2024 & 2032
- Figure 66: Middle East and Africa Capecitabine Industry Volume Share (%), by Distribution Channel 2024 & 2032
- Figure 67: Middle East and Africa Capecitabine Industry Revenue (Million), by Country 2024 & 2032
- Figure 68: Middle East and Africa Capecitabine Industry Volume (K Unit), by Country 2024 & 2032
- Figure 69: Middle East and Africa Capecitabine Industry Revenue Share (%), by Country 2024 & 2032
- Figure 70: Middle East and Africa Capecitabine Industry Volume Share (%), by Country 2024 & 2032
- Figure 71: South America Capecitabine Industry Revenue (Million), by Indication 2024 & 2032
- Figure 72: South America Capecitabine Industry Volume (K Unit), by Indication 2024 & 2032
- Figure 73: South America Capecitabine Industry Revenue Share (%), by Indication 2024 & 2032
- Figure 74: South America Capecitabine Industry Volume Share (%), by Indication 2024 & 2032
- Figure 75: South America Capecitabine Industry Revenue (Million), by Distribution Channel 2024 & 2032
- Figure 76: South America Capecitabine Industry Volume (K Unit), by Distribution Channel 2024 & 2032
- Figure 77: South America Capecitabine Industry Revenue Share (%), by Distribution Channel 2024 & 2032
- Figure 78: South America Capecitabine Industry Volume Share (%), by Distribution Channel 2024 & 2032
- Figure 79: South America Capecitabine Industry Revenue (Million), by Country 2024 & 2032
- Figure 80: South America Capecitabine Industry Volume (K Unit), by Country 2024 & 2032
- Figure 81: South America Capecitabine Industry Revenue Share (%), by Country 2024 & 2032
- Figure 82: South America Capecitabine Industry Volume Share (%), by Country 2024 & 2032
List of Tables
- Table 1: Global Capecitabine Industry Revenue Million Forecast, by Region 2019 & 2032
- Table 2: Global Capecitabine Industry Volume K Unit Forecast, by Region 2019 & 2032
- Table 3: Global Capecitabine Industry Revenue Million Forecast, by Indication 2019 & 2032
- Table 4: Global Capecitabine Industry Volume K Unit Forecast, by Indication 2019 & 2032
- Table 5: Global Capecitabine Industry Revenue Million Forecast, by Distribution Channel 2019 & 2032
- Table 6: Global Capecitabine Industry Volume K Unit Forecast, by Distribution Channel 2019 & 2032
- Table 7: Global Capecitabine Industry Revenue Million Forecast, by Region 2019 & 2032
- Table 8: Global Capecitabine Industry Volume K Unit Forecast, by Region 2019 & 2032
- Table 9: Global Capecitabine Industry Revenue Million Forecast, by Country 2019 & 2032
- Table 10: Global Capecitabine Industry Volume K Unit Forecast, by Country 2019 & 2032
- Table 11: United States Capecitabine Industry Revenue (Million) Forecast, by Application 2019 & 2032
- Table 12: United States Capecitabine Industry Volume (K Unit) Forecast, by Application 2019 & 2032
- Table 13: Canada Capecitabine Industry Revenue (Million) Forecast, by Application 2019 & 2032
- Table 14: Canada Capecitabine Industry Volume (K Unit) Forecast, by Application 2019 & 2032
- Table 15: Mexico Capecitabine Industry Revenue (Million) Forecast, by Application 2019 & 2032
- Table 16: Mexico Capecitabine Industry Volume (K Unit) Forecast, by Application 2019 & 2032
- Table 17: Global Capecitabine Industry Revenue Million Forecast, by Country 2019 & 2032
- Table 18: Global Capecitabine Industry Volume K Unit Forecast, by Country 2019 & 2032
- Table 19: Germany Capecitabine Industry Revenue (Million) Forecast, by Application 2019 & 2032
- Table 20: Germany Capecitabine Industry Volume (K Unit) Forecast, by Application 2019 & 2032
- Table 21: United Kingdom Capecitabine Industry Revenue (Million) Forecast, by Application 2019 & 2032
- Table 22: United Kingdom Capecitabine Industry Volume (K Unit) Forecast, by Application 2019 & 2032
- Table 23: France Capecitabine Industry Revenue (Million) Forecast, by Application 2019 & 2032
- Table 24: France Capecitabine Industry Volume (K Unit) Forecast, by Application 2019 & 2032
- Table 25: Italy Capecitabine Industry Revenue (Million) Forecast, by Application 2019 & 2032
- Table 26: Italy Capecitabine Industry Volume (K Unit) Forecast, by Application 2019 & 2032
- Table 27: Spain Capecitabine Industry Revenue (Million) Forecast, by Application 2019 & 2032
- Table 28: Spain Capecitabine Industry Volume (K Unit) Forecast, by Application 2019 & 2032
- Table 29: Rest of Europe Capecitabine Industry Revenue (Million) Forecast, by Application 2019 & 2032
- Table 30: Rest of Europe Capecitabine Industry Volume (K Unit) Forecast, by Application 2019 & 2032
- Table 31: Global Capecitabine Industry Revenue Million Forecast, by Country 2019 & 2032
- Table 32: Global Capecitabine Industry Volume K Unit Forecast, by Country 2019 & 2032
- Table 33: China Capecitabine Industry Revenue (Million) Forecast, by Application 2019 & 2032
- Table 34: China Capecitabine Industry Volume (K Unit) Forecast, by Application 2019 & 2032
- Table 35: Japan Capecitabine Industry Revenue (Million) Forecast, by Application 2019 & 2032
- Table 36: Japan Capecitabine Industry Volume (K Unit) Forecast, by Application 2019 & 2032
- Table 37: India Capecitabine Industry Revenue (Million) Forecast, by Application 2019 & 2032
- Table 38: India Capecitabine Industry Volume (K Unit) Forecast, by Application 2019 & 2032
- Table 39: Australia Capecitabine Industry Revenue (Million) Forecast, by Application 2019 & 2032
- Table 40: Australia Capecitabine Industry Volume (K Unit) Forecast, by Application 2019 & 2032
- Table 41: South Korea Capecitabine Industry Revenue (Million) Forecast, by Application 2019 & 2032
- Table 42: South Korea Capecitabine Industry Volume (K Unit) Forecast, by Application 2019 & 2032
- Table 43: Rest of Asia Pacific Capecitabine Industry Revenue (Million) Forecast, by Application 2019 & 2032
- Table 44: Rest of Asia Pacific Capecitabine Industry Volume (K Unit) Forecast, by Application 2019 & 2032
- Table 45: Global Capecitabine Industry Revenue Million Forecast, by Country 2019 & 2032
- Table 46: Global Capecitabine Industry Volume K Unit Forecast, by Country 2019 & 2032
- Table 47: GCC Capecitabine Industry Revenue (Million) Forecast, by Application 2019 & 2032
- Table 48: GCC Capecitabine Industry Volume (K Unit) Forecast, by Application 2019 & 2032
- Table 49: South Africa Capecitabine Industry Revenue (Million) Forecast, by Application 2019 & 2032
- Table 50: South Africa Capecitabine Industry Volume (K Unit) Forecast, by Application 2019 & 2032
- Table 51: Rest of Middle East and Africa Capecitabine Industry Revenue (Million) Forecast, by Application 2019 & 2032
- Table 52: Rest of Middle East and Africa Capecitabine Industry Volume (K Unit) Forecast, by Application 2019 & 2032
- Table 53: Global Capecitabine Industry Revenue Million Forecast, by Country 2019 & 2032
- Table 54: Global Capecitabine Industry Volume K Unit Forecast, by Country 2019 & 2032
- Table 55: Brazil Capecitabine Industry Revenue (Million) Forecast, by Application 2019 & 2032
- Table 56: Brazil Capecitabine Industry Volume (K Unit) Forecast, by Application 2019 & 2032
- Table 57: Argentina Capecitabine Industry Revenue (Million) Forecast, by Application 2019 & 2032
- Table 58: Argentina Capecitabine Industry Volume (K Unit) Forecast, by Application 2019 & 2032
- Table 59: Rest of South America Capecitabine Industry Revenue (Million) Forecast, by Application 2019 & 2032
- Table 60: Rest of South America Capecitabine Industry Volume (K Unit) Forecast, by Application 2019 & 2032
- Table 61: Global Capecitabine Industry Revenue Million Forecast, by Indication 2019 & 2032
- Table 62: Global Capecitabine Industry Volume K Unit Forecast, by Indication 2019 & 2032
- Table 63: Global Capecitabine Industry Revenue Million Forecast, by Distribution Channel 2019 & 2032
- Table 64: Global Capecitabine Industry Volume K Unit Forecast, by Distribution Channel 2019 & 2032
- Table 65: Global Capecitabine Industry Revenue Million Forecast, by Country 2019 & 2032
- Table 66: Global Capecitabine Industry Volume K Unit Forecast, by Country 2019 & 2032
- Table 67: United States Capecitabine Industry Revenue (Million) Forecast, by Application 2019 & 2032
- Table 68: United States Capecitabine Industry Volume (K Unit) Forecast, by Application 2019 & 2032
- Table 69: Canada Capecitabine Industry Revenue (Million) Forecast, by Application 2019 & 2032
- Table 70: Canada Capecitabine Industry Volume (K Unit) Forecast, by Application 2019 & 2032
- Table 71: Mexico Capecitabine Industry Revenue (Million) Forecast, by Application 2019 & 2032
- Table 72: Mexico Capecitabine Industry Volume (K Unit) Forecast, by Application 2019 & 2032
- Table 73: Global Capecitabine Industry Revenue Million Forecast, by Indication 2019 & 2032
- Table 74: Global Capecitabine Industry Volume K Unit Forecast, by Indication 2019 & 2032
- Table 75: Global Capecitabine Industry Revenue Million Forecast, by Distribution Channel 2019 & 2032
- Table 76: Global Capecitabine Industry Volume K Unit Forecast, by Distribution Channel 2019 & 2032
- Table 77: Global Capecitabine Industry Revenue Million Forecast, by Country 2019 & 2032
- Table 78: Global Capecitabine Industry Volume K Unit Forecast, by Country 2019 & 2032
- Table 79: Germany Capecitabine Industry Revenue (Million) Forecast, by Application 2019 & 2032
- Table 80: Germany Capecitabine Industry Volume (K Unit) Forecast, by Application 2019 & 2032
- Table 81: United Kingdom Capecitabine Industry Revenue (Million) Forecast, by Application 2019 & 2032
- Table 82: United Kingdom Capecitabine Industry Volume (K Unit) Forecast, by Application 2019 & 2032
- Table 83: France Capecitabine Industry Revenue (Million) Forecast, by Application 2019 & 2032
- Table 84: France Capecitabine Industry Volume (K Unit) Forecast, by Application 2019 & 2032
- Table 85: Italy Capecitabine Industry Revenue (Million) Forecast, by Application 2019 & 2032
- Table 86: Italy Capecitabine Industry Volume (K Unit) Forecast, by Application 2019 & 2032
- Table 87: Spain Capecitabine Industry Revenue (Million) Forecast, by Application 2019 & 2032
- Table 88: Spain Capecitabine Industry Volume (K Unit) Forecast, by Application 2019 & 2032
- Table 89: Rest of Europe Capecitabine Industry Revenue (Million) Forecast, by Application 2019 & 2032
- Table 90: Rest of Europe Capecitabine Industry Volume (K Unit) Forecast, by Application 2019 & 2032
- Table 91: Global Capecitabine Industry Revenue Million Forecast, by Indication 2019 & 2032
- Table 92: Global Capecitabine Industry Volume K Unit Forecast, by Indication 2019 & 2032
- Table 93: Global Capecitabine Industry Revenue Million Forecast, by Distribution Channel 2019 & 2032
- Table 94: Global Capecitabine Industry Volume K Unit Forecast, by Distribution Channel 2019 & 2032
- Table 95: Global Capecitabine Industry Revenue Million Forecast, by Country 2019 & 2032
- Table 96: Global Capecitabine Industry Volume K Unit Forecast, by Country 2019 & 2032
- Table 97: China Capecitabine Industry Revenue (Million) Forecast, by Application 2019 & 2032
- Table 98: China Capecitabine Industry Volume (K Unit) Forecast, by Application 2019 & 2032
- Table 99: Japan Capecitabine Industry Revenue (Million) Forecast, by Application 2019 & 2032
- Table 100: Japan Capecitabine Industry Volume (K Unit) Forecast, by Application 2019 & 2032
- Table 101: India Capecitabine Industry Revenue (Million) Forecast, by Application 2019 & 2032
- Table 102: India Capecitabine Industry Volume (K Unit) Forecast, by Application 2019 & 2032
- Table 103: Australia Capecitabine Industry Revenue (Million) Forecast, by Application 2019 & 2032
- Table 104: Australia Capecitabine Industry Volume (K Unit) Forecast, by Application 2019 & 2032
- Table 105: South Korea Capecitabine Industry Revenue (Million) Forecast, by Application 2019 & 2032
- Table 106: South Korea Capecitabine Industry Volume (K Unit) Forecast, by Application 2019 & 2032
- Table 107: Rest of Asia Pacific Capecitabine Industry Revenue (Million) Forecast, by Application 2019 & 2032
- Table 108: Rest of Asia Pacific Capecitabine Industry Volume (K Unit) Forecast, by Application 2019 & 2032
- Table 109: Global Capecitabine Industry Revenue Million Forecast, by Indication 2019 & 2032
- Table 110: Global Capecitabine Industry Volume K Unit Forecast, by Indication 2019 & 2032
- Table 111: Global Capecitabine Industry Revenue Million Forecast, by Distribution Channel 2019 & 2032
- Table 112: Global Capecitabine Industry Volume K Unit Forecast, by Distribution Channel 2019 & 2032
- Table 113: Global Capecitabine Industry Revenue Million Forecast, by Country 2019 & 2032
- Table 114: Global Capecitabine Industry Volume K Unit Forecast, by Country 2019 & 2032
- Table 115: GCC Capecitabine Industry Revenue (Million) Forecast, by Application 2019 & 2032
- Table 116: GCC Capecitabine Industry Volume (K Unit) Forecast, by Application 2019 & 2032
- Table 117: South Africa Capecitabine Industry Revenue (Million) Forecast, by Application 2019 & 2032
- Table 118: South Africa Capecitabine Industry Volume (K Unit) Forecast, by Application 2019 & 2032
- Table 119: Rest of Middle East and Africa Capecitabine Industry Revenue (Million) Forecast, by Application 2019 & 2032
- Table 120: Rest of Middle East and Africa Capecitabine Industry Volume (K Unit) Forecast, by Application 2019 & 2032
- Table 121: Global Capecitabine Industry Revenue Million Forecast, by Indication 2019 & 2032
- Table 122: Global Capecitabine Industry Volume K Unit Forecast, by Indication 2019 & 2032
- Table 123: Global Capecitabine Industry Revenue Million Forecast, by Distribution Channel 2019 & 2032
- Table 124: Global Capecitabine Industry Volume K Unit Forecast, by Distribution Channel 2019 & 2032
- Table 125: Global Capecitabine Industry Revenue Million Forecast, by Country 2019 & 2032
- Table 126: Global Capecitabine Industry Volume K Unit Forecast, by Country 2019 & 2032
- Table 127: Brazil Capecitabine Industry Revenue (Million) Forecast, by Application 2019 & 2032
- Table 128: Brazil Capecitabine Industry Volume (K Unit) Forecast, by Application 2019 & 2032
- Table 129: Argentina Capecitabine Industry Revenue (Million) Forecast, by Application 2019 & 2032
- Table 130: Argentina Capecitabine Industry Volume (K Unit) Forecast, by Application 2019 & 2032
- Table 131: Rest of South America Capecitabine Industry Revenue (Million) Forecast, by Application 2019 & 2032
- Table 132: Rest of South America Capecitabine Industry Volume (K Unit) Forecast, by Application 2019 & 2032
Frequently Asked Questions
1. What is the projected Compound Annual Growth Rate (CAGR) of the Capecitabine Industry?
The projected CAGR is approximately 5.50%.
2. Which companies are prominent players in the Capecitabine Industry?
Key companies in the market include F Hoffmann-La Roche AG (Genentech Inc ), Teva Pharmaceuticals Inc, Cipla Inc, Hikma Pharmaceuticals PLC, Intas Pharmaceuticals Limited, Fresenius SE & Co KGaA, Armas Pharmaceuticals Inc, Sun Pharmaceutical Industries Limited, Dr Reddy's Laboratories Ltd, Mylan N V.
3. What are the main segments of the Capecitabine Industry?
The market segments include Indication, Distribution Channel.
4. Can you provide details about the market size?
The market size is estimated to be USD XX Million as of 2022.
5. What are some drivers contributing to market growth?
; Rising Government Initiatives to Control Growing Global Cancer Burden; Increasing Incidence of Cancers Around the World.
6. What are the notable trends driving market growth?
Breast Cancer by Indication is Expected to Hold the Largest Market Share in the Global Capecitabine Market.
7. Are there any restraints impacting market growth?
; Highly Expensive Products and Treatment; Rising Adoption of Substitutes like Raltitrexed. Irinotecan and Leucovorin for Adjuvant Therapy.
8. Can you provide examples of recent developments in the market?
N/A
9. What pricing options are available for accessing the report?
Pricing options include single-user, multi-user, and enterprise licenses priced at USD 4750, USD 5250, and USD 8750 respectively.
10. Is the market size provided in terms of value or volume?
The market size is provided in terms of value, measured in Million and volume, measured in K Unit.
11. Are there any specific market keywords associated with the report?
Yes, the market keyword associated with the report is "Capecitabine Industry," which aids in identifying and referencing the specific market segment covered.
12. How do I determine which pricing option suits my needs best?
The pricing options vary based on user requirements and access needs. Individual users may opt for single-user licenses, while businesses requiring broader access may choose multi-user or enterprise licenses for cost-effective access to the report.
13. Are there any additional resources or data provided in the Capecitabine Industry report?
While the report offers comprehensive insights, it's advisable to review the specific contents or supplementary materials provided to ascertain if additional resources or data are available.
14. How can I stay updated on further developments or reports in the Capecitabine Industry?
To stay informed about further developments, trends, and reports in the Capecitabine Industry, consider subscribing to industry newsletters, following relevant companies and organizations, or regularly checking reputable industry news sources and publications.
Methodology
Step 1 - Identification of Relevant Samples Size from Population Database


Step 2 - Approaches for Defining Global Market Size (Value, Volume* & Price*)

Note*: In applicable scenarios
Step 3 - Data Sources
Primary Research
- Web Analytics
- Survey Reports
- Research Institute
- Latest Research Reports
- Opinion Leaders
Secondary Research
- Annual Reports
- White Paper
- Latest Press Release
- Industry Association
- Paid Database
- Investor Presentations

Step 4 - Data Triangulation
Involves using different sources of information in order to increase the validity of a study
These sources are likely to be stakeholders in a program - participants, other researchers, program staff, other community members, and so on.
Then we put all data in single framework & apply various statistical tools to find out the dynamic on the market.
During the analysis stage, feedback from the stakeholder groups would be compared to determine areas of agreement as well as areas of divergence


