
Key Insights
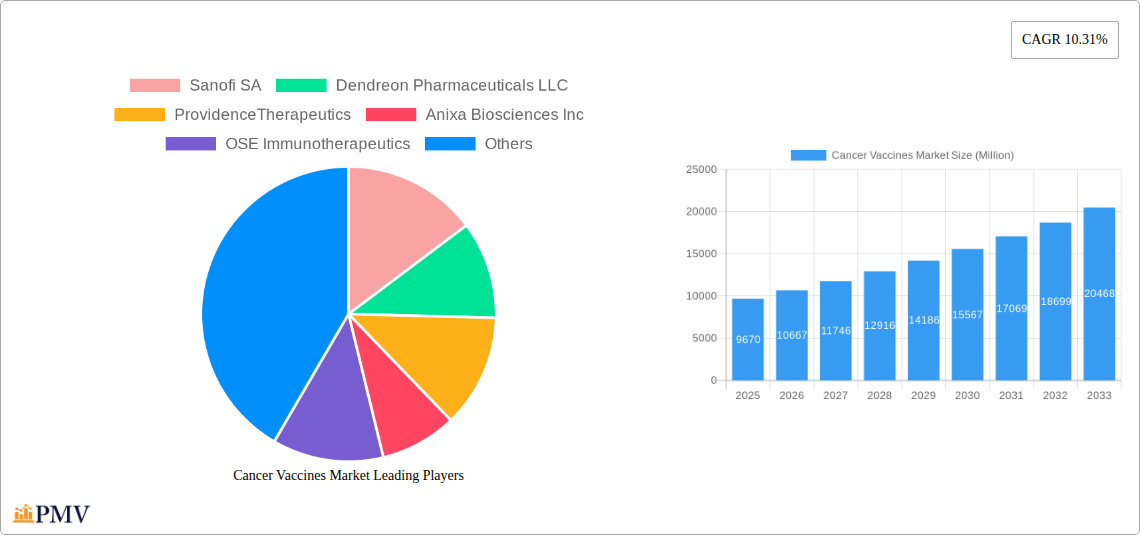
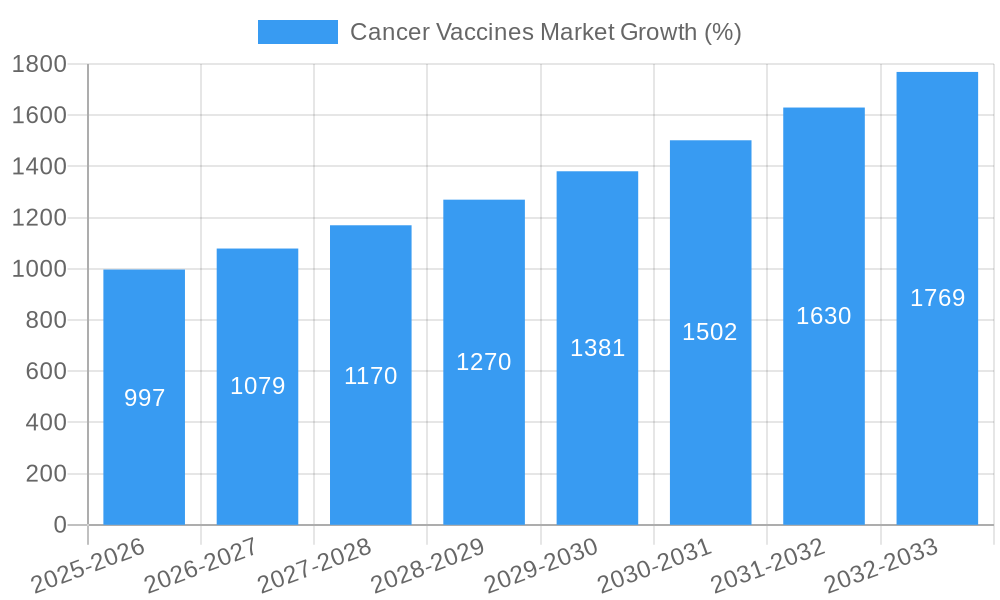
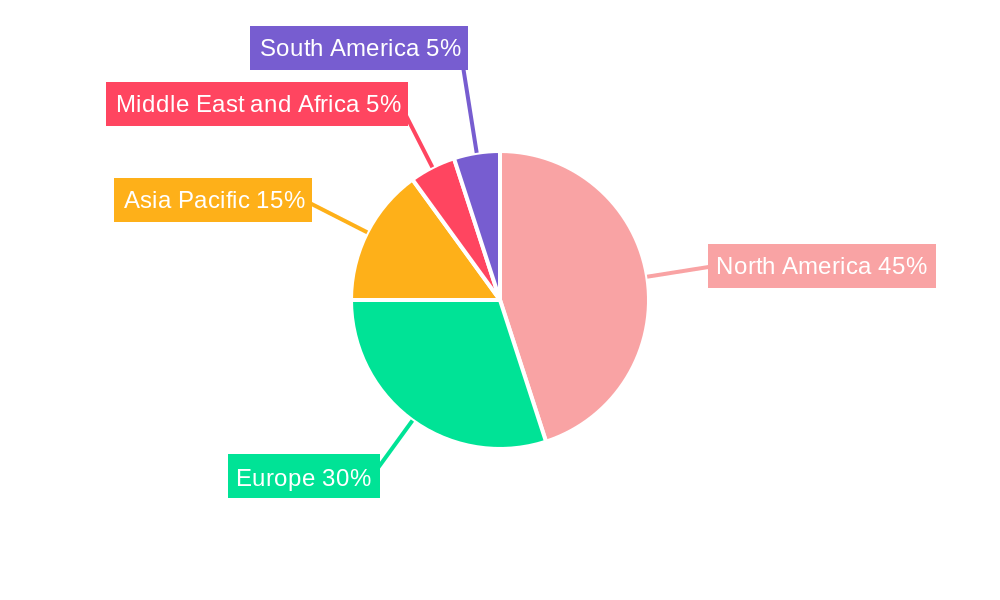
The global cancer vaccines market, valued at $9.67 billion in 2025, is projected to experience robust growth, driven by a Compound Annual Growth Rate (CAGR) of 10.31% from 2025 to 2033. This expansion is fueled by several key factors. Firstly, rising cancer incidence rates globally, coupled with increasing awareness of preventive healthcare, are bolstering demand for cancer vaccines. Advancements in vaccine technology, such as the development of more effective recombinant, whole-cell, viral vector, and DNA-based vaccines, are significantly improving efficacy and broadening treatment options. Furthermore, the growing adoption of personalized medicine approaches, tailoring vaccines to specific cancer types and individual patient characteristics, is contributing to market growth. The therapeutic vaccine segment is anticipated to witness particularly strong growth due to its potential to enhance the effectiveness of existing cancer treatments and improve patient outcomes. Significant investments in research and development by pharmaceutical companies are also fueling innovation and market expansion. The market is segmented by technology (Recombinant, Whole-cell, Viral Vector & DNA, Other), treatment method (Preventive, Therapeutic), and application (Prostate, Cervical, Other cancers), offering diverse opportunities for players across the value chain. North America and Europe currently hold substantial market shares due to advanced healthcare infrastructure and high cancer prevalence rates, but the Asia-Pacific region is expected to show considerable growth potential in the coming years driven by increasing healthcare expenditure and rising awareness.
Competition within the cancer vaccines market is intense, with major players such as Sanofi SA, Merck & Co Inc, AstraZeneca PLC, GlaxoSmithKline PLC, and Moderna Inc actively involved in research, development, and commercialization. These companies are strategically focusing on expanding their product portfolios, securing partnerships, and undertaking clinical trials to gain a competitive edge. The market is witnessing increased collaboration between research institutions, biotech companies, and pharmaceutical giants, fostering innovation and accelerating the development of novel cancer vaccine technologies. Despite the promising outlook, challenges remain, including the high cost of vaccine development and manufacturing, rigorous regulatory approval processes, and potential side effects that need careful management. Nevertheless, the continued investment in research and the growing recognition of the potential of cancer vaccines to improve patient care are likely to propel market growth over the forecast period.
Cancer Vaccines Market: A Comprehensive Report (2019-2033)
This comprehensive report provides a detailed analysis of the global Cancer Vaccines Market, offering invaluable insights for stakeholders across the pharmaceutical and biotechnology industries. Covering the period from 2019 to 2033, with a base year of 2025 and a forecast period of 2025-2033, this report meticulously examines market structure, competitive dynamics, industry trends, dominant segments, and key players. The report quantifies market size in Millions and presents actionable strategies for growth and investment.
Cancer Vaccines Market Structure & Competitive Dynamics
The Cancer Vaccines Market is characterized by a moderately concentrated landscape, with a few major players holding significant market share, while numerous smaller companies contribute to innovation. Market concentration is expected to slightly decrease by 2033 due to increased investment in R&D and emerging therapeutic approaches. The regulatory framework varies across geographies, significantly impacting market access and commercialization strategies. The market witnesses frequent M&A activities, with deal values exceeding xx Million in the last five years. These transactions reflect the consolidation trend and the quest for enhanced market positions and diversified product pipelines. Substitute therapies, such as chemotherapy and immunotherapy, create competitive pressure, constantly demanding innovation and differentiation for cancer vaccines. End-user trends indicate a growing preference for targeted therapies with improved efficacy and reduced side effects.
- Market Concentration: Moderate, predicted to slightly decrease by 2033.
- M&A Activity: High, with deal values exceeding xx Million in the last five years.
- Regulatory Landscape: Varying across geographies, impacting market access.
- Key Competitive Dynamics: Substitute therapies and ongoing innovation.
Cancer Vaccines Market Industry Trends & Insights
The Cancer Vaccines Market exhibits robust growth, driven by increasing cancer prevalence, rising healthcare expenditure, and advancements in vaccine technologies. The Compound Annual Growth Rate (CAGR) is projected to be xx% during the forecast period (2025-2033). Technological disruptions, particularly in mRNA and viral vector technologies, are significantly boosting the efficacy and safety of cancer vaccines. Consumer preferences increasingly favor personalized medicine approaches, fueling demand for targeted cancer vaccines. Competitive dynamics are shaped by the continuous introduction of novel vaccines, strategic partnerships, and the ongoing race to secure market share. The market penetration of cancer vaccines is gradually increasing, with significant growth projected in emerging markets.
Dominant Markets & Segments in Cancer Vaccines Market
The North American region currently dominates the Cancer Vaccines Market, primarily driven by advanced healthcare infrastructure, high cancer incidence rates, and substantial R&D investment. Within technology segments, Recombinant Cancer Vaccines and Viral Vector and DNA Cancer Vaccines hold the largest market shares, propelled by their high efficacy and relatively lower safety concerns. Preventive vaccines constitute a significant segment, reflecting the growing focus on cancer prevention strategies. Prostate and Cervical cancers represent major application areas, with substantial growth anticipated in other cancers as well.
- Key Drivers of Regional Dominance (North America):
- Advanced healthcare infrastructure
- High cancer incidence rates
- Significant R&D investment
- Key Drivers of Segment Dominance (Recombinant Cancer Vaccines & Viral Vector and DNA Cancer Vaccines):
- High efficacy
- Relatively lower safety concerns
- Key Drivers of Segment Dominance (Preventive Vaccines):
- Growing focus on cancer prevention strategies
Cancer Vaccines Market Product Innovations
Recent years have witnessed significant advancements in cancer vaccine technology, including the development of mRNA vaccines, personalized neoantigen vaccines, and improved viral vector platforms. These innovations are enhancing vaccine efficacy, safety, and targeting capabilities. The market is characterized by a strong focus on developing personalized vaccines tailored to individual patient characteristics, maximizing treatment effectiveness and minimizing side effects. This trend significantly contributes to the expansion of the market and strengthens its competitive landscape.
Report Segmentation & Scope
This report segments the Cancer Vaccines Market based on technology (Recombinant Cancer Vaccines, Whole-cell Cancer Vaccines, Viral Vector and DNA Cancer Vaccines, Other Technologies), treatment method (Preventive Vaccine, Therapeutic Vaccine), and application (Prostate Cancer, Cervical Cancer, Other Applications). Each segment's growth projections, market size, and competitive dynamics are thoroughly analyzed. The market is further segmented geographically, providing a detailed understanding of regional variations in market dynamics.
Key Drivers of Cancer Vaccines Market Growth
The Cancer Vaccines Market is fueled by a confluence of factors, including increasing cancer incidence globally, technological advancements in vaccine development, growing awareness of cancer prevention and early detection, and supportive regulatory environments in key markets. Increased funding for cancer research and development further contributes to innovation and market growth.
Challenges in the Cancer Vaccines Market Sector
Significant challenges exist within the Cancer Vaccines Market. High research and development costs, complex regulatory pathways for approval, and the need to demonstrate significant clinical efficacy compared to existing treatments pose considerable hurdles. Furthermore, supply chain complexities and the need for robust cold chain management for certain vaccine types present operational challenges.
Leading Players in the Cancer Vaccines Market Market
- Sanofi SA (Sanofi SA)
- Dendreon Pharmaceuticals LLC
- Providence Therapeutics
- Anixa Biosciences Inc
- OSE Immunotherapeutics
- Merck & Co Inc (Merck & Co Inc)
- AstraZeneca PLC (AstraZeneca PLC)
- Vaccitech Limited
- F Hoffmann-La Roche AG (Genentech) (F Hoffmann-La Roche AG (Genentech))
- eTheRNA immunotherapies
- Bristol Myers Squibb Company (Bristol Myers Squibb Company)
- Moderna Inc (Moderna Inc)
- GlaxoSmithKline PLC (GlaxoSmithKline PLC)
Key Developments in Cancer Vaccines Market Sector
- September 2022: Launch of India's indigenously developed cervical cancer vaccine, "CERVAVAC," signifies a significant milestone in global cancer vaccine accessibility.
- October 2022: Anixa Biosciences' initiation of a Phase Ib clinical trial for a preventative breast cancer vaccine, funded by the U.S. Department of Defense, highlights the ongoing innovation in cancer vaccine research and development.
Strategic Cancer Vaccines Market Market Outlook
The Cancer Vaccines Market is poised for substantial growth, driven by continuous technological advancements, increasing global cancer burden, and the growing focus on personalized medicine approaches. Strategic opportunities lie in focusing on developing highly effective and safe vaccines, expanding into new therapeutic areas, and securing strategic partnerships to accelerate market penetration and commercialization efforts. The market is expected to witness continued consolidation through M&A activities, further shaping its competitive dynamics.
Cancer Vaccines Market Segmentation
-
1. Technology
- 1.1. Recombinant Cancer Vaccines
- 1.2. Whole-cell Cancer Vaccines
- 1.3. Viral Vector and DNA Cancer Vaccines
- 1.4. Other Technologies
-
2. Treatment Method
- 2.1. Preventive Vaccine
- 2.2. Therapeutic Vaccine
-
3. Application
- 3.1. Prostate Cancer
- 3.2. Cervical Cancer
- 3.3. Other Applications
Cancer Vaccines Market Segmentation By Geography
-
1. North America
- 1.1. United States
- 1.2. Canada
- 1.3. Mexico
-
2. Europe
- 2.1. Germany
- 2.2. United Kingdom
- 2.3. France
- 2.4. Italy
- 2.5. Spain
- 2.6. Rest of Europe
-
3. Asia Pacific
- 3.1. China
- 3.2. Japan
- 3.3. India
- 3.4. Australia
- 3.5. South Korea
- 3.6. Rest of Asia Pacific
-
4. Middle East and Africa
- 4.1. GCC
- 4.2. South Africa
- 4.3. Rest of Middle East and Africa
-
5. South America
- 5.1. Brazil
- 5.2. Argentina
- 5.3. Rest of South America
Cancer Vaccines Market REPORT HIGHLIGHTS
| Aspects | Details |
|---|---|
| Study Period | 2019-2033 |
| Base Year | 2024 |
| Estimated Year | 2025 |
| Forecast Period | 2025-2033 |
| Historical Period | 2019-2024 |
| Growth Rate | CAGR of 10.31% from 2019-2033 |
| Segmentation |
|
Table of Contents
- 1. Introduction
- 1.1. Research Scope
- 1.2. Market Segmentation
- 1.3. Research Methodology
- 1.4. Definitions and Assumptions
- 2. Executive Summary
- 2.1. Introduction
- 3. Market Dynamics
- 3.1. Introduction
- 3.2. Market Drivers
- 3.2.1. Growing Burden of Cancer; Rising Investments and Government Funding in the Development of Cancer Vaccines; Technological Developments in Cancer Vaccines
- 3.3. Market Restrains
- 3.3.1. Stringent Regulatory Guidelines and Longer Timelines Required for Manufacturing Process; Presence of Alternative Therapies
- 3.4. Market Trends
- 3.4.1. Recombinant Cancer Vaccines are Expected to a Hold Significant Market Share in the Cancer Vaccines Market
- 4. Market Factor Analysis
- 4.1. Porters Five Forces
- 4.2. Supply/Value Chain
- 4.3. PESTEL analysis
- 4.4. Market Entropy
- 4.5. Patent/Trademark Analysis
- 5. Global Cancer Vaccines Market Analysis, Insights and Forecast, 2019-2031
- 5.1. Market Analysis, Insights and Forecast - by Technology
- 5.1.1. Recombinant Cancer Vaccines
- 5.1.2. Whole-cell Cancer Vaccines
- 5.1.3. Viral Vector and DNA Cancer Vaccines
- 5.1.4. Other Technologies
- 5.2. Market Analysis, Insights and Forecast - by Treatment Method
- 5.2.1. Preventive Vaccine
- 5.2.2. Therapeutic Vaccine
- 5.3. Market Analysis, Insights and Forecast - by Application
- 5.3.1. Prostate Cancer
- 5.3.2. Cervical Cancer
- 5.3.3. Other Applications
- 5.4. Market Analysis, Insights and Forecast - by Region
- 5.4.1. North America
- 5.4.2. Europe
- 5.4.3. Asia Pacific
- 5.4.4. Middle East and Africa
- 5.4.5. South America
- 5.1. Market Analysis, Insights and Forecast - by Technology
- 6. North America Cancer Vaccines Market Analysis, Insights and Forecast, 2019-2031
- 6.1. Market Analysis, Insights and Forecast - by Technology
- 6.1.1. Recombinant Cancer Vaccines
- 6.1.2. Whole-cell Cancer Vaccines
- 6.1.3. Viral Vector and DNA Cancer Vaccines
- 6.1.4. Other Technologies
- 6.2. Market Analysis, Insights and Forecast - by Treatment Method
- 6.2.1. Preventive Vaccine
- 6.2.2. Therapeutic Vaccine
- 6.3. Market Analysis, Insights and Forecast - by Application
- 6.3.1. Prostate Cancer
- 6.3.2. Cervical Cancer
- 6.3.3. Other Applications
- 6.1. Market Analysis, Insights and Forecast - by Technology
- 7. Europe Cancer Vaccines Market Analysis, Insights and Forecast, 2019-2031
- 7.1. Market Analysis, Insights and Forecast - by Technology
- 7.1.1. Recombinant Cancer Vaccines
- 7.1.2. Whole-cell Cancer Vaccines
- 7.1.3. Viral Vector and DNA Cancer Vaccines
- 7.1.4. Other Technologies
- 7.2. Market Analysis, Insights and Forecast - by Treatment Method
- 7.2.1. Preventive Vaccine
- 7.2.2. Therapeutic Vaccine
- 7.3. Market Analysis, Insights and Forecast - by Application
- 7.3.1. Prostate Cancer
- 7.3.2. Cervical Cancer
- 7.3.3. Other Applications
- 7.1. Market Analysis, Insights and Forecast - by Technology
- 8. Asia Pacific Cancer Vaccines Market Analysis, Insights and Forecast, 2019-2031
- 8.1. Market Analysis, Insights and Forecast - by Technology
- 8.1.1. Recombinant Cancer Vaccines
- 8.1.2. Whole-cell Cancer Vaccines
- 8.1.3. Viral Vector and DNA Cancer Vaccines
- 8.1.4. Other Technologies
- 8.2. Market Analysis, Insights and Forecast - by Treatment Method
- 8.2.1. Preventive Vaccine
- 8.2.2. Therapeutic Vaccine
- 8.3. Market Analysis, Insights and Forecast - by Application
- 8.3.1. Prostate Cancer
- 8.3.2. Cervical Cancer
- 8.3.3. Other Applications
- 8.1. Market Analysis, Insights and Forecast - by Technology
- 9. Middle East and Africa Cancer Vaccines Market Analysis, Insights and Forecast, 2019-2031
- 9.1. Market Analysis, Insights and Forecast - by Technology
- 9.1.1. Recombinant Cancer Vaccines
- 9.1.2. Whole-cell Cancer Vaccines
- 9.1.3. Viral Vector and DNA Cancer Vaccines
- 9.1.4. Other Technologies
- 9.2. Market Analysis, Insights and Forecast - by Treatment Method
- 9.2.1. Preventive Vaccine
- 9.2.2. Therapeutic Vaccine
- 9.3. Market Analysis, Insights and Forecast - by Application
- 9.3.1. Prostate Cancer
- 9.3.2. Cervical Cancer
- 9.3.3. Other Applications
- 9.1. Market Analysis, Insights and Forecast - by Technology
- 10. South America Cancer Vaccines Market Analysis, Insights and Forecast, 2019-2031
- 10.1. Market Analysis, Insights and Forecast - by Technology
- 10.1.1. Recombinant Cancer Vaccines
- 10.1.2. Whole-cell Cancer Vaccines
- 10.1.3. Viral Vector and DNA Cancer Vaccines
- 10.1.4. Other Technologies
- 10.2. Market Analysis, Insights and Forecast - by Treatment Method
- 10.2.1. Preventive Vaccine
- 10.2.2. Therapeutic Vaccine
- 10.3. Market Analysis, Insights and Forecast - by Application
- 10.3.1. Prostate Cancer
- 10.3.2. Cervical Cancer
- 10.3.3. Other Applications
- 10.1. Market Analysis, Insights and Forecast - by Technology
- 11. North America Cancer Vaccines Market Analysis, Insights and Forecast, 2019-2031
- 11.1. Market Analysis, Insights and Forecast - By Country/Sub-region
- 11.1.1 United States
- 11.1.2 Canada
- 11.1.3 Mexico
- 12. Europe Cancer Vaccines Market Analysis, Insights and Forecast, 2019-2031
- 12.1. Market Analysis, Insights and Forecast - By Country/Sub-region
- 12.1.1 Germany
- 12.1.2 United Kingdom
- 12.1.3 France
- 12.1.4 Italy
- 12.1.5 Spain
- 12.1.6 Rest of Europe
- 13. Asia Pacific Cancer Vaccines Market Analysis, Insights and Forecast, 2019-2031
- 13.1. Market Analysis, Insights and Forecast - By Country/Sub-region
- 13.1.1 China
- 13.1.2 Japan
- 13.1.3 India
- 13.1.4 Australia
- 13.1.5 South Korea
- 13.1.6 Rest of Asia Pacific
- 14. Middle East and Africa Cancer Vaccines Market Analysis, Insights and Forecast, 2019-2031
- 14.1. Market Analysis, Insights and Forecast - By Country/Sub-region
- 14.1.1 GCC
- 14.1.2 South Africa
- 14.1.3 Rest of Middle East and Africa
- 15. South America Cancer Vaccines Market Analysis, Insights and Forecast, 2019-2031
- 15.1. Market Analysis, Insights and Forecast - By Country/Sub-region
- 15.1.1 Brazil
- 15.1.2 Argentina
- 15.1.3 Rest of South America
- 16. Competitive Analysis
- 16.1. Global Market Share Analysis 2024
- 16.2. Company Profiles
- 16.2.1 Sanofi SA
- 16.2.1.1. Overview
- 16.2.1.2. Products
- 16.2.1.3. SWOT Analysis
- 16.2.1.4. Recent Developments
- 16.2.1.5. Financials (Based on Availability)
- 16.2.2 Dendreon Pharmaceuticals LLC
- 16.2.2.1. Overview
- 16.2.2.2. Products
- 16.2.2.3. SWOT Analysis
- 16.2.2.4. Recent Developments
- 16.2.2.5. Financials (Based on Availability)
- 16.2.3 ProvidenceTherapeutics
- 16.2.3.1. Overview
- 16.2.3.2. Products
- 16.2.3.3. SWOT Analysis
- 16.2.3.4. Recent Developments
- 16.2.3.5. Financials (Based on Availability)
- 16.2.4 Anixa Biosciences Inc
- 16.2.4.1. Overview
- 16.2.4.2. Products
- 16.2.4.3. SWOT Analysis
- 16.2.4.4. Recent Developments
- 16.2.4.5. Financials (Based on Availability)
- 16.2.5 OSE Immunotherapeutics
- 16.2.5.1. Overview
- 16.2.5.2. Products
- 16.2.5.3. SWOT Analysis
- 16.2.5.4. Recent Developments
- 16.2.5.5. Financials (Based on Availability)
- 16.2.6 Merck & Co Inc
- 16.2.6.1. Overview
- 16.2.6.2. Products
- 16.2.6.3. SWOT Analysis
- 16.2.6.4. Recent Developments
- 16.2.6.5. Financials (Based on Availability)
- 16.2.7 AstraZeneca PLC
- 16.2.7.1. Overview
- 16.2.7.2. Products
- 16.2.7.3. SWOT Analysis
- 16.2.7.4. Recent Developments
- 16.2.7.5. Financials (Based on Availability)
- 16.2.8 Vaccitech Limited
- 16.2.8.1. Overview
- 16.2.8.2. Products
- 16.2.8.3. SWOT Analysis
- 16.2.8.4. Recent Developments
- 16.2.8.5. Financials (Based on Availability)
- 16.2.9 F Hoffmann-La Roche AG (Genentech)
- 16.2.9.1. Overview
- 16.2.9.2. Products
- 16.2.9.3. SWOT Analysis
- 16.2.9.4. Recent Developments
- 16.2.9.5. Financials (Based on Availability)
- 16.2.10 eTheRNA immunotherapies
- 16.2.10.1. Overview
- 16.2.10.2. Products
- 16.2.10.3. SWOT Analysis
- 16.2.10.4. Recent Developments
- 16.2.10.5. Financials (Based on Availability)
- 16.2.11 Bristol Myers Squibb Company
- 16.2.11.1. Overview
- 16.2.11.2. Products
- 16.2.11.3. SWOT Analysis
- 16.2.11.4. Recent Developments
- 16.2.11.5. Financials (Based on Availability)
- 16.2.12 Moderna Inc
- 16.2.12.1. Overview
- 16.2.12.2. Products
- 16.2.12.3. SWOT Analysis
- 16.2.12.4. Recent Developments
- 16.2.12.5. Financials (Based on Availability)
- 16.2.13 GlaxoSmithKline PLC
- 16.2.13.1. Overview
- 16.2.13.2. Products
- 16.2.13.3. SWOT Analysis
- 16.2.13.4. Recent Developments
- 16.2.13.5. Financials (Based on Availability)
- 16.2.1 Sanofi SA
List of Figures
- Figure 1: Global Cancer Vaccines Market Revenue Breakdown (Million, %) by Region 2024 & 2032
- Figure 2: Global Cancer Vaccines Market Volume Breakdown (K Unit, %) by Region 2024 & 2032
- Figure 3: North America Cancer Vaccines Market Revenue (Million), by Country 2024 & 2032
- Figure 4: North America Cancer Vaccines Market Volume (K Unit), by Country 2024 & 2032
- Figure 5: North America Cancer Vaccines Market Revenue Share (%), by Country 2024 & 2032
- Figure 6: North America Cancer Vaccines Market Volume Share (%), by Country 2024 & 2032
- Figure 7: Europe Cancer Vaccines Market Revenue (Million), by Country 2024 & 2032
- Figure 8: Europe Cancer Vaccines Market Volume (K Unit), by Country 2024 & 2032
- Figure 9: Europe Cancer Vaccines Market Revenue Share (%), by Country 2024 & 2032
- Figure 10: Europe Cancer Vaccines Market Volume Share (%), by Country 2024 & 2032
- Figure 11: Asia Pacific Cancer Vaccines Market Revenue (Million), by Country 2024 & 2032
- Figure 12: Asia Pacific Cancer Vaccines Market Volume (K Unit), by Country 2024 & 2032
- Figure 13: Asia Pacific Cancer Vaccines Market Revenue Share (%), by Country 2024 & 2032
- Figure 14: Asia Pacific Cancer Vaccines Market Volume Share (%), by Country 2024 & 2032
- Figure 15: Middle East and Africa Cancer Vaccines Market Revenue (Million), by Country 2024 & 2032
- Figure 16: Middle East and Africa Cancer Vaccines Market Volume (K Unit), by Country 2024 & 2032
- Figure 17: Middle East and Africa Cancer Vaccines Market Revenue Share (%), by Country 2024 & 2032
- Figure 18: Middle East and Africa Cancer Vaccines Market Volume Share (%), by Country 2024 & 2032
- Figure 19: South America Cancer Vaccines Market Revenue (Million), by Country 2024 & 2032
- Figure 20: South America Cancer Vaccines Market Volume (K Unit), by Country 2024 & 2032
- Figure 21: South America Cancer Vaccines Market Revenue Share (%), by Country 2024 & 2032
- Figure 22: South America Cancer Vaccines Market Volume Share (%), by Country 2024 & 2032
- Figure 23: North America Cancer Vaccines Market Revenue (Million), by Technology 2024 & 2032
- Figure 24: North America Cancer Vaccines Market Volume (K Unit), by Technology 2024 & 2032
- Figure 25: North America Cancer Vaccines Market Revenue Share (%), by Technology 2024 & 2032
- Figure 26: North America Cancer Vaccines Market Volume Share (%), by Technology 2024 & 2032
- Figure 27: North America Cancer Vaccines Market Revenue (Million), by Treatment Method 2024 & 2032
- Figure 28: North America Cancer Vaccines Market Volume (K Unit), by Treatment Method 2024 & 2032
- Figure 29: North America Cancer Vaccines Market Revenue Share (%), by Treatment Method 2024 & 2032
- Figure 30: North America Cancer Vaccines Market Volume Share (%), by Treatment Method 2024 & 2032
- Figure 31: North America Cancer Vaccines Market Revenue (Million), by Application 2024 & 2032
- Figure 32: North America Cancer Vaccines Market Volume (K Unit), by Application 2024 & 2032
- Figure 33: North America Cancer Vaccines Market Revenue Share (%), by Application 2024 & 2032
- Figure 34: North America Cancer Vaccines Market Volume Share (%), by Application 2024 & 2032
- Figure 35: North America Cancer Vaccines Market Revenue (Million), by Country 2024 & 2032
- Figure 36: North America Cancer Vaccines Market Volume (K Unit), by Country 2024 & 2032
- Figure 37: North America Cancer Vaccines Market Revenue Share (%), by Country 2024 & 2032
- Figure 38: North America Cancer Vaccines Market Volume Share (%), by Country 2024 & 2032
- Figure 39: Europe Cancer Vaccines Market Revenue (Million), by Technology 2024 & 2032
- Figure 40: Europe Cancer Vaccines Market Volume (K Unit), by Technology 2024 & 2032
- Figure 41: Europe Cancer Vaccines Market Revenue Share (%), by Technology 2024 & 2032
- Figure 42: Europe Cancer Vaccines Market Volume Share (%), by Technology 2024 & 2032
- Figure 43: Europe Cancer Vaccines Market Revenue (Million), by Treatment Method 2024 & 2032
- Figure 44: Europe Cancer Vaccines Market Volume (K Unit), by Treatment Method 2024 & 2032
- Figure 45: Europe Cancer Vaccines Market Revenue Share (%), by Treatment Method 2024 & 2032
- Figure 46: Europe Cancer Vaccines Market Volume Share (%), by Treatment Method 2024 & 2032
- Figure 47: Europe Cancer Vaccines Market Revenue (Million), by Application 2024 & 2032
- Figure 48: Europe Cancer Vaccines Market Volume (K Unit), by Application 2024 & 2032
- Figure 49: Europe Cancer Vaccines Market Revenue Share (%), by Application 2024 & 2032
- Figure 50: Europe Cancer Vaccines Market Volume Share (%), by Application 2024 & 2032
- Figure 51: Europe Cancer Vaccines Market Revenue (Million), by Country 2024 & 2032
- Figure 52: Europe Cancer Vaccines Market Volume (K Unit), by Country 2024 & 2032
- Figure 53: Europe Cancer Vaccines Market Revenue Share (%), by Country 2024 & 2032
- Figure 54: Europe Cancer Vaccines Market Volume Share (%), by Country 2024 & 2032
- Figure 55: Asia Pacific Cancer Vaccines Market Revenue (Million), by Technology 2024 & 2032
- Figure 56: Asia Pacific Cancer Vaccines Market Volume (K Unit), by Technology 2024 & 2032
- Figure 57: Asia Pacific Cancer Vaccines Market Revenue Share (%), by Technology 2024 & 2032
- Figure 58: Asia Pacific Cancer Vaccines Market Volume Share (%), by Technology 2024 & 2032
- Figure 59: Asia Pacific Cancer Vaccines Market Revenue (Million), by Treatment Method 2024 & 2032
- Figure 60: Asia Pacific Cancer Vaccines Market Volume (K Unit), by Treatment Method 2024 & 2032
- Figure 61: Asia Pacific Cancer Vaccines Market Revenue Share (%), by Treatment Method 2024 & 2032
- Figure 62: Asia Pacific Cancer Vaccines Market Volume Share (%), by Treatment Method 2024 & 2032
- Figure 63: Asia Pacific Cancer Vaccines Market Revenue (Million), by Application 2024 & 2032
- Figure 64: Asia Pacific Cancer Vaccines Market Volume (K Unit), by Application 2024 & 2032
- Figure 65: Asia Pacific Cancer Vaccines Market Revenue Share (%), by Application 2024 & 2032
- Figure 66: Asia Pacific Cancer Vaccines Market Volume Share (%), by Application 2024 & 2032
- Figure 67: Asia Pacific Cancer Vaccines Market Revenue (Million), by Country 2024 & 2032
- Figure 68: Asia Pacific Cancer Vaccines Market Volume (K Unit), by Country 2024 & 2032
- Figure 69: Asia Pacific Cancer Vaccines Market Revenue Share (%), by Country 2024 & 2032
- Figure 70: Asia Pacific Cancer Vaccines Market Volume Share (%), by Country 2024 & 2032
- Figure 71: Middle East and Africa Cancer Vaccines Market Revenue (Million), by Technology 2024 & 2032
- Figure 72: Middle East and Africa Cancer Vaccines Market Volume (K Unit), by Technology 2024 & 2032
- Figure 73: Middle East and Africa Cancer Vaccines Market Revenue Share (%), by Technology 2024 & 2032
- Figure 74: Middle East and Africa Cancer Vaccines Market Volume Share (%), by Technology 2024 & 2032
- Figure 75: Middle East and Africa Cancer Vaccines Market Revenue (Million), by Treatment Method 2024 & 2032
- Figure 76: Middle East and Africa Cancer Vaccines Market Volume (K Unit), by Treatment Method 2024 & 2032
- Figure 77: Middle East and Africa Cancer Vaccines Market Revenue Share (%), by Treatment Method 2024 & 2032
- Figure 78: Middle East and Africa Cancer Vaccines Market Volume Share (%), by Treatment Method 2024 & 2032
- Figure 79: Middle East and Africa Cancer Vaccines Market Revenue (Million), by Application 2024 & 2032
- Figure 80: Middle East and Africa Cancer Vaccines Market Volume (K Unit), by Application 2024 & 2032
- Figure 81: Middle East and Africa Cancer Vaccines Market Revenue Share (%), by Application 2024 & 2032
- Figure 82: Middle East and Africa Cancer Vaccines Market Volume Share (%), by Application 2024 & 2032
- Figure 83: Middle East and Africa Cancer Vaccines Market Revenue (Million), by Country 2024 & 2032
- Figure 84: Middle East and Africa Cancer Vaccines Market Volume (K Unit), by Country 2024 & 2032
- Figure 85: Middle East and Africa Cancer Vaccines Market Revenue Share (%), by Country 2024 & 2032
- Figure 86: Middle East and Africa Cancer Vaccines Market Volume Share (%), by Country 2024 & 2032
- Figure 87: South America Cancer Vaccines Market Revenue (Million), by Technology 2024 & 2032
- Figure 88: South America Cancer Vaccines Market Volume (K Unit), by Technology 2024 & 2032
- Figure 89: South America Cancer Vaccines Market Revenue Share (%), by Technology 2024 & 2032
- Figure 90: South America Cancer Vaccines Market Volume Share (%), by Technology 2024 & 2032
- Figure 91: South America Cancer Vaccines Market Revenue (Million), by Treatment Method 2024 & 2032
- Figure 92: South America Cancer Vaccines Market Volume (K Unit), by Treatment Method 2024 & 2032
- Figure 93: South America Cancer Vaccines Market Revenue Share (%), by Treatment Method 2024 & 2032
- Figure 94: South America Cancer Vaccines Market Volume Share (%), by Treatment Method 2024 & 2032
- Figure 95: South America Cancer Vaccines Market Revenue (Million), by Application 2024 & 2032
- Figure 96: South America Cancer Vaccines Market Volume (K Unit), by Application 2024 & 2032
- Figure 97: South America Cancer Vaccines Market Revenue Share (%), by Application 2024 & 2032
- Figure 98: South America Cancer Vaccines Market Volume Share (%), by Application 2024 & 2032
- Figure 99: South America Cancer Vaccines Market Revenue (Million), by Country 2024 & 2032
- Figure 100: South America Cancer Vaccines Market Volume (K Unit), by Country 2024 & 2032
- Figure 101: South America Cancer Vaccines Market Revenue Share (%), by Country 2024 & 2032
- Figure 102: South America Cancer Vaccines Market Volume Share (%), by Country 2024 & 2032
List of Tables
- Table 1: Global Cancer Vaccines Market Revenue Million Forecast, by Region 2019 & 2032
- Table 2: Global Cancer Vaccines Market Volume K Unit Forecast, by Region 2019 & 2032
- Table 3: Global Cancer Vaccines Market Revenue Million Forecast, by Technology 2019 & 2032
- Table 4: Global Cancer Vaccines Market Volume K Unit Forecast, by Technology 2019 & 2032
- Table 5: Global Cancer Vaccines Market Revenue Million Forecast, by Treatment Method 2019 & 2032
- Table 6: Global Cancer Vaccines Market Volume K Unit Forecast, by Treatment Method 2019 & 2032
- Table 7: Global Cancer Vaccines Market Revenue Million Forecast, by Application 2019 & 2032
- Table 8: Global Cancer Vaccines Market Volume K Unit Forecast, by Application 2019 & 2032
- Table 9: Global Cancer Vaccines Market Revenue Million Forecast, by Region 2019 & 2032
- Table 10: Global Cancer Vaccines Market Volume K Unit Forecast, by Region 2019 & 2032
- Table 11: Global Cancer Vaccines Market Revenue Million Forecast, by Country 2019 & 2032
- Table 12: Global Cancer Vaccines Market Volume K Unit Forecast, by Country 2019 & 2032
- Table 13: United States Cancer Vaccines Market Revenue (Million) Forecast, by Application 2019 & 2032
- Table 14: United States Cancer Vaccines Market Volume (K Unit) Forecast, by Application 2019 & 2032
- Table 15: Canada Cancer Vaccines Market Revenue (Million) Forecast, by Application 2019 & 2032
- Table 16: Canada Cancer Vaccines Market Volume (K Unit) Forecast, by Application 2019 & 2032
- Table 17: Mexico Cancer Vaccines Market Revenue (Million) Forecast, by Application 2019 & 2032
- Table 18: Mexico Cancer Vaccines Market Volume (K Unit) Forecast, by Application 2019 & 2032
- Table 19: Global Cancer Vaccines Market Revenue Million Forecast, by Country 2019 & 2032
- Table 20: Global Cancer Vaccines Market Volume K Unit Forecast, by Country 2019 & 2032
- Table 21: Germany Cancer Vaccines Market Revenue (Million) Forecast, by Application 2019 & 2032
- Table 22: Germany Cancer Vaccines Market Volume (K Unit) Forecast, by Application 2019 & 2032
- Table 23: United Kingdom Cancer Vaccines Market Revenue (Million) Forecast, by Application 2019 & 2032
- Table 24: United Kingdom Cancer Vaccines Market Volume (K Unit) Forecast, by Application 2019 & 2032
- Table 25: France Cancer Vaccines Market Revenue (Million) Forecast, by Application 2019 & 2032
- Table 26: France Cancer Vaccines Market Volume (K Unit) Forecast, by Application 2019 & 2032
- Table 27: Italy Cancer Vaccines Market Revenue (Million) Forecast, by Application 2019 & 2032
- Table 28: Italy Cancer Vaccines Market Volume (K Unit) Forecast, by Application 2019 & 2032
- Table 29: Spain Cancer Vaccines Market Revenue (Million) Forecast, by Application 2019 & 2032
- Table 30: Spain Cancer Vaccines Market Volume (K Unit) Forecast, by Application 2019 & 2032
- Table 31: Rest of Europe Cancer Vaccines Market Revenue (Million) Forecast, by Application 2019 & 2032
- Table 32: Rest of Europe Cancer Vaccines Market Volume (K Unit) Forecast, by Application 2019 & 2032
- Table 33: Global Cancer Vaccines Market Revenue Million Forecast, by Country 2019 & 2032
- Table 34: Global Cancer Vaccines Market Volume K Unit Forecast, by Country 2019 & 2032
- Table 35: China Cancer Vaccines Market Revenue (Million) Forecast, by Application 2019 & 2032
- Table 36: China Cancer Vaccines Market Volume (K Unit) Forecast, by Application 2019 & 2032
- Table 37: Japan Cancer Vaccines Market Revenue (Million) Forecast, by Application 2019 & 2032
- Table 38: Japan Cancer Vaccines Market Volume (K Unit) Forecast, by Application 2019 & 2032
- Table 39: India Cancer Vaccines Market Revenue (Million) Forecast, by Application 2019 & 2032
- Table 40: India Cancer Vaccines Market Volume (K Unit) Forecast, by Application 2019 & 2032
- Table 41: Australia Cancer Vaccines Market Revenue (Million) Forecast, by Application 2019 & 2032
- Table 42: Australia Cancer Vaccines Market Volume (K Unit) Forecast, by Application 2019 & 2032
- Table 43: South Korea Cancer Vaccines Market Revenue (Million) Forecast, by Application 2019 & 2032
- Table 44: South Korea Cancer Vaccines Market Volume (K Unit) Forecast, by Application 2019 & 2032
- Table 45: Rest of Asia Pacific Cancer Vaccines Market Revenue (Million) Forecast, by Application 2019 & 2032
- Table 46: Rest of Asia Pacific Cancer Vaccines Market Volume (K Unit) Forecast, by Application 2019 & 2032
- Table 47: Global Cancer Vaccines Market Revenue Million Forecast, by Country 2019 & 2032
- Table 48: Global Cancer Vaccines Market Volume K Unit Forecast, by Country 2019 & 2032
- Table 49: GCC Cancer Vaccines Market Revenue (Million) Forecast, by Application 2019 & 2032
- Table 50: GCC Cancer Vaccines Market Volume (K Unit) Forecast, by Application 2019 & 2032
- Table 51: South Africa Cancer Vaccines Market Revenue (Million) Forecast, by Application 2019 & 2032
- Table 52: South Africa Cancer Vaccines Market Volume (K Unit) Forecast, by Application 2019 & 2032
- Table 53: Rest of Middle East and Africa Cancer Vaccines Market Revenue (Million) Forecast, by Application 2019 & 2032
- Table 54: Rest of Middle East and Africa Cancer Vaccines Market Volume (K Unit) Forecast, by Application 2019 & 2032
- Table 55: Global Cancer Vaccines Market Revenue Million Forecast, by Country 2019 & 2032
- Table 56: Global Cancer Vaccines Market Volume K Unit Forecast, by Country 2019 & 2032
- Table 57: Brazil Cancer Vaccines Market Revenue (Million) Forecast, by Application 2019 & 2032
- Table 58: Brazil Cancer Vaccines Market Volume (K Unit) Forecast, by Application 2019 & 2032
- Table 59: Argentina Cancer Vaccines Market Revenue (Million) Forecast, by Application 2019 & 2032
- Table 60: Argentina Cancer Vaccines Market Volume (K Unit) Forecast, by Application 2019 & 2032
- Table 61: Rest of South America Cancer Vaccines Market Revenue (Million) Forecast, by Application 2019 & 2032
- Table 62: Rest of South America Cancer Vaccines Market Volume (K Unit) Forecast, by Application 2019 & 2032
- Table 63: Global Cancer Vaccines Market Revenue Million Forecast, by Technology 2019 & 2032
- Table 64: Global Cancer Vaccines Market Volume K Unit Forecast, by Technology 2019 & 2032
- Table 65: Global Cancer Vaccines Market Revenue Million Forecast, by Treatment Method 2019 & 2032
- Table 66: Global Cancer Vaccines Market Volume K Unit Forecast, by Treatment Method 2019 & 2032
- Table 67: Global Cancer Vaccines Market Revenue Million Forecast, by Application 2019 & 2032
- Table 68: Global Cancer Vaccines Market Volume K Unit Forecast, by Application 2019 & 2032
- Table 69: Global Cancer Vaccines Market Revenue Million Forecast, by Country 2019 & 2032
- Table 70: Global Cancer Vaccines Market Volume K Unit Forecast, by Country 2019 & 2032
- Table 71: United States Cancer Vaccines Market Revenue (Million) Forecast, by Application 2019 & 2032
- Table 72: United States Cancer Vaccines Market Volume (K Unit) Forecast, by Application 2019 & 2032
- Table 73: Canada Cancer Vaccines Market Revenue (Million) Forecast, by Application 2019 & 2032
- Table 74: Canada Cancer Vaccines Market Volume (K Unit) Forecast, by Application 2019 & 2032
- Table 75: Mexico Cancer Vaccines Market Revenue (Million) Forecast, by Application 2019 & 2032
- Table 76: Mexico Cancer Vaccines Market Volume (K Unit) Forecast, by Application 2019 & 2032
- Table 77: Global Cancer Vaccines Market Revenue Million Forecast, by Technology 2019 & 2032
- Table 78: Global Cancer Vaccines Market Volume K Unit Forecast, by Technology 2019 & 2032
- Table 79: Global Cancer Vaccines Market Revenue Million Forecast, by Treatment Method 2019 & 2032
- Table 80: Global Cancer Vaccines Market Volume K Unit Forecast, by Treatment Method 2019 & 2032
- Table 81: Global Cancer Vaccines Market Revenue Million Forecast, by Application 2019 & 2032
- Table 82: Global Cancer Vaccines Market Volume K Unit Forecast, by Application 2019 & 2032
- Table 83: Global Cancer Vaccines Market Revenue Million Forecast, by Country 2019 & 2032
- Table 84: Global Cancer Vaccines Market Volume K Unit Forecast, by Country 2019 & 2032
- Table 85: Germany Cancer Vaccines Market Revenue (Million) Forecast, by Application 2019 & 2032
- Table 86: Germany Cancer Vaccines Market Volume (K Unit) Forecast, by Application 2019 & 2032
- Table 87: United Kingdom Cancer Vaccines Market Revenue (Million) Forecast, by Application 2019 & 2032
- Table 88: United Kingdom Cancer Vaccines Market Volume (K Unit) Forecast, by Application 2019 & 2032
- Table 89: France Cancer Vaccines Market Revenue (Million) Forecast, by Application 2019 & 2032
- Table 90: France Cancer Vaccines Market Volume (K Unit) Forecast, by Application 2019 & 2032
- Table 91: Italy Cancer Vaccines Market Revenue (Million) Forecast, by Application 2019 & 2032
- Table 92: Italy Cancer Vaccines Market Volume (K Unit) Forecast, by Application 2019 & 2032
- Table 93: Spain Cancer Vaccines Market Revenue (Million) Forecast, by Application 2019 & 2032
- Table 94: Spain Cancer Vaccines Market Volume (K Unit) Forecast, by Application 2019 & 2032
- Table 95: Rest of Europe Cancer Vaccines Market Revenue (Million) Forecast, by Application 2019 & 2032
- Table 96: Rest of Europe Cancer Vaccines Market Volume (K Unit) Forecast, by Application 2019 & 2032
- Table 97: Global Cancer Vaccines Market Revenue Million Forecast, by Technology 2019 & 2032
- Table 98: Global Cancer Vaccines Market Volume K Unit Forecast, by Technology 2019 & 2032
- Table 99: Global Cancer Vaccines Market Revenue Million Forecast, by Treatment Method 2019 & 2032
- Table 100: Global Cancer Vaccines Market Volume K Unit Forecast, by Treatment Method 2019 & 2032
- Table 101: Global Cancer Vaccines Market Revenue Million Forecast, by Application 2019 & 2032
- Table 102: Global Cancer Vaccines Market Volume K Unit Forecast, by Application 2019 & 2032
- Table 103: Global Cancer Vaccines Market Revenue Million Forecast, by Country 2019 & 2032
- Table 104: Global Cancer Vaccines Market Volume K Unit Forecast, by Country 2019 & 2032
- Table 105: China Cancer Vaccines Market Revenue (Million) Forecast, by Application 2019 & 2032
- Table 106: China Cancer Vaccines Market Volume (K Unit) Forecast, by Application 2019 & 2032
- Table 107: Japan Cancer Vaccines Market Revenue (Million) Forecast, by Application 2019 & 2032
- Table 108: Japan Cancer Vaccines Market Volume (K Unit) Forecast, by Application 2019 & 2032
- Table 109: India Cancer Vaccines Market Revenue (Million) Forecast, by Application 2019 & 2032
- Table 110: India Cancer Vaccines Market Volume (K Unit) Forecast, by Application 2019 & 2032
- Table 111: Australia Cancer Vaccines Market Revenue (Million) Forecast, by Application 2019 & 2032
- Table 112: Australia Cancer Vaccines Market Volume (K Unit) Forecast, by Application 2019 & 2032
- Table 113: South Korea Cancer Vaccines Market Revenue (Million) Forecast, by Application 2019 & 2032
- Table 114: South Korea Cancer Vaccines Market Volume (K Unit) Forecast, by Application 2019 & 2032
- Table 115: Rest of Asia Pacific Cancer Vaccines Market Revenue (Million) Forecast, by Application 2019 & 2032
- Table 116: Rest of Asia Pacific Cancer Vaccines Market Volume (K Unit) Forecast, by Application 2019 & 2032
- Table 117: Global Cancer Vaccines Market Revenue Million Forecast, by Technology 2019 & 2032
- Table 118: Global Cancer Vaccines Market Volume K Unit Forecast, by Technology 2019 & 2032
- Table 119: Global Cancer Vaccines Market Revenue Million Forecast, by Treatment Method 2019 & 2032
- Table 120: Global Cancer Vaccines Market Volume K Unit Forecast, by Treatment Method 2019 & 2032
- Table 121: Global Cancer Vaccines Market Revenue Million Forecast, by Application 2019 & 2032
- Table 122: Global Cancer Vaccines Market Volume K Unit Forecast, by Application 2019 & 2032
- Table 123: Global Cancer Vaccines Market Revenue Million Forecast, by Country 2019 & 2032
- Table 124: Global Cancer Vaccines Market Volume K Unit Forecast, by Country 2019 & 2032
- Table 125: GCC Cancer Vaccines Market Revenue (Million) Forecast, by Application 2019 & 2032
- Table 126: GCC Cancer Vaccines Market Volume (K Unit) Forecast, by Application 2019 & 2032
- Table 127: South Africa Cancer Vaccines Market Revenue (Million) Forecast, by Application 2019 & 2032
- Table 128: South Africa Cancer Vaccines Market Volume (K Unit) Forecast, by Application 2019 & 2032
- Table 129: Rest of Middle East and Africa Cancer Vaccines Market Revenue (Million) Forecast, by Application 2019 & 2032
- Table 130: Rest of Middle East and Africa Cancer Vaccines Market Volume (K Unit) Forecast, by Application 2019 & 2032
- Table 131: Global Cancer Vaccines Market Revenue Million Forecast, by Technology 2019 & 2032
- Table 132: Global Cancer Vaccines Market Volume K Unit Forecast, by Technology 2019 & 2032
- Table 133: Global Cancer Vaccines Market Revenue Million Forecast, by Treatment Method 2019 & 2032
- Table 134: Global Cancer Vaccines Market Volume K Unit Forecast, by Treatment Method 2019 & 2032
- Table 135: Global Cancer Vaccines Market Revenue Million Forecast, by Application 2019 & 2032
- Table 136: Global Cancer Vaccines Market Volume K Unit Forecast, by Application 2019 & 2032
- Table 137: Global Cancer Vaccines Market Revenue Million Forecast, by Country 2019 & 2032
- Table 138: Global Cancer Vaccines Market Volume K Unit Forecast, by Country 2019 & 2032
- Table 139: Brazil Cancer Vaccines Market Revenue (Million) Forecast, by Application 2019 & 2032
- Table 140: Brazil Cancer Vaccines Market Volume (K Unit) Forecast, by Application 2019 & 2032
- Table 141: Argentina Cancer Vaccines Market Revenue (Million) Forecast, by Application 2019 & 2032
- Table 142: Argentina Cancer Vaccines Market Volume (K Unit) Forecast, by Application 2019 & 2032
- Table 143: Rest of South America Cancer Vaccines Market Revenue (Million) Forecast, by Application 2019 & 2032
- Table 144: Rest of South America Cancer Vaccines Market Volume (K Unit) Forecast, by Application 2019 & 2032
Frequently Asked Questions
1. What is the projected Compound Annual Growth Rate (CAGR) of the Cancer Vaccines Market?
The projected CAGR is approximately 10.31%.
2. Which companies are prominent players in the Cancer Vaccines Market?
Key companies in the market include Sanofi SA, Dendreon Pharmaceuticals LLC, ProvidenceTherapeutics, Anixa Biosciences Inc, OSE Immunotherapeutics, Merck & Co Inc, AstraZeneca PLC, Vaccitech Limited, F Hoffmann-La Roche AG (Genentech), eTheRNA immunotherapies, Bristol Myers Squibb Company, Moderna Inc, GlaxoSmithKline PLC.
3. What are the main segments of the Cancer Vaccines Market?
The market segments include Technology, Treatment Method, Application.
4. Can you provide details about the market size?
The market size is estimated to be USD 9.67 Million as of 2022.
5. What are some drivers contributing to market growth?
Growing Burden of Cancer; Rising Investments and Government Funding in the Development of Cancer Vaccines; Technological Developments in Cancer Vaccines.
6. What are the notable trends driving market growth?
Recombinant Cancer Vaccines are Expected to a Hold Significant Market Share in the Cancer Vaccines Market.
7. Are there any restraints impacting market growth?
Stringent Regulatory Guidelines and Longer Timelines Required for Manufacturing Process; Presence of Alternative Therapies.
8. Can you provide examples of recent developments in the market?
October 2022: Anxia Biosciences began the Phase Ib clinical trial of its preventative breast cancer vaccine. This trial was financed through a grant from the United States Department of Defense.
9. What pricing options are available for accessing the report?
Pricing options include single-user, multi-user, and enterprise licenses priced at USD 4750, USD 5250, and USD 8750 respectively.
10. Is the market size provided in terms of value or volume?
The market size is provided in terms of value, measured in Million and volume, measured in K Unit.
11. Are there any specific market keywords associated with the report?
Yes, the market keyword associated with the report is "Cancer Vaccines Market," which aids in identifying and referencing the specific market segment covered.
12. How do I determine which pricing option suits my needs best?
The pricing options vary based on user requirements and access needs. Individual users may opt for single-user licenses, while businesses requiring broader access may choose multi-user or enterprise licenses for cost-effective access to the report.
13. Are there any additional resources or data provided in the Cancer Vaccines Market report?
While the report offers comprehensive insights, it's advisable to review the specific contents or supplementary materials provided to ascertain if additional resources or data are available.
14. How can I stay updated on further developments or reports in the Cancer Vaccines Market?
To stay informed about further developments, trends, and reports in the Cancer Vaccines Market, consider subscribing to industry newsletters, following relevant companies and organizations, or regularly checking reputable industry news sources and publications.
Methodology
Step 1 - Identification of Relevant Samples Size from Population Database


Step 2 - Approaches for Defining Global Market Size (Value, Volume* & Price*)

Note*: In applicable scenarios
Step 3 - Data Sources
Primary Research
- Web Analytics
- Survey Reports
- Research Institute
- Latest Research Reports
- Opinion Leaders
Secondary Research
- Annual Reports
- White Paper
- Latest Press Release
- Industry Association
- Paid Database
- Investor Presentations

Step 4 - Data Triangulation
Involves using different sources of information in order to increase the validity of a study
These sources are likely to be stakeholders in a program - participants, other researchers, program staff, other community members, and so on.
Then we put all data in single framework & apply various statistical tools to find out the dynamic on the market.
During the analysis stage, feedback from the stakeholder groups would be compared to determine areas of agreement as well as areas of divergence


