
Key Insights
The cancer sequencing market is experiencing robust growth, driven by the increasing prevalence of cancer globally, advancements in sequencing technologies, and a rising demand for personalized medicine. The market's Compound Annual Growth Rate (CAGR) of 12.50% from 2019 to 2024 suggests a significant expansion, with projections indicating continued strong performance through 2033. Technological advancements, particularly in next-generation sequencing (NGS), are enabling faster, more accurate, and cost-effective cancer diagnostics and treatment monitoring. This has led to a surge in the adoption of genome sequencing, PCR, and microarray technologies across various segments, including instruments, consumables, and services. The market is segmented geographically, with North America currently holding a substantial market share due to advanced healthcare infrastructure, high research funding, and early adoption of innovative technologies. However, Asia-Pacific is expected to witness significant growth in the coming years driven by increasing healthcare expenditure and a rising cancer incidence rate in rapidly developing economies like China and India. The market faces certain restraints, including the high cost of sequencing technologies, complex regulatory approvals, and the need for skilled professionals for data analysis and interpretation. Despite these challenges, the long-term outlook for the cancer sequencing market remains highly positive, fueled by ongoing research, technological innovations, and a growing emphasis on precision oncology.
The competitive landscape is characterized by a mix of large multinational corporations and specialized biotechnology companies. Key players such as Illumina, Thermo Fisher Scientific, Roche, and Qiagen are actively involved in developing and commercializing advanced sequencing platforms and related services. These companies are engaged in strategic collaborations, acquisitions, and research & development initiatives to maintain their market leadership and expand their product portfolios. The increasing adoption of cloud-based data analysis solutions and artificial intelligence (AI) in cancer genomics is further transforming the market, enabling more efficient data processing and insightful analysis for better clinical decision-making. The future growth will also be shaped by the continuous development of more accessible and affordable sequencing technologies, fostering wider adoption across diverse healthcare settings. Ultimately, this will improve cancer diagnosis, treatment, and patient outcomes.
This comprehensive report provides an in-depth analysis of the global cancer sequencing industry, covering market size, growth drivers, competitive landscape, technological advancements, and future outlook. The study period spans from 2019 to 2033, with 2025 as the base and estimated year. The report offers actionable insights for stakeholders across the value chain, including manufacturers, distributors, researchers, and investors. The global market is projected to reach xx Million by 2033, exhibiting a CAGR of xx% during the forecast period (2025-2033).
Cancer Sequencing Industry Market Structure & Competitive Dynamics
The cancer sequencing market exhibits a moderately consolidated structure, with a few key players holding significant market share. However, the presence of numerous smaller companies focusing on niche technologies and applications creates a dynamic competitive landscape. Market concentration is influenced by factors such as technological advancements, regulatory approvals, and strategic partnerships. The industry witnesses consistent M&A activity, with larger players acquiring smaller companies to expand their product portfolio and geographic reach. Deal values vary significantly, ranging from a few Million to several hundred Million, depending on the target company's size, technology, and market position. Innovation ecosystems are flourishing, driven by substantial R&D investments and collaborations between academia, industry, and research institutions. Regulatory frameworks, including those governing data privacy and clinical trial protocols, significantly impact market growth and adoption. Product substitutes, such as traditional cytogenetic methods, exert competitive pressure, though the increasing accuracy and affordability of sequencing are driving market expansion. End-user trends favor personalized medicine approaches, increasing demand for advanced sequencing technologies.
- Market Share: Illumina Inc. and ThermoFisher Scientific Inc. hold a significant portion of the market share, estimated at xx% and xx% respectively, in 2025. Other key players such as Roche and Qiagen hold a combined xx%.
- M&A Activity: The last five years have witnessed numerous M&A transactions totaling an estimated xx Million in value. These transactions predominantly focused on enhancing technological capabilities and broadening product offerings.
Cancer Sequencing Industry Industry Trends & Insights
The cancer sequencing market is experiencing substantial growth driven by several factors. The increasing prevalence of cancer globally, coupled with the rising demand for early and precise diagnosis and personalized treatment, fuels market expansion. Technological disruptions, including advancements in next-generation sequencing (NGS) and improvements in data analysis capabilities, are accelerating market penetration. Consumer preferences are shifting towards non-invasive diagnostic procedures and personalized medicine, further boosting market demand. The high cost of sequencing and data analysis remains a significant challenge. However, ongoing technological advancements are driving down costs, making cancer sequencing more accessible. The competitive landscape is characterized by continuous innovation and strategic partnerships among key players. The market's CAGR is projected at xx% from 2025 to 2033. Market penetration is increasing steadily, with an estimated xx% of cancer patients undergoing some form of genetic sequencing by 2033.
Dominant Markets & Segments in Cancer Sequencing Industry
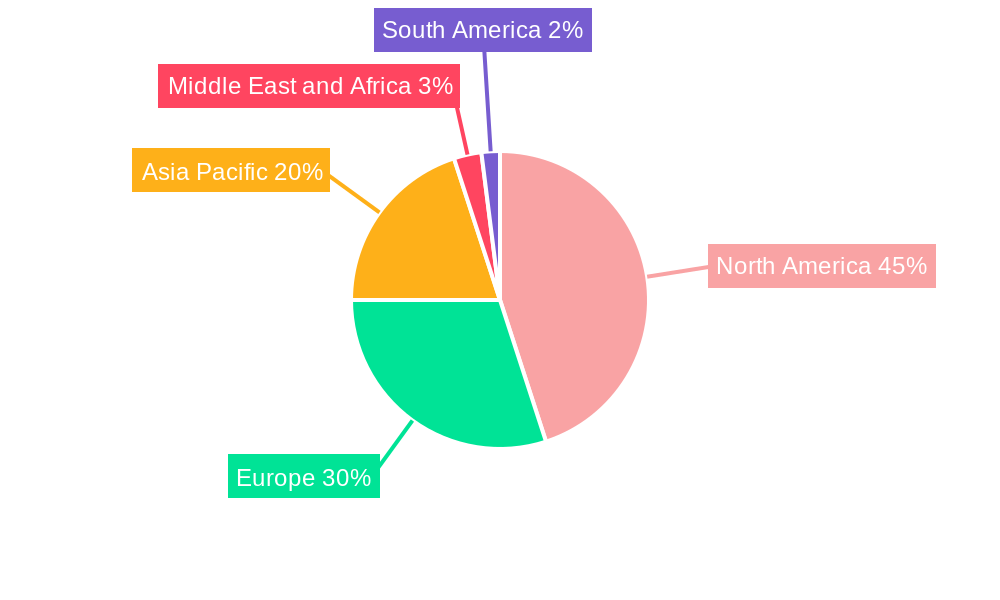
The North American region currently dominates the cancer sequencing market, driven by high healthcare expenditure, advanced infrastructure, and robust regulatory support. However, Asia Pacific is projected to witness the fastest growth rate owing to rising healthcare investments, increasing cancer prevalence, and growing government initiatives.
Leading Segments:
- Technology: Genome sequencing is the dominant technology segment, accounting for approximately xx% of the market, primarily due to its comprehensive genomic information. However, PCR and microarray technologies still hold significant market shares due to their cost-effectiveness and established infrastructure.
- Product Type: Services (diagnostic testing and bioinformatics analysis) represent the largest segment, driven by outsourcing trends and the complexities of data analysis. Instruments and consumables are also critical segments, with substantial growth anticipated due to technology upgrades and an increasing number of tests.
Key Drivers:
- North America: High healthcare expenditure, strong regulatory framework, advanced research infrastructure, early adoption of new technologies.
- Asia Pacific: Increasing cancer prevalence, rising healthcare investments, government initiatives to improve healthcare infrastructure, growing awareness of personalized medicine.
Cancer Sequencing Industry Product Innovations
Recent years have witnessed significant advancements in sequencing technologies, including the development of more accurate, faster, and cost-effective methods. Portable sequencing devices, improved bioinformatics tools, and cloud-based data analysis platforms are enhancing accessibility and efficiency. These innovations have expanded the applications of cancer sequencing to include early cancer detection, personalized treatment selection, and monitoring of disease progression. Furthermore, liquid biopsy technologies are gaining traction, providing less invasive alternatives for cancer detection and monitoring. This combination of technological advancements and market demand positions the cancer sequencing industry for continued growth.
Report Segmentation & Scope
The report segments the market based on technology (PCR, Microarrays, Genome Sequencing) and product type (Instruments, Consumables, Services). Each segment is analyzed in detail, including market size, growth projections, and competitive dynamics.
- Technology: PCR, Microarrays, and Genome Sequencing segments are analyzed for their individual market sizes, growth rates, and key players. Growth projections show Genome Sequencing to experience the highest growth.
- Product Type: Instruments, Consumables, and Services segments are individually assessed regarding market size, growth rate, and competitive intensity. Services are expected to maintain the largest market share.
Key Drivers of Cancer Sequencing Industry Growth
Several factors are driving the expansion of the cancer sequencing industry. Technological advancements such as NGS and improved bioinformatics tools are enabling faster, more accurate, and cost-effective sequencing. Increasing prevalence of cancer globally is increasing demand for diagnostic and treatment solutions. Growing adoption of personalized medicine, coupled with supportive government policies and rising healthcare expenditure, further contributes to the market's growth. The development of liquid biopsy technologies also provides a less-invasive approach to cancer diagnosis and monitoring, adding to the market's momentum.
Challenges in the Cancer Sequencing Industry Sector
Despite the promising growth trajectory, several challenges exist within the cancer sequencing industry. High costs associated with sequencing, data analysis, and interpretation can limit accessibility. Data privacy and security concerns surrounding patient genomic information necessitate robust regulatory frameworks and stringent data protection measures. The complex regulatory landscape and the need for extensive clinical validation for new technologies add to the industry's challenges. Supply chain issues, particularly regarding reagents and consumables, can impact market stability. Lastly, intense competition among numerous companies requires continuous innovation and efficient operations.
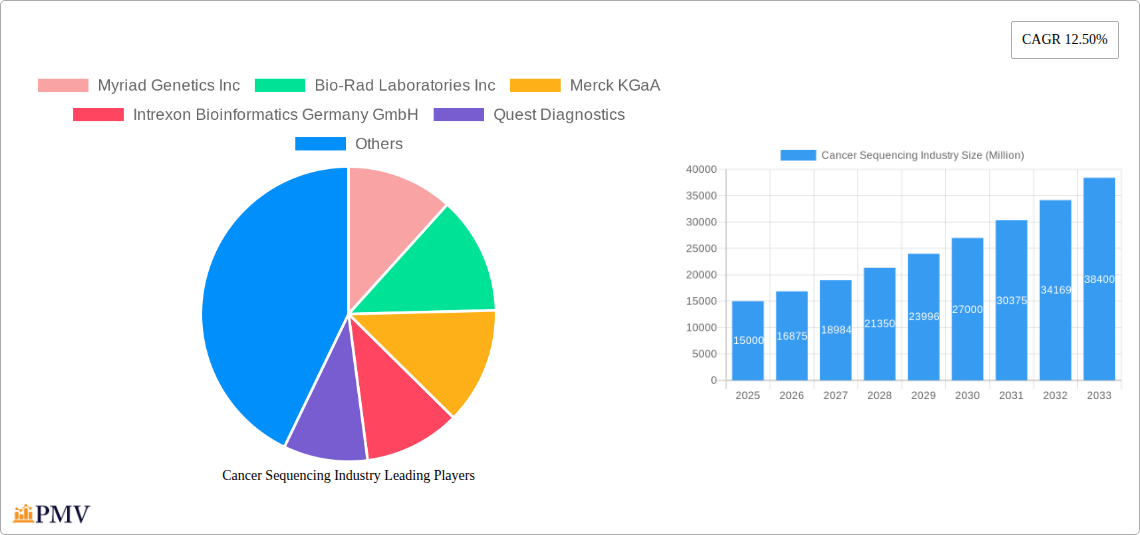
Leading Players in the Cancer Sequencing Industry Market
- Myriad Genetics Inc
- Bio-Rad Laboratories Inc
- Merck KGaA
- Intrexon Bioinformatics Germany GmbH
- Quest Diagnostics
- F Hoffmann-La Roche AG
- Agilent Technologies Inc
- Cancer Genetics Inc
- Luminex Corporation
- Qiagen NV
- Illumina Inc
- Pacific Biosciences of California Inc
- GE Healthcare (GE Company)
- Perkin Elmer
- ThermoFisher Scientific Inc
Key Developments in Cancer Sequencing Industry Sector
- August 2022: Development of the TMC-SNPdb2.0 genome toolkit by ACTREC, providing a valuable resource for analyzing cancer-specific gene mutations in the Indian population. This development addresses the gap in Indian-origin cancer genome data in global datasets and may accelerate research and development in the region.
- February 2023: Oxford Nanopore Technologies' collaboration extension with UPS Healthcare to enhance the delivery of sequencing products and consumables across the Asia Pacific region. This strategic partnership aims to improve accessibility and market penetration in a rapidly growing region.
Strategic Cancer Sequencing Industry Market Outlook
The cancer sequencing industry is poised for substantial growth, driven by technological advancements, increasing cancer prevalence, and the growing adoption of personalized medicine. Strategic opportunities exist in the development of innovative sequencing technologies, expansion into emerging markets, and the creation of comprehensive data analysis platforms. Focus on improving data security and addressing ethical concerns surrounding genomic information will be crucial for sustainable growth. The industry's future lies in developing cost-effective and accessible solutions, fostering collaborations to improve data sharing and standardization, and continuously innovating to meet evolving clinical needs.
Cancer Sequencing Industry Segmentation
-
1. Product Type
- 1.1. Instruments
- 1.2. Consumables
- 1.3. Services
-
2. Technology
- 2.1. PCR
- 2.2. MicroArrays
- 2.3. Genome Sequencing
Cancer Sequencing Industry Segmentation By Geography
-
1. North America
- 1.1. United States
- 1.2. Canada
- 1.3. Mexico
-
2. Europe
- 2.1. Germany
- 2.2. United Kingdom
- 2.3. France
- 2.4. Italy
- 2.5. Spain
- 2.6. Rest of Europe
-
3. Asia Pacific
- 3.1. China
- 3.2. Japan
- 3.3. India
- 3.4. Australia
- 3.5. South Korea
- 3.6. Rest of Asia Pacific
-
4. Middle East and Africa
- 4.1. GCC
- 4.2. South Africa
- 4.3. Rest of Middle East and Africa
-
5. South America
- 5.1. Brazil
- 5.2. Argentina
- 5.3. Rest of South America
Cancer Sequencing Industry REPORT HIGHLIGHTS
| Aspects | Details |
|---|---|
| Study Period | 2019-2033 |
| Base Year | 2024 |
| Estimated Year | 2025 |
| Forecast Period | 2025-2033 |
| Historical Period | 2019-2024 |
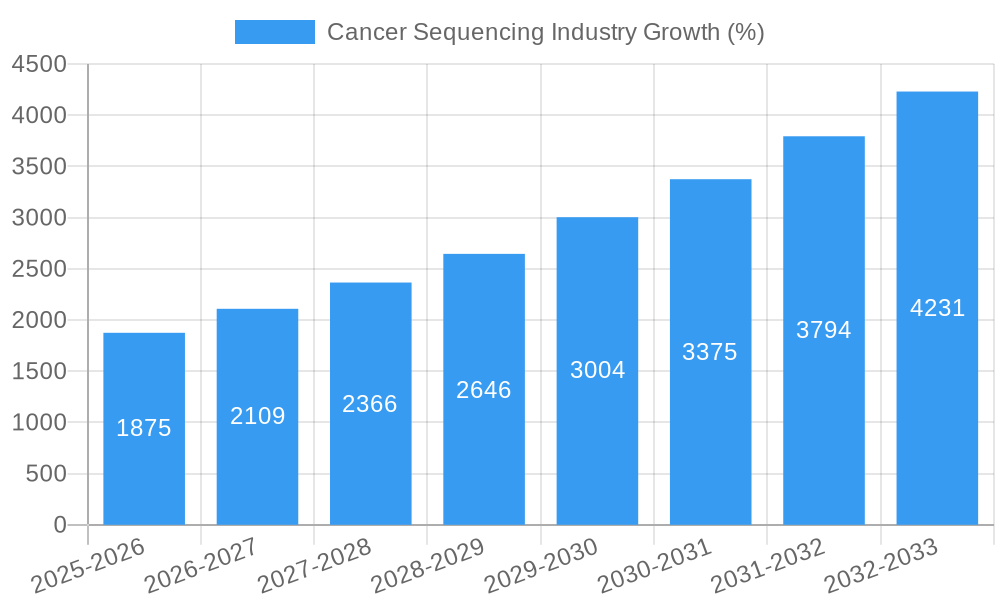
| Growth Rate | CAGR of 12.50% from 2019-2033 |
| Segmentation |
|
Table of Contents
- 1. Introduction
- 1.1. Research Scope
- 1.2. Market Segmentation
- 1.3. Research Methodology
- 1.4. Definitions and Assumptions
- 2. Executive Summary
- 2.1. Introduction
- 3. Market Dynamics
- 3.1. Introduction
- 3.2. Market Drivers
- 3.2.1 Growing Burden of Cancer; Initiatives taken by Companies in Product Development; Speed
- 3.2.2 Accuracy and Potential Replacement for Traditional Technologies to Spur Market Growth
- 3.3. Market Restrains
- 3.3.1. Interpretation of Complex Data and Lack of Skilled Professionals; High Cost of Instruments and Procedures
- 3.4. Market Trends
- 3.4.1. Genome Sequencing Segment is Expected to Hold a Major Market Share
- 4. Market Factor Analysis
- 4.1. Porters Five Forces
- 4.2. Supply/Value Chain
- 4.3. PESTEL analysis
- 4.4. Market Entropy
- 4.5. Patent/Trademark Analysis
- 5. Global Cancer Sequencing Industry Analysis, Insights and Forecast, 2019-2031
- 5.1. Market Analysis, Insights and Forecast - by Product Type
- 5.1.1. Instruments
- 5.1.2. Consumables
- 5.1.3. Services
- 5.2. Market Analysis, Insights and Forecast - by Technology
- 5.2.1. PCR
- 5.2.2. MicroArrays
- 5.2.3. Genome Sequencing
- 5.3. Market Analysis, Insights and Forecast - by Region
- 5.3.1. North America
- 5.3.2. Europe
- 5.3.3. Asia Pacific
- 5.3.4. Middle East and Africa
- 5.3.5. South America
- 5.1. Market Analysis, Insights and Forecast - by Product Type
- 6. North America Cancer Sequencing Industry Analysis, Insights and Forecast, 2019-2031
- 6.1. Market Analysis, Insights and Forecast - by Product Type
- 6.1.1. Instruments
- 6.1.2. Consumables
- 6.1.3. Services
- 6.2. Market Analysis, Insights and Forecast - by Technology
- 6.2.1. PCR
- 6.2.2. MicroArrays
- 6.2.3. Genome Sequencing
- 6.1. Market Analysis, Insights and Forecast - by Product Type
- 7. Europe Cancer Sequencing Industry Analysis, Insights and Forecast, 2019-2031
- 7.1. Market Analysis, Insights and Forecast - by Product Type
- 7.1.1. Instruments
- 7.1.2. Consumables
- 7.1.3. Services
- 7.2. Market Analysis, Insights and Forecast - by Technology
- 7.2.1. PCR
- 7.2.2. MicroArrays
- 7.2.3. Genome Sequencing
- 7.1. Market Analysis, Insights and Forecast - by Product Type
- 8. Asia Pacific Cancer Sequencing Industry Analysis, Insights and Forecast, 2019-2031
- 8.1. Market Analysis, Insights and Forecast - by Product Type
- 8.1.1. Instruments
- 8.1.2. Consumables
- 8.1.3. Services
- 8.2. Market Analysis, Insights and Forecast - by Technology
- 8.2.1. PCR
- 8.2.2. MicroArrays
- 8.2.3. Genome Sequencing
- 8.1. Market Analysis, Insights and Forecast - by Product Type
- 9. Middle East and Africa Cancer Sequencing Industry Analysis, Insights and Forecast, 2019-2031
- 9.1. Market Analysis, Insights and Forecast - by Product Type
- 9.1.1. Instruments
- 9.1.2. Consumables
- 9.1.3. Services
- 9.2. Market Analysis, Insights and Forecast - by Technology
- 9.2.1. PCR
- 9.2.2. MicroArrays
- 9.2.3. Genome Sequencing
- 9.1. Market Analysis, Insights and Forecast - by Product Type
- 10. South America Cancer Sequencing Industry Analysis, Insights and Forecast, 2019-2031
- 10.1. Market Analysis, Insights and Forecast - by Product Type
- 10.1.1. Instruments
- 10.1.2. Consumables
- 10.1.3. Services
- 10.2. Market Analysis, Insights and Forecast - by Technology
- 10.2.1. PCR
- 10.2.2. MicroArrays
- 10.2.3. Genome Sequencing
- 10.1. Market Analysis, Insights and Forecast - by Product Type
- 11. North America Cancer Sequencing Industry Analysis, Insights and Forecast, 2019-2031
- 11.1. Market Analysis, Insights and Forecast - By Country/Sub-region
- 11.1.1 United States
- 11.1.2 Canada
- 11.1.3 Mexico
- 12. Europe Cancer Sequencing Industry Analysis, Insights and Forecast, 2019-2031
- 12.1. Market Analysis, Insights and Forecast - By Country/Sub-region
- 12.1.1 Germany
- 12.1.2 United Kingdom
- 12.1.3 France
- 12.1.4 Italy
- 12.1.5 Spain
- 12.1.6 Rest of Europe
- 13. Asia Pacific Cancer Sequencing Industry Analysis, Insights and Forecast, 2019-2031
- 13.1. Market Analysis, Insights and Forecast - By Country/Sub-region
- 13.1.1 China
- 13.1.2 Japan
- 13.1.3 India
- 13.1.4 Australia
- 13.1.5 South Korea
- 13.1.6 Rest of Asia Pacific
- 14. Middle East and Africa Cancer Sequencing Industry Analysis, Insights and Forecast, 2019-2031
- 14.1. Market Analysis, Insights and Forecast - By Country/Sub-region
- 14.1.1 GCC
- 14.1.2 South Africa
- 14.1.3 Rest of Middle East and Africa
- 15. South America Cancer Sequencing Industry Analysis, Insights and Forecast, 2019-2031
- 15.1. Market Analysis, Insights and Forecast - By Country/Sub-region
- 15.1.1 Brazil
- 15.1.2 Argentina
- 15.1.3 Rest of South America
- 16. Competitive Analysis
- 16.1. Global Market Share Analysis 2024
- 16.2. Company Profiles
- 16.2.1 Myriad Genetics Inc
- 16.2.1.1. Overview
- 16.2.1.2. Products
- 16.2.1.3. SWOT Analysis
- 16.2.1.4. Recent Developments
- 16.2.1.5. Financials (Based on Availability)
- 16.2.2 Bio-Rad Laboratories Inc
- 16.2.2.1. Overview
- 16.2.2.2. Products
- 16.2.2.3. SWOT Analysis
- 16.2.2.4. Recent Developments
- 16.2.2.5. Financials (Based on Availability)
- 16.2.3 Merck KGaA
- 16.2.3.1. Overview
- 16.2.3.2. Products
- 16.2.3.3. SWOT Analysis
- 16.2.3.4. Recent Developments
- 16.2.3.5. Financials (Based on Availability)
- 16.2.4 Intrexon Bioinformatics Germany GmbH
- 16.2.4.1. Overview
- 16.2.4.2. Products
- 16.2.4.3. SWOT Analysis
- 16.2.4.4. Recent Developments
- 16.2.4.5. Financials (Based on Availability)
- 16.2.5 Quest Diagnostics
- 16.2.5.1. Overview
- 16.2.5.2. Products
- 16.2.5.3. SWOT Analysis
- 16.2.5.4. Recent Developments
- 16.2.5.5. Financials (Based on Availability)
- 16.2.6 F Hoffmann-La Roche AG
- 16.2.6.1. Overview
- 16.2.6.2. Products
- 16.2.6.3. SWOT Analysis
- 16.2.6.4. Recent Developments
- 16.2.6.5. Financials (Based on Availability)
- 16.2.7 Agilent Technologies Inc
- 16.2.7.1. Overview
- 16.2.7.2. Products
- 16.2.7.3. SWOT Analysis
- 16.2.7.4. Recent Developments
- 16.2.7.5. Financials (Based on Availability)
- 16.2.8 Cancer Genetics Inc
- 16.2.8.1. Overview
- 16.2.8.2. Products
- 16.2.8.3. SWOT Analysis
- 16.2.8.4. Recent Developments
- 16.2.8.5. Financials (Based on Availability)
- 16.2.9 Luminex Corporation
- 16.2.9.1. Overview
- 16.2.9.2. Products
- 16.2.9.3. SWOT Analysis
- 16.2.9.4. Recent Developments
- 16.2.9.5. Financials (Based on Availability)
- 16.2.10 Qiagen NV
- 16.2.10.1. Overview
- 16.2.10.2. Products
- 16.2.10.3. SWOT Analysis
- 16.2.10.4. Recent Developments
- 16.2.10.5. Financials (Based on Availability)
- 16.2.11 Illumina Inc
- 16.2.11.1. Overview
- 16.2.11.2. Products
- 16.2.11.3. SWOT Analysis
- 16.2.11.4. Recent Developments
- 16.2.11.5. Financials (Based on Availability)
- 16.2.12 Pacific Biosciences of California Inc
- 16.2.12.1. Overview
- 16.2.12.2. Products
- 16.2.12.3. SWOT Analysis
- 16.2.12.4. Recent Developments
- 16.2.12.5. Financials (Based on Availability)
- 16.2.13 GE Healthcare (GE Company)
- 16.2.13.1. Overview
- 16.2.13.2. Products
- 16.2.13.3. SWOT Analysis
- 16.2.13.4. Recent Developments
- 16.2.13.5. Financials (Based on Availability)
- 16.2.14 Perkin Elmer
- 16.2.14.1. Overview
- 16.2.14.2. Products
- 16.2.14.3. SWOT Analysis
- 16.2.14.4. Recent Developments
- 16.2.14.5. Financials (Based on Availability)
- 16.2.15 ThermoFisher Scientific Inc
- 16.2.15.1. Overview
- 16.2.15.2. Products
- 16.2.15.3. SWOT Analysis
- 16.2.15.4. Recent Developments
- 16.2.15.5. Financials (Based on Availability)
- 16.2.1 Myriad Genetics Inc
List of Figures
- Figure 1: Global Cancer Sequencing Industry Revenue Breakdown (Million, %) by Region 2024 & 2032
- Figure 2: Global Cancer Sequencing Industry Volume Breakdown (K Unit, %) by Region 2024 & 2032
- Figure 3: North America Cancer Sequencing Industry Revenue (Million), by Country 2024 & 2032
- Figure 4: North America Cancer Sequencing Industry Volume (K Unit), by Country 2024 & 2032
- Figure 5: North America Cancer Sequencing Industry Revenue Share (%), by Country 2024 & 2032
- Figure 6: North America Cancer Sequencing Industry Volume Share (%), by Country 2024 & 2032
- Figure 7: Europe Cancer Sequencing Industry Revenue (Million), by Country 2024 & 2032
- Figure 8: Europe Cancer Sequencing Industry Volume (K Unit), by Country 2024 & 2032
- Figure 9: Europe Cancer Sequencing Industry Revenue Share (%), by Country 2024 & 2032
- Figure 10: Europe Cancer Sequencing Industry Volume Share (%), by Country 2024 & 2032
- Figure 11: Asia Pacific Cancer Sequencing Industry Revenue (Million), by Country 2024 & 2032
- Figure 12: Asia Pacific Cancer Sequencing Industry Volume (K Unit), by Country 2024 & 2032
- Figure 13: Asia Pacific Cancer Sequencing Industry Revenue Share (%), by Country 2024 & 2032
- Figure 14: Asia Pacific Cancer Sequencing Industry Volume Share (%), by Country 2024 & 2032
- Figure 15: Middle East and Africa Cancer Sequencing Industry Revenue (Million), by Country 2024 & 2032
- Figure 16: Middle East and Africa Cancer Sequencing Industry Volume (K Unit), by Country 2024 & 2032
- Figure 17: Middle East and Africa Cancer Sequencing Industry Revenue Share (%), by Country 2024 & 2032
- Figure 18: Middle East and Africa Cancer Sequencing Industry Volume Share (%), by Country 2024 & 2032
- Figure 19: South America Cancer Sequencing Industry Revenue (Million), by Country 2024 & 2032
- Figure 20: South America Cancer Sequencing Industry Volume (K Unit), by Country 2024 & 2032
- Figure 21: South America Cancer Sequencing Industry Revenue Share (%), by Country 2024 & 2032
- Figure 22: South America Cancer Sequencing Industry Volume Share (%), by Country 2024 & 2032
- Figure 23: North America Cancer Sequencing Industry Revenue (Million), by Product Type 2024 & 2032
- Figure 24: North America Cancer Sequencing Industry Volume (K Unit), by Product Type 2024 & 2032
- Figure 25: North America Cancer Sequencing Industry Revenue Share (%), by Product Type 2024 & 2032
- Figure 26: North America Cancer Sequencing Industry Volume Share (%), by Product Type 2024 & 2032
- Figure 27: North America Cancer Sequencing Industry Revenue (Million), by Technology 2024 & 2032
- Figure 28: North America Cancer Sequencing Industry Volume (K Unit), by Technology 2024 & 2032
- Figure 29: North America Cancer Sequencing Industry Revenue Share (%), by Technology 2024 & 2032
- Figure 30: North America Cancer Sequencing Industry Volume Share (%), by Technology 2024 & 2032
- Figure 31: North America Cancer Sequencing Industry Revenue (Million), by Country 2024 & 2032
- Figure 32: North America Cancer Sequencing Industry Volume (K Unit), by Country 2024 & 2032
- Figure 33: North America Cancer Sequencing Industry Revenue Share (%), by Country 2024 & 2032
- Figure 34: North America Cancer Sequencing Industry Volume Share (%), by Country 2024 & 2032
- Figure 35: Europe Cancer Sequencing Industry Revenue (Million), by Product Type 2024 & 2032
- Figure 36: Europe Cancer Sequencing Industry Volume (K Unit), by Product Type 2024 & 2032
- Figure 37: Europe Cancer Sequencing Industry Revenue Share (%), by Product Type 2024 & 2032
- Figure 38: Europe Cancer Sequencing Industry Volume Share (%), by Product Type 2024 & 2032
- Figure 39: Europe Cancer Sequencing Industry Revenue (Million), by Technology 2024 & 2032
- Figure 40: Europe Cancer Sequencing Industry Volume (K Unit), by Technology 2024 & 2032
- Figure 41: Europe Cancer Sequencing Industry Revenue Share (%), by Technology 2024 & 2032
- Figure 42: Europe Cancer Sequencing Industry Volume Share (%), by Technology 2024 & 2032
- Figure 43: Europe Cancer Sequencing Industry Revenue (Million), by Country 2024 & 2032
- Figure 44: Europe Cancer Sequencing Industry Volume (K Unit), by Country 2024 & 2032
- Figure 45: Europe Cancer Sequencing Industry Revenue Share (%), by Country 2024 & 2032
- Figure 46: Europe Cancer Sequencing Industry Volume Share (%), by Country 2024 & 2032
- Figure 47: Asia Pacific Cancer Sequencing Industry Revenue (Million), by Product Type 2024 & 2032
- Figure 48: Asia Pacific Cancer Sequencing Industry Volume (K Unit), by Product Type 2024 & 2032
- Figure 49: Asia Pacific Cancer Sequencing Industry Revenue Share (%), by Product Type 2024 & 2032
- Figure 50: Asia Pacific Cancer Sequencing Industry Volume Share (%), by Product Type 2024 & 2032
- Figure 51: Asia Pacific Cancer Sequencing Industry Revenue (Million), by Technology 2024 & 2032
- Figure 52: Asia Pacific Cancer Sequencing Industry Volume (K Unit), by Technology 2024 & 2032
- Figure 53: Asia Pacific Cancer Sequencing Industry Revenue Share (%), by Technology 2024 & 2032
- Figure 54: Asia Pacific Cancer Sequencing Industry Volume Share (%), by Technology 2024 & 2032
- Figure 55: Asia Pacific Cancer Sequencing Industry Revenue (Million), by Country 2024 & 2032
- Figure 56: Asia Pacific Cancer Sequencing Industry Volume (K Unit), by Country 2024 & 2032
- Figure 57: Asia Pacific Cancer Sequencing Industry Revenue Share (%), by Country 2024 & 2032
- Figure 58: Asia Pacific Cancer Sequencing Industry Volume Share (%), by Country 2024 & 2032
- Figure 59: Middle East and Africa Cancer Sequencing Industry Revenue (Million), by Product Type 2024 & 2032
- Figure 60: Middle East and Africa Cancer Sequencing Industry Volume (K Unit), by Product Type 2024 & 2032
- Figure 61: Middle East and Africa Cancer Sequencing Industry Revenue Share (%), by Product Type 2024 & 2032
- Figure 62: Middle East and Africa Cancer Sequencing Industry Volume Share (%), by Product Type 2024 & 2032
- Figure 63: Middle East and Africa Cancer Sequencing Industry Revenue (Million), by Technology 2024 & 2032
- Figure 64: Middle East and Africa Cancer Sequencing Industry Volume (K Unit), by Technology 2024 & 2032
- Figure 65: Middle East and Africa Cancer Sequencing Industry Revenue Share (%), by Technology 2024 & 2032
- Figure 66: Middle East and Africa Cancer Sequencing Industry Volume Share (%), by Technology 2024 & 2032
- Figure 67: Middle East and Africa Cancer Sequencing Industry Revenue (Million), by Country 2024 & 2032
- Figure 68: Middle East and Africa Cancer Sequencing Industry Volume (K Unit), by Country 2024 & 2032
- Figure 69: Middle East and Africa Cancer Sequencing Industry Revenue Share (%), by Country 2024 & 2032
- Figure 70: Middle East and Africa Cancer Sequencing Industry Volume Share (%), by Country 2024 & 2032
- Figure 71: South America Cancer Sequencing Industry Revenue (Million), by Product Type 2024 & 2032
- Figure 72: South America Cancer Sequencing Industry Volume (K Unit), by Product Type 2024 & 2032
- Figure 73: South America Cancer Sequencing Industry Revenue Share (%), by Product Type 2024 & 2032
- Figure 74: South America Cancer Sequencing Industry Volume Share (%), by Product Type 2024 & 2032
- Figure 75: South America Cancer Sequencing Industry Revenue (Million), by Technology 2024 & 2032
- Figure 76: South America Cancer Sequencing Industry Volume (K Unit), by Technology 2024 & 2032
- Figure 77: South America Cancer Sequencing Industry Revenue Share (%), by Technology 2024 & 2032
- Figure 78: South America Cancer Sequencing Industry Volume Share (%), by Technology 2024 & 2032
- Figure 79: South America Cancer Sequencing Industry Revenue (Million), by Country 2024 & 2032
- Figure 80: South America Cancer Sequencing Industry Volume (K Unit), by Country 2024 & 2032
- Figure 81: South America Cancer Sequencing Industry Revenue Share (%), by Country 2024 & 2032
- Figure 82: South America Cancer Sequencing Industry Volume Share (%), by Country 2024 & 2032
List of Tables
- Table 1: Global Cancer Sequencing Industry Revenue Million Forecast, by Region 2019 & 2032
- Table 2: Global Cancer Sequencing Industry Volume K Unit Forecast, by Region 2019 & 2032
- Table 3: Global Cancer Sequencing Industry Revenue Million Forecast, by Product Type 2019 & 2032
- Table 4: Global Cancer Sequencing Industry Volume K Unit Forecast, by Product Type 2019 & 2032
- Table 5: Global Cancer Sequencing Industry Revenue Million Forecast, by Technology 2019 & 2032
- Table 6: Global Cancer Sequencing Industry Volume K Unit Forecast, by Technology 2019 & 2032
- Table 7: Global Cancer Sequencing Industry Revenue Million Forecast, by Region 2019 & 2032
- Table 8: Global Cancer Sequencing Industry Volume K Unit Forecast, by Region 2019 & 2032
- Table 9: Global Cancer Sequencing Industry Revenue Million Forecast, by Country 2019 & 2032
- Table 10: Global Cancer Sequencing Industry Volume K Unit Forecast, by Country 2019 & 2032
- Table 11: United States Cancer Sequencing Industry Revenue (Million) Forecast, by Application 2019 & 2032
- Table 12: United States Cancer Sequencing Industry Volume (K Unit) Forecast, by Application 2019 & 2032
- Table 13: Canada Cancer Sequencing Industry Revenue (Million) Forecast, by Application 2019 & 2032
- Table 14: Canada Cancer Sequencing Industry Volume (K Unit) Forecast, by Application 2019 & 2032
- Table 15: Mexico Cancer Sequencing Industry Revenue (Million) Forecast, by Application 2019 & 2032
- Table 16: Mexico Cancer Sequencing Industry Volume (K Unit) Forecast, by Application 2019 & 2032
- Table 17: Global Cancer Sequencing Industry Revenue Million Forecast, by Country 2019 & 2032
- Table 18: Global Cancer Sequencing Industry Volume K Unit Forecast, by Country 2019 & 2032
- Table 19: Germany Cancer Sequencing Industry Revenue (Million) Forecast, by Application 2019 & 2032
- Table 20: Germany Cancer Sequencing Industry Volume (K Unit) Forecast, by Application 2019 & 2032
- Table 21: United Kingdom Cancer Sequencing Industry Revenue (Million) Forecast, by Application 2019 & 2032
- Table 22: United Kingdom Cancer Sequencing Industry Volume (K Unit) Forecast, by Application 2019 & 2032
- Table 23: France Cancer Sequencing Industry Revenue (Million) Forecast, by Application 2019 & 2032
- Table 24: France Cancer Sequencing Industry Volume (K Unit) Forecast, by Application 2019 & 2032
- Table 25: Italy Cancer Sequencing Industry Revenue (Million) Forecast, by Application 2019 & 2032
- Table 26: Italy Cancer Sequencing Industry Volume (K Unit) Forecast, by Application 2019 & 2032
- Table 27: Spain Cancer Sequencing Industry Revenue (Million) Forecast, by Application 2019 & 2032
- Table 28: Spain Cancer Sequencing Industry Volume (K Unit) Forecast, by Application 2019 & 2032
- Table 29: Rest of Europe Cancer Sequencing Industry Revenue (Million) Forecast, by Application 2019 & 2032
- Table 30: Rest of Europe Cancer Sequencing Industry Volume (K Unit) Forecast, by Application 2019 & 2032
- Table 31: Global Cancer Sequencing Industry Revenue Million Forecast, by Country 2019 & 2032
- Table 32: Global Cancer Sequencing Industry Volume K Unit Forecast, by Country 2019 & 2032
- Table 33: China Cancer Sequencing Industry Revenue (Million) Forecast, by Application 2019 & 2032
- Table 34: China Cancer Sequencing Industry Volume (K Unit) Forecast, by Application 2019 & 2032
- Table 35: Japan Cancer Sequencing Industry Revenue (Million) Forecast, by Application 2019 & 2032
- Table 36: Japan Cancer Sequencing Industry Volume (K Unit) Forecast, by Application 2019 & 2032
- Table 37: India Cancer Sequencing Industry Revenue (Million) Forecast, by Application 2019 & 2032
- Table 38: India Cancer Sequencing Industry Volume (K Unit) Forecast, by Application 2019 & 2032
- Table 39: Australia Cancer Sequencing Industry Revenue (Million) Forecast, by Application 2019 & 2032
- Table 40: Australia Cancer Sequencing Industry Volume (K Unit) Forecast, by Application 2019 & 2032
- Table 41: South Korea Cancer Sequencing Industry Revenue (Million) Forecast, by Application 2019 & 2032
- Table 42: South Korea Cancer Sequencing Industry Volume (K Unit) Forecast, by Application 2019 & 2032
- Table 43: Rest of Asia Pacific Cancer Sequencing Industry Revenue (Million) Forecast, by Application 2019 & 2032
- Table 44: Rest of Asia Pacific Cancer Sequencing Industry Volume (K Unit) Forecast, by Application 2019 & 2032
- Table 45: Global Cancer Sequencing Industry Revenue Million Forecast, by Country 2019 & 2032
- Table 46: Global Cancer Sequencing Industry Volume K Unit Forecast, by Country 2019 & 2032
- Table 47: GCC Cancer Sequencing Industry Revenue (Million) Forecast, by Application 2019 & 2032
- Table 48: GCC Cancer Sequencing Industry Volume (K Unit) Forecast, by Application 2019 & 2032
- Table 49: South Africa Cancer Sequencing Industry Revenue (Million) Forecast, by Application 2019 & 2032
- Table 50: South Africa Cancer Sequencing Industry Volume (K Unit) Forecast, by Application 2019 & 2032
- Table 51: Rest of Middle East and Africa Cancer Sequencing Industry Revenue (Million) Forecast, by Application 2019 & 2032
- Table 52: Rest of Middle East and Africa Cancer Sequencing Industry Volume (K Unit) Forecast, by Application 2019 & 2032
- Table 53: Global Cancer Sequencing Industry Revenue Million Forecast, by Country 2019 & 2032
- Table 54: Global Cancer Sequencing Industry Volume K Unit Forecast, by Country 2019 & 2032
- Table 55: Brazil Cancer Sequencing Industry Revenue (Million) Forecast, by Application 2019 & 2032
- Table 56: Brazil Cancer Sequencing Industry Volume (K Unit) Forecast, by Application 2019 & 2032
- Table 57: Argentina Cancer Sequencing Industry Revenue (Million) Forecast, by Application 2019 & 2032
- Table 58: Argentina Cancer Sequencing Industry Volume (K Unit) Forecast, by Application 2019 & 2032
- Table 59: Rest of South America Cancer Sequencing Industry Revenue (Million) Forecast, by Application 2019 & 2032
- Table 60: Rest of South America Cancer Sequencing Industry Volume (K Unit) Forecast, by Application 2019 & 2032
- Table 61: Global Cancer Sequencing Industry Revenue Million Forecast, by Product Type 2019 & 2032
- Table 62: Global Cancer Sequencing Industry Volume K Unit Forecast, by Product Type 2019 & 2032
- Table 63: Global Cancer Sequencing Industry Revenue Million Forecast, by Technology 2019 & 2032
- Table 64: Global Cancer Sequencing Industry Volume K Unit Forecast, by Technology 2019 & 2032
- Table 65: Global Cancer Sequencing Industry Revenue Million Forecast, by Country 2019 & 2032
- Table 66: Global Cancer Sequencing Industry Volume K Unit Forecast, by Country 2019 & 2032
- Table 67: United States Cancer Sequencing Industry Revenue (Million) Forecast, by Application 2019 & 2032
- Table 68: United States Cancer Sequencing Industry Volume (K Unit) Forecast, by Application 2019 & 2032
- Table 69: Canada Cancer Sequencing Industry Revenue (Million) Forecast, by Application 2019 & 2032
- Table 70: Canada Cancer Sequencing Industry Volume (K Unit) Forecast, by Application 2019 & 2032
- Table 71: Mexico Cancer Sequencing Industry Revenue (Million) Forecast, by Application 2019 & 2032
- Table 72: Mexico Cancer Sequencing Industry Volume (K Unit) Forecast, by Application 2019 & 2032
- Table 73: Global Cancer Sequencing Industry Revenue Million Forecast, by Product Type 2019 & 2032
- Table 74: Global Cancer Sequencing Industry Volume K Unit Forecast, by Product Type 2019 & 2032
- Table 75: Global Cancer Sequencing Industry Revenue Million Forecast, by Technology 2019 & 2032
- Table 76: Global Cancer Sequencing Industry Volume K Unit Forecast, by Technology 2019 & 2032
- Table 77: Global Cancer Sequencing Industry Revenue Million Forecast, by Country 2019 & 2032
- Table 78: Global Cancer Sequencing Industry Volume K Unit Forecast, by Country 2019 & 2032
- Table 79: Germany Cancer Sequencing Industry Revenue (Million) Forecast, by Application 2019 & 2032
- Table 80: Germany Cancer Sequencing Industry Volume (K Unit) Forecast, by Application 2019 & 2032
- Table 81: United Kingdom Cancer Sequencing Industry Revenue (Million) Forecast, by Application 2019 & 2032
- Table 82: United Kingdom Cancer Sequencing Industry Volume (K Unit) Forecast, by Application 2019 & 2032
- Table 83: France Cancer Sequencing Industry Revenue (Million) Forecast, by Application 2019 & 2032
- Table 84: France Cancer Sequencing Industry Volume (K Unit) Forecast, by Application 2019 & 2032
- Table 85: Italy Cancer Sequencing Industry Revenue (Million) Forecast, by Application 2019 & 2032
- Table 86: Italy Cancer Sequencing Industry Volume (K Unit) Forecast, by Application 2019 & 2032
- Table 87: Spain Cancer Sequencing Industry Revenue (Million) Forecast, by Application 2019 & 2032
- Table 88: Spain Cancer Sequencing Industry Volume (K Unit) Forecast, by Application 2019 & 2032
- Table 89: Rest of Europe Cancer Sequencing Industry Revenue (Million) Forecast, by Application 2019 & 2032
- Table 90: Rest of Europe Cancer Sequencing Industry Volume (K Unit) Forecast, by Application 2019 & 2032
- Table 91: Global Cancer Sequencing Industry Revenue Million Forecast, by Product Type 2019 & 2032
- Table 92: Global Cancer Sequencing Industry Volume K Unit Forecast, by Product Type 2019 & 2032
- Table 93: Global Cancer Sequencing Industry Revenue Million Forecast, by Technology 2019 & 2032
- Table 94: Global Cancer Sequencing Industry Volume K Unit Forecast, by Technology 2019 & 2032
- Table 95: Global Cancer Sequencing Industry Revenue Million Forecast, by Country 2019 & 2032
- Table 96: Global Cancer Sequencing Industry Volume K Unit Forecast, by Country 2019 & 2032
- Table 97: China Cancer Sequencing Industry Revenue (Million) Forecast, by Application 2019 & 2032
- Table 98: China Cancer Sequencing Industry Volume (K Unit) Forecast, by Application 2019 & 2032
- Table 99: Japan Cancer Sequencing Industry Revenue (Million) Forecast, by Application 2019 & 2032
- Table 100: Japan Cancer Sequencing Industry Volume (K Unit) Forecast, by Application 2019 & 2032
- Table 101: India Cancer Sequencing Industry Revenue (Million) Forecast, by Application 2019 & 2032
- Table 102: India Cancer Sequencing Industry Volume (K Unit) Forecast, by Application 2019 & 2032
- Table 103: Australia Cancer Sequencing Industry Revenue (Million) Forecast, by Application 2019 & 2032
- Table 104: Australia Cancer Sequencing Industry Volume (K Unit) Forecast, by Application 2019 & 2032
- Table 105: South Korea Cancer Sequencing Industry Revenue (Million) Forecast, by Application 2019 & 2032
- Table 106: South Korea Cancer Sequencing Industry Volume (K Unit) Forecast, by Application 2019 & 2032
- Table 107: Rest of Asia Pacific Cancer Sequencing Industry Revenue (Million) Forecast, by Application 2019 & 2032
- Table 108: Rest of Asia Pacific Cancer Sequencing Industry Volume (K Unit) Forecast, by Application 2019 & 2032
- Table 109: Global Cancer Sequencing Industry Revenue Million Forecast, by Product Type 2019 & 2032
- Table 110: Global Cancer Sequencing Industry Volume K Unit Forecast, by Product Type 2019 & 2032
- Table 111: Global Cancer Sequencing Industry Revenue Million Forecast, by Technology 2019 & 2032
- Table 112: Global Cancer Sequencing Industry Volume K Unit Forecast, by Technology 2019 & 2032
- Table 113: Global Cancer Sequencing Industry Revenue Million Forecast, by Country 2019 & 2032
- Table 114: Global Cancer Sequencing Industry Volume K Unit Forecast, by Country 2019 & 2032
- Table 115: GCC Cancer Sequencing Industry Revenue (Million) Forecast, by Application 2019 & 2032
- Table 116: GCC Cancer Sequencing Industry Volume (K Unit) Forecast, by Application 2019 & 2032
- Table 117: South Africa Cancer Sequencing Industry Revenue (Million) Forecast, by Application 2019 & 2032
- Table 118: South Africa Cancer Sequencing Industry Volume (K Unit) Forecast, by Application 2019 & 2032
- Table 119: Rest of Middle East and Africa Cancer Sequencing Industry Revenue (Million) Forecast, by Application 2019 & 2032
- Table 120: Rest of Middle East and Africa Cancer Sequencing Industry Volume (K Unit) Forecast, by Application 2019 & 2032
- Table 121: Global Cancer Sequencing Industry Revenue Million Forecast, by Product Type 2019 & 2032
- Table 122: Global Cancer Sequencing Industry Volume K Unit Forecast, by Product Type 2019 & 2032
- Table 123: Global Cancer Sequencing Industry Revenue Million Forecast, by Technology 2019 & 2032
- Table 124: Global Cancer Sequencing Industry Volume K Unit Forecast, by Technology 2019 & 2032
- Table 125: Global Cancer Sequencing Industry Revenue Million Forecast, by Country 2019 & 2032
- Table 126: Global Cancer Sequencing Industry Volume K Unit Forecast, by Country 2019 & 2032
- Table 127: Brazil Cancer Sequencing Industry Revenue (Million) Forecast, by Application 2019 & 2032
- Table 128: Brazil Cancer Sequencing Industry Volume (K Unit) Forecast, by Application 2019 & 2032
- Table 129: Argentina Cancer Sequencing Industry Revenue (Million) Forecast, by Application 2019 & 2032
- Table 130: Argentina Cancer Sequencing Industry Volume (K Unit) Forecast, by Application 2019 & 2032
- Table 131: Rest of South America Cancer Sequencing Industry Revenue (Million) Forecast, by Application 2019 & 2032
- Table 132: Rest of South America Cancer Sequencing Industry Volume (K Unit) Forecast, by Application 2019 & 2032
Frequently Asked Questions
1. What is the projected Compound Annual Growth Rate (CAGR) of the Cancer Sequencing Industry?
The projected CAGR is approximately 12.50%.
2. Which companies are prominent players in the Cancer Sequencing Industry?
Key companies in the market include Myriad Genetics Inc, Bio-Rad Laboratories Inc, Merck KGaA, Intrexon Bioinformatics Germany GmbH, Quest Diagnostics, F Hoffmann-La Roche AG, Agilent Technologies Inc, Cancer Genetics Inc, Luminex Corporation, Qiagen NV, Illumina Inc, Pacific Biosciences of California Inc, GE Healthcare (GE Company), Perkin Elmer, ThermoFisher Scientific Inc.
3. What are the main segments of the Cancer Sequencing Industry?
The market segments include Product Type, Technology.
4. Can you provide details about the market size?
The market size is estimated to be USD XX Million as of 2022.
5. What are some drivers contributing to market growth?
Growing Burden of Cancer; Initiatives taken by Companies in Product Development; Speed. Accuracy and Potential Replacement for Traditional Technologies to Spur Market Growth.
6. What are the notable trends driving market growth?
Genome Sequencing Segment is Expected to Hold a Major Market Share.
7. Are there any restraints impacting market growth?
Interpretation of Complex Data and Lack of Skilled Professionals; High Cost of Instruments and Procedures.
8. Can you provide examples of recent developments in the market?
February 2023: Oxford Nanopore Technologies announced the extension of its collaboration with UPS Healthcare to accelerate the delivery of Oxford Nanopore DNA/RNA sequencing products and consumables across the Asia Pacific region.
9. What pricing options are available for accessing the report?
Pricing options include single-user, multi-user, and enterprise licenses priced at USD 4750, USD 5250, and USD 8750 respectively.
10. Is the market size provided in terms of value or volume?
The market size is provided in terms of value, measured in Million and volume, measured in K Unit.
11. Are there any specific market keywords associated with the report?
Yes, the market keyword associated with the report is "Cancer Sequencing Industry," which aids in identifying and referencing the specific market segment covered.
12. How do I determine which pricing option suits my needs best?
The pricing options vary based on user requirements and access needs. Individual users may opt for single-user licenses, while businesses requiring broader access may choose multi-user or enterprise licenses for cost-effective access to the report.
13. Are there any additional resources or data provided in the Cancer Sequencing Industry report?
While the report offers comprehensive insights, it's advisable to review the specific contents or supplementary materials provided to ascertain if additional resources or data are available.
14. How can I stay updated on further developments or reports in the Cancer Sequencing Industry?
To stay informed about further developments, trends, and reports in the Cancer Sequencing Industry, consider subscribing to industry newsletters, following relevant companies and organizations, or regularly checking reputable industry news sources and publications.
Methodology
Step 1 - Identification of Relevant Samples Size from Population Database


Step 2 - Approaches for Defining Global Market Size (Value, Volume* & Price*)

Note*: In applicable scenarios
Step 3 - Data Sources
Primary Research
- Web Analytics
- Survey Reports
- Research Institute
- Latest Research Reports
- Opinion Leaders
Secondary Research
- Annual Reports
- White Paper
- Latest Press Release
- Industry Association
- Paid Database
- Investor Presentations

Step 4 - Data Triangulation
Involves using different sources of information in order to increase the validity of a study
These sources are likely to be stakeholders in a program - participants, other researchers, program staff, other community members, and so on.
Then we put all data in single framework & apply various statistical tools to find out the dynamic on the market.
During the analysis stage, feedback from the stakeholder groups would be compared to determine areas of agreement as well as areas of divergence


