
Key Insights
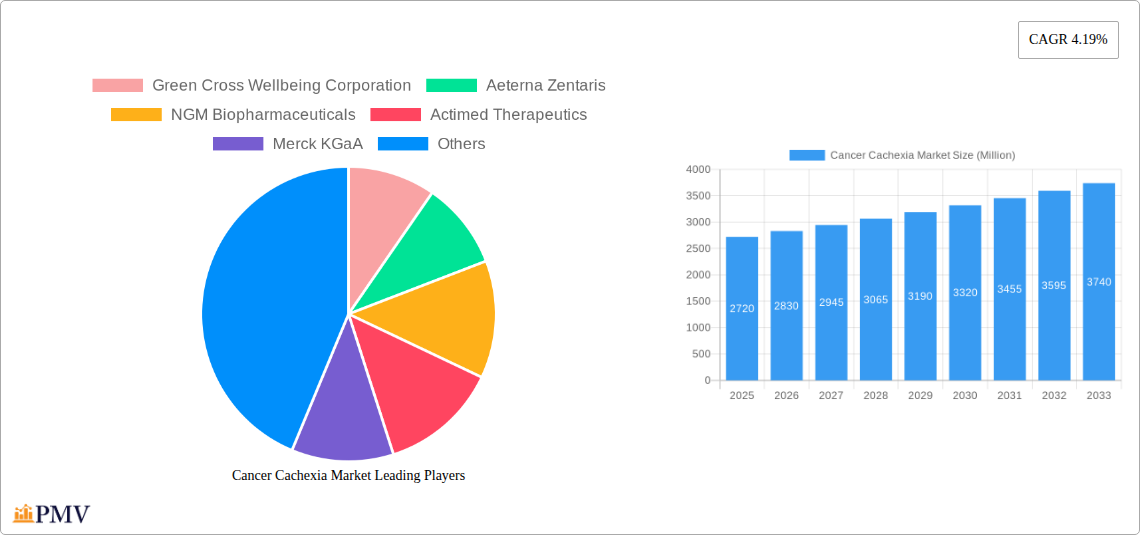
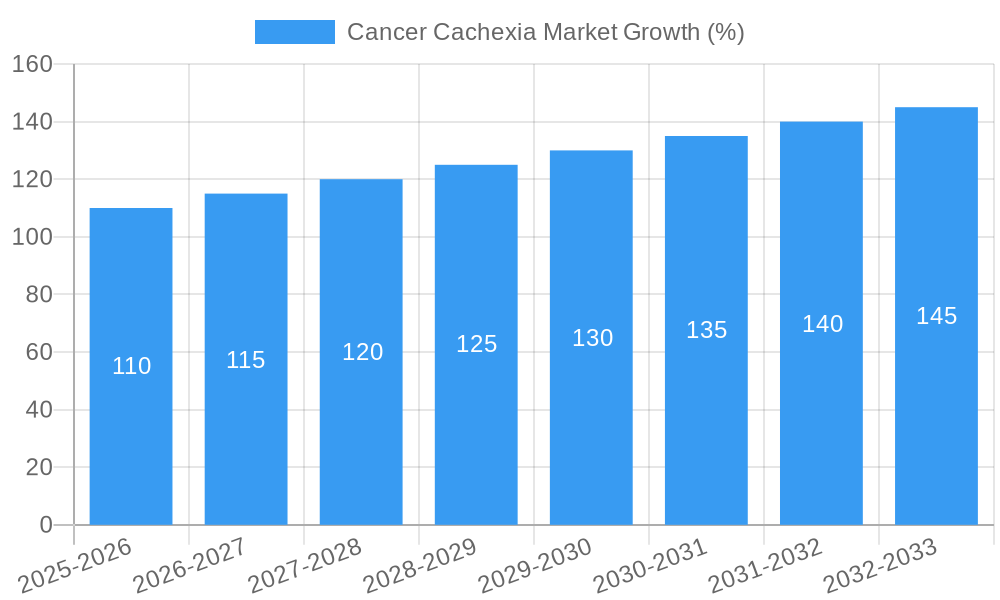
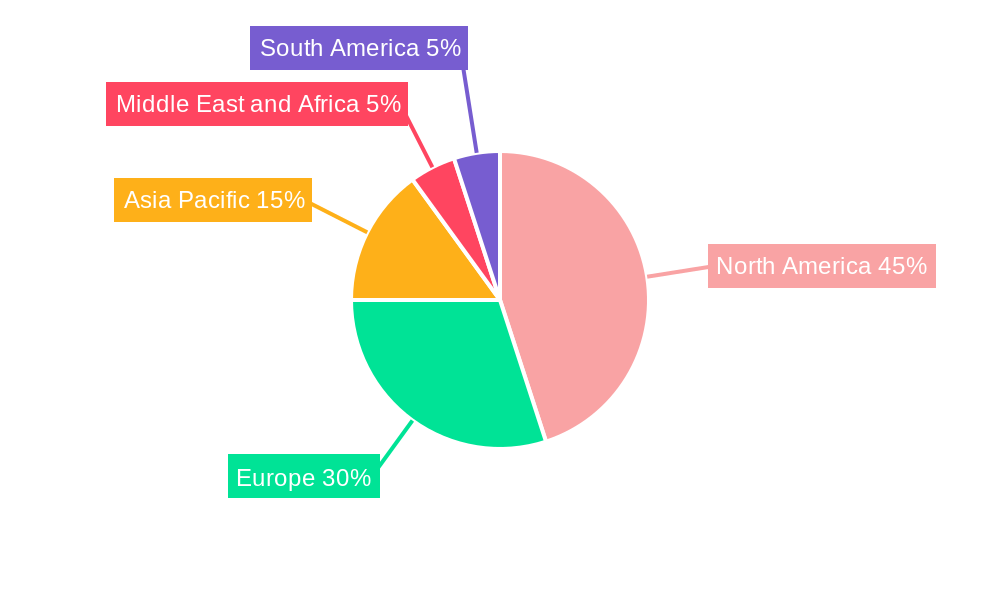
The global cancer cachexia market, valued at $2.72 billion in 2025, is projected to experience robust growth, driven by increasing cancer prevalence, a rising geriatric population, and heightened awareness of cachexia as a significant comorbidity impacting patient outcomes. The market's Compound Annual Growth Rate (CAGR) of 4.19% from 2019 to 2024 suggests a continued upward trajectory through 2033. Several factors contribute to this growth: the development and adoption of novel therapeutic approaches targeting specific mechanisms of cachexia, such as appetite stimulants and weight loss stabilizers; the increasing focus on personalized medicine tailored to individual patient needs and cancer types; and the expansion of supportive care interventions to improve quality of life for patients. Significant growth is expected in therapeutics such as progestogens, corticosteroids, and combination therapies, representing major segments within the market. While research and development continue to drive innovation, challenges remain, including the complexity of cachexia's pathophysiology and the need for more effective treatments with fewer side effects. Regional disparities also exist, with North America and Europe expected to dominate the market due to advanced healthcare infrastructure and higher healthcare spending, although emerging markets in Asia-Pacific are poised for substantial growth in the coming years.
The competitive landscape is characterized by a mix of established pharmaceutical companies and emerging biotech firms actively involved in research, development, and commercialization of cancer cachexia therapies. Key players such as Merck KGaA, Pfizer Inc., and Bristol-Myers Squibb Company are leveraging their expertise and resources to develop innovative solutions, while smaller companies contribute significantly to the pipeline of new drugs and treatment approaches. The market will likely witness increased strategic collaborations, mergers, and acquisitions as companies strive to strengthen their positions and expand their market reach. Future growth will largely depend on the success of clinical trials for novel therapies, regulatory approvals, and the increasing integration of supportive care services within oncology care pathways. Continuous advancements in understanding the intricate mechanisms driving cancer cachexia are crucial to developing truly effective and widely accessible treatments.
This in-depth report provides a comprehensive analysis of the Cancer Cachexia Market, offering actionable insights for stakeholders across the pharmaceutical and healthcare industries. With a study period spanning 2019-2033, a base year of 2025, and a forecast period of 2025-2033, this report meticulously examines market dynamics, competitive landscapes, and future growth potential. The market is projected to reach xx Million by 2033, exhibiting a significant CAGR.
Cancer Cachexia Market Market Structure & Competitive Dynamics
The Cancer Cachexia market presents a complex interplay of factors influencing its structure and competitive dynamics. Market concentration is currently [Insert Market Concentration Metric, e.g., moderately fragmented], with several key players vying for market share. The innovation ecosystem is characterized by significant R&D investment, particularly in novel therapeutics targeting different mechanisms of action. Regulatory frameworks, including FDA approvals and international guidelines, significantly impact market access and product lifecycle. The availability of supportive care and palliative treatments acts as a substitute to some extent, influencing treatment choices. End-user trends, primarily driven by an aging population and increased cancer incidence, fuel market growth. M&A activities have been [Insert Description, e.g., moderate], with deal values ranging from xx Million to xx Million in recent years. Key players have employed both organic and inorganic growth strategies, including strategic partnerships, licensing agreements and acquisitions. For instance, [mention a specific M&A event if data available]. The overall competitive landscape is [Insert Description, e.g., dynamic and competitive], characterized by intense rivalry and ongoing innovation.
- Market Share: [Insert market share data for top 3-5 players]
- M&A Deal Values: [Insert range of deal values observed]
- Regulatory Landscape: [Brief summary of key regulations impacting the market]
Cancer Cachexia Market Industry Trends & Insights
The Cancer Cachexia market is experiencing significant growth, driven by several key factors. Rising cancer incidence globally, coupled with an aging population, is a primary driver. Technological advancements in drug discovery and development are leading to innovative treatment approaches targeting diverse mechanisms of action, like appetite stimulants and weight loss stabilizers. Consumer preferences are shifting towards personalized medicine and improved quality of life, emphasizing the need for effective cachexia management. The competitive landscape is intense, with pharmaceutical companies investing heavily in R&D and strategic partnerships to gain a competitive edge. The market exhibits a [mention CAGR] growth rate, indicating strong potential for future expansion. Increased awareness about cachexia and improved diagnostic tools are further contributing to market growth. The market penetration of effective treatments remains relatively low, representing an area of significant future growth. The increasing prevalence of comorbidities alongside cancer is also contributing to the market's growth.
Dominant Markets & Segments in Cancer Cachexia Market
The [Insert Region/Country, e.g., North America] region currently dominates the Cancer Cachexia market, driven by factors such as high healthcare expenditure, advanced healthcare infrastructure, and higher cancer prevalence.
Key Drivers for Dominant Regions/Segments:
- North America: High healthcare expenditure, advanced infrastructure, robust clinical trials ecosystem.
- Europe: Growing awareness of cachexia, increasing government funding for research and development.
- Asia Pacific: Rising cancer incidence, growing healthcare spending, and increasing awareness of the disease.
Dominant Segments:
- Therapeutics: Combination therapy is expected to witness substantial growth owing to its synergistic effects and enhanced efficacy. Corticosteroids and Progestogens represent established treatment options, while the "Other Therapeutics" segment presents opportunities for novel treatment approaches.
- Mechanism of Action: Appetite stimulants are widely used and remain a dominant segment, but weight loss stabilizers represent a high-growth area due to an increasing understanding of the mechanisms underlying cachexia.
The dominance analysis reveals a clear trend toward [mention the dominant therapeutic and mechanism of action segment and reasoning]. Further research and development in [mention area of opportunity] holds considerable potential for future market expansion.
Cancer Cachexia Market Product Innovations
Recent product innovations focus on targeted therapies and improved drug delivery systems. The emergence of novel therapeutics targeting specific pathways involved in cachexia offers improved efficacy and reduced side effects. Technological advancements, such as nanotechnology-based drug delivery, are enhancing treatment outcomes. These innovations are contributing to a better market fit by addressing unmet needs and improving patient outcomes. The focus is on improving patient compliance, reducing adverse effects, and enhancing the quality of life for individuals suffering from cancer cachexia.
Report Segmentation & Scope
This report segments the Cancer Cachexia market based on therapeutics (Progestogens, Corticosteroids, Combination Therapy, Other Therapeutics) and mechanism of action (Appetite Stimulants, Weight Loss Stabilizers). Each segment is analyzed in detail, providing insights into market size, growth projections, and competitive dynamics. The "Other Therapeutics" segment represents a significant growth area due to ongoing R&D efforts targeting novel molecular pathways. The "Weight Loss Stabilizers" segment is expected to witness substantial growth in the coming years, driven by a better understanding of cachexia's underlying mechanisms. Projections for each segment are provided considering growth in each therapeutic modality and mechanism of action.
Key Drivers of Cancer Cachexia Market Growth
The Cancer Cachexia market is driven by several key factors: the rising incidence of cancer globally, increased life expectancy leading to a higher aging population, and growing awareness among healthcare professionals and patients about the disease. Technological advancements in therapeutics, such as improved drug delivery systems and targeted therapies, further propel market growth. Favorable regulatory environments and increased funding for research and development contribute significantly to market expansion. The demand for effective cachexia management to improve quality of life among cancer patients is a major catalyst.
Challenges in the Cancer Cachexia Market Sector
The Cancer Cachexia market faces several challenges, including the complexity of the disease, limited understanding of its underlying mechanisms, and the lack of widely effective treatments. Regulatory hurdles for new drug approvals and the high cost of drug development represent significant barriers. The need for extensive clinical trials to demonstrate efficacy and safety is time-consuming and expensive, impacting overall market growth. Competition among pharmaceutical companies and the potential for generic drug entry also pose significant challenges. The development of reliable and widely accessible diagnostic tools continues to be a major challenge.
Leading Players in the Cancer Cachexia Market Market
- Green Cross Wellbeing Corporation
- Aeterna Zentaris
- NGM Biopharmaceuticals
- Actimed Therapeutics
- Merck KGaA
- Fresenius Kabi
- Aavogen Inc
- TCI Peptide Therapeutics
- Cannabics Pharmaceuticals Inc
- Aveo Oncology
- Artelo Biosciences Inc
- Aphios Corporation
- Tetra Bio-Pharma
- Helsinn Group
- Bristol-Myers Squibb Company
- Pfizer Inc
Key Developments in Cancer Cachexia Market Sector
- June 2022: The team led by Rutgers Cancer Institute of New Jersey received a USD 25 Million Cancer Grand Challenges grant to research cancer cachexia. This signifies a significant investment in research and development, potentially leading to new treatment breakthroughs.
- August 2022: ARTHEx biotech launched ENTRY™, a platform advancing its pipeline of drugs, including those for cancer cachexia. This indicates an increased focus on innovative drug delivery systems and new therapeutic approaches.
Strategic Cancer Cachexia Market Market Outlook
The Cancer Cachexia market presents significant growth opportunities in the coming years. Further research and development will lead to the discovery and launch of novel therapeutics with enhanced efficacy and safety profiles. Strategic partnerships and collaborations between pharmaceutical companies and research institutions will play a crucial role in accelerating innovation. Focus on personalized medicine and improved diagnostic tools will enhance treatment outcomes and market expansion. The development of more effective supportive care measures combined with novel therapies offers a particularly promising avenue for growth.
Cancer Cachexia Market Segmentation
-
1. Therapeutics
- 1.1. Progestogens
- 1.2. Corticosteroids
- 1.3. Combination Therapy
- 1.4. Other Therapeutics
-
2. Mechanism of Action
- 2.1. Appetite Stimulators
- 2.2. Weight Loss Stabilizers
Cancer Cachexia Market Segmentation By Geography
-
1. North America
- 1.1. United States
- 1.2. Canada
- 1.3. Mexico
-
2. Europe
- 2.1. Germany
- 2.2. United Kingdom
- 2.3. France
- 2.4. Italy
- 2.5. Spain
- 2.6. Rest of Europe
-
3. Asia Pacific
- 3.1. China
- 3.2. Japan
- 3.3. India
- 3.4. Australia
- 3.5. South Korea
- 3.6. Rest of Asia Pacific
-
4. Middle East and Africa
- 4.1. GCC
- 4.2. South Africa
- 4.3. Rest of Middle East and Africa
-
5. South America
- 5.1. Brazil
- 5.2. Argentina
- 5.3. Rest of South America
Cancer Cachexia Market REPORT HIGHLIGHTS
| Aspects | Details |
|---|---|
| Study Period | 2019-2033 |
| Base Year | 2024 |
| Estimated Year | 2025 |
| Forecast Period | 2025-2033 |
| Historical Period | 2019-2024 |
| Growth Rate | CAGR of 4.19% from 2019-2033 |
| Segmentation |
|
Table of Contents
- 1. Introduction
- 1.1. Research Scope
- 1.2. Market Segmentation
- 1.3. Research Methodology
- 1.4. Definitions and Assumptions
- 2. Executive Summary
- 2.1. Introduction
- 3. Market Dynamics
- 3.1. Introduction
- 3.2. Market Drivers
- 3.2.1. Increasing Prevalence of Cancer Cachexia; Strong R&D and Product Pipeline
- 3.3. Market Restrains
- 3.3.1. Stringent Regulatory Requirements
- 3.4. Market Trends
- 3.4.1. Appetite Stimulators is Expected to Grow Significantly in the Cancer Cachexia Market
- 4. Market Factor Analysis
- 4.1. Porters Five Forces
- 4.2. Supply/Value Chain
- 4.3. PESTEL analysis
- 4.4. Market Entropy
- 4.5. Patent/Trademark Analysis
- 5. Global Cancer Cachexia Market Analysis, Insights and Forecast, 2019-2031
- 5.1. Market Analysis, Insights and Forecast - by Therapeutics
- 5.1.1. Progestogens
- 5.1.2. Corticosteroids
- 5.1.3. Combination Therapy
- 5.1.4. Other Therapeutics
- 5.2. Market Analysis, Insights and Forecast - by Mechanism of Action
- 5.2.1. Appetite Stimulators
- 5.2.2. Weight Loss Stabilizers
- 5.3. Market Analysis, Insights and Forecast - by Region
- 5.3.1. North America
- 5.3.2. Europe
- 5.3.3. Asia Pacific
- 5.3.4. Middle East and Africa
- 5.3.5. South America
- 5.1. Market Analysis, Insights and Forecast - by Therapeutics
- 6. North America Cancer Cachexia Market Analysis, Insights and Forecast, 2019-2031
- 6.1. Market Analysis, Insights and Forecast - by Therapeutics
- 6.1.1. Progestogens
- 6.1.2. Corticosteroids
- 6.1.3. Combination Therapy
- 6.1.4. Other Therapeutics
- 6.2. Market Analysis, Insights and Forecast - by Mechanism of Action
- 6.2.1. Appetite Stimulators
- 6.2.2. Weight Loss Stabilizers
- 6.1. Market Analysis, Insights and Forecast - by Therapeutics
- 7. Europe Cancer Cachexia Market Analysis, Insights and Forecast, 2019-2031
- 7.1. Market Analysis, Insights and Forecast - by Therapeutics
- 7.1.1. Progestogens
- 7.1.2. Corticosteroids
- 7.1.3. Combination Therapy
- 7.1.4. Other Therapeutics
- 7.2. Market Analysis, Insights and Forecast - by Mechanism of Action
- 7.2.1. Appetite Stimulators
- 7.2.2. Weight Loss Stabilizers
- 7.1. Market Analysis, Insights and Forecast - by Therapeutics
- 8. Asia Pacific Cancer Cachexia Market Analysis, Insights and Forecast, 2019-2031
- 8.1. Market Analysis, Insights and Forecast - by Therapeutics
- 8.1.1. Progestogens
- 8.1.2. Corticosteroids
- 8.1.3. Combination Therapy
- 8.1.4. Other Therapeutics
- 8.2. Market Analysis, Insights and Forecast - by Mechanism of Action
- 8.2.1. Appetite Stimulators
- 8.2.2. Weight Loss Stabilizers
- 8.1. Market Analysis, Insights and Forecast - by Therapeutics
- 9. Middle East and Africa Cancer Cachexia Market Analysis, Insights and Forecast, 2019-2031
- 9.1. Market Analysis, Insights and Forecast - by Therapeutics
- 9.1.1. Progestogens
- 9.1.2. Corticosteroids
- 9.1.3. Combination Therapy
- 9.1.4. Other Therapeutics
- 9.2. Market Analysis, Insights and Forecast - by Mechanism of Action
- 9.2.1. Appetite Stimulators
- 9.2.2. Weight Loss Stabilizers
- 9.1. Market Analysis, Insights and Forecast - by Therapeutics
- 10. South America Cancer Cachexia Market Analysis, Insights and Forecast, 2019-2031
- 10.1. Market Analysis, Insights and Forecast - by Therapeutics
- 10.1.1. Progestogens
- 10.1.2. Corticosteroids
- 10.1.3. Combination Therapy
- 10.1.4. Other Therapeutics
- 10.2. Market Analysis, Insights and Forecast - by Mechanism of Action
- 10.2.1. Appetite Stimulators
- 10.2.2. Weight Loss Stabilizers
- 10.1. Market Analysis, Insights and Forecast - by Therapeutics
- 11. North America Cancer Cachexia Market Analysis, Insights and Forecast, 2019-2031
- 11.1. Market Analysis, Insights and Forecast - By Country/Sub-region
- 11.1.1 United States
- 11.1.2 Canada
- 11.1.3 Mexico
- 12. Europe Cancer Cachexia Market Analysis, Insights and Forecast, 2019-2031
- 12.1. Market Analysis, Insights and Forecast - By Country/Sub-region
- 12.1.1 Germany
- 12.1.2 United Kingdom
- 12.1.3 France
- 12.1.4 Italy
- 12.1.5 Spain
- 12.1.6 Rest of Europe
- 13. Asia Pacific Cancer Cachexia Market Analysis, Insights and Forecast, 2019-2031
- 13.1. Market Analysis, Insights and Forecast - By Country/Sub-region
- 13.1.1 China
- 13.1.2 Japan
- 13.1.3 India
- 13.1.4 Australia
- 13.1.5 South Korea
- 13.1.6 Rest of Asia Pacific
- 14. Middle East and Africa Cancer Cachexia Market Analysis, Insights and Forecast, 2019-2031
- 14.1. Market Analysis, Insights and Forecast - By Country/Sub-region
- 14.1.1 GCC
- 14.1.2 South Africa
- 14.1.3 Rest of Middle East and Africa
- 15. South America Cancer Cachexia Market Analysis, Insights and Forecast, 2019-2031
- 15.1. Market Analysis, Insights and Forecast - By Country/Sub-region
- 15.1.1 Brazil
- 15.1.2 Argentina
- 15.1.3 Rest of South America
- 16. Competitive Analysis
- 16.1. Global Market Share Analysis 2024
- 16.2. Company Profiles
- 16.2.1 Green Cross Wellbeing Corporation
- 16.2.1.1. Overview
- 16.2.1.2. Products
- 16.2.1.3. SWOT Analysis
- 16.2.1.4. Recent Developments
- 16.2.1.5. Financials (Based on Availability)
- 16.2.2 Aeterna Zentaris
- 16.2.2.1. Overview
- 16.2.2.2. Products
- 16.2.2.3. SWOT Analysis
- 16.2.2.4. Recent Developments
- 16.2.2.5. Financials (Based on Availability)
- 16.2.3 NGM Biopharmaceuticals
- 16.2.3.1. Overview
- 16.2.3.2. Products
- 16.2.3.3. SWOT Analysis
- 16.2.3.4. Recent Developments
- 16.2.3.5. Financials (Based on Availability)
- 16.2.4 Actimed Therapeutics
- 16.2.4.1. Overview
- 16.2.4.2. Products
- 16.2.4.3. SWOT Analysis
- 16.2.4.4. Recent Developments
- 16.2.4.5. Financials (Based on Availability)
- 16.2.5 Merck KGaA
- 16.2.5.1. Overview
- 16.2.5.2. Products
- 16.2.5.3. SWOT Analysis
- 16.2.5.4. Recent Developments
- 16.2.5.5. Financials (Based on Availability)
- 16.2.6 Fresenius Kabi
- 16.2.6.1. Overview
- 16.2.6.2. Products
- 16.2.6.3. SWOT Analysis
- 16.2.6.4. Recent Developments
- 16.2.6.5. Financials (Based on Availability)
- 16.2.7 Aavogen Inc
- 16.2.7.1. Overview
- 16.2.7.2. Products
- 16.2.7.3. SWOT Analysis
- 16.2.7.4. Recent Developments
- 16.2.7.5. Financials (Based on Availability)
- 16.2.8 TCI Peptide Therapeutics
- 16.2.8.1. Overview
- 16.2.8.2. Products
- 16.2.8.3. SWOT Analysis
- 16.2.8.4. Recent Developments
- 16.2.8.5. Financials (Based on Availability)
- 16.2.9 Cannabics Pharmaceuticals Inc
- 16.2.9.1. Overview
- 16.2.9.2. Products
- 16.2.9.3. SWOT Analysis
- 16.2.9.4. Recent Developments
- 16.2.9.5. Financials (Based on Availability)
- 16.2.10 Aveo Oncology
- 16.2.10.1. Overview
- 16.2.10.2. Products
- 16.2.10.3. SWOT Analysis
- 16.2.10.4. Recent Developments
- 16.2.10.5. Financials (Based on Availability)
- 16.2.11 Artelo Biosciences Inc
- 16.2.11.1. Overview
- 16.2.11.2. Products
- 16.2.11.3. SWOT Analysis
- 16.2.11.4. Recent Developments
- 16.2.11.5. Financials (Based on Availability)
- 16.2.12 Aphios Corporation
- 16.2.12.1. Overview
- 16.2.12.2. Products
- 16.2.12.3. SWOT Analysis
- 16.2.12.4. Recent Developments
- 16.2.12.5. Financials (Based on Availability)
- 16.2.13 Tetra Bio-Pharma
- 16.2.13.1. Overview
- 16.2.13.2. Products
- 16.2.13.3. SWOT Analysis
- 16.2.13.4. Recent Developments
- 16.2.13.5. Financials (Based on Availability)
- 16.2.14 Helsinn Group
- 16.2.14.1. Overview
- 16.2.14.2. Products
- 16.2.14.3. SWOT Analysis
- 16.2.14.4. Recent Developments
- 16.2.14.5. Financials (Based on Availability)
- 16.2.15 Bristol-Myers Squibb Company
- 16.2.15.1. Overview
- 16.2.15.2. Products
- 16.2.15.3. SWOT Analysis
- 16.2.15.4. Recent Developments
- 16.2.15.5. Financials (Based on Availability)
- 16.2.16 Pfizer Inc
- 16.2.16.1. Overview
- 16.2.16.2. Products
- 16.2.16.3. SWOT Analysis
- 16.2.16.4. Recent Developments
- 16.2.16.5. Financials (Based on Availability)
- 16.2.1 Green Cross Wellbeing Corporation
List of Figures
- Figure 1: Global Cancer Cachexia Market Revenue Breakdown (Million, %) by Region 2024 & 2032
- Figure 2: Global Cancer Cachexia Market Volume Breakdown (K Unit, %) by Region 2024 & 2032
- Figure 3: North America Cancer Cachexia Market Revenue (Million), by Country 2024 & 2032
- Figure 4: North America Cancer Cachexia Market Volume (K Unit), by Country 2024 & 2032
- Figure 5: North America Cancer Cachexia Market Revenue Share (%), by Country 2024 & 2032
- Figure 6: North America Cancer Cachexia Market Volume Share (%), by Country 2024 & 2032
- Figure 7: Europe Cancer Cachexia Market Revenue (Million), by Country 2024 & 2032
- Figure 8: Europe Cancer Cachexia Market Volume (K Unit), by Country 2024 & 2032
- Figure 9: Europe Cancer Cachexia Market Revenue Share (%), by Country 2024 & 2032
- Figure 10: Europe Cancer Cachexia Market Volume Share (%), by Country 2024 & 2032
- Figure 11: Asia Pacific Cancer Cachexia Market Revenue (Million), by Country 2024 & 2032
- Figure 12: Asia Pacific Cancer Cachexia Market Volume (K Unit), by Country 2024 & 2032
- Figure 13: Asia Pacific Cancer Cachexia Market Revenue Share (%), by Country 2024 & 2032
- Figure 14: Asia Pacific Cancer Cachexia Market Volume Share (%), by Country 2024 & 2032
- Figure 15: Middle East and Africa Cancer Cachexia Market Revenue (Million), by Country 2024 & 2032
- Figure 16: Middle East and Africa Cancer Cachexia Market Volume (K Unit), by Country 2024 & 2032
- Figure 17: Middle East and Africa Cancer Cachexia Market Revenue Share (%), by Country 2024 & 2032
- Figure 18: Middle East and Africa Cancer Cachexia Market Volume Share (%), by Country 2024 & 2032
- Figure 19: South America Cancer Cachexia Market Revenue (Million), by Country 2024 & 2032
- Figure 20: South America Cancer Cachexia Market Volume (K Unit), by Country 2024 & 2032
- Figure 21: South America Cancer Cachexia Market Revenue Share (%), by Country 2024 & 2032
- Figure 22: South America Cancer Cachexia Market Volume Share (%), by Country 2024 & 2032
- Figure 23: North America Cancer Cachexia Market Revenue (Million), by Therapeutics 2024 & 2032
- Figure 24: North America Cancer Cachexia Market Volume (K Unit), by Therapeutics 2024 & 2032
- Figure 25: North America Cancer Cachexia Market Revenue Share (%), by Therapeutics 2024 & 2032
- Figure 26: North America Cancer Cachexia Market Volume Share (%), by Therapeutics 2024 & 2032
- Figure 27: North America Cancer Cachexia Market Revenue (Million), by Mechanism of Action 2024 & 2032
- Figure 28: North America Cancer Cachexia Market Volume (K Unit), by Mechanism of Action 2024 & 2032
- Figure 29: North America Cancer Cachexia Market Revenue Share (%), by Mechanism of Action 2024 & 2032
- Figure 30: North America Cancer Cachexia Market Volume Share (%), by Mechanism of Action 2024 & 2032
- Figure 31: North America Cancer Cachexia Market Revenue (Million), by Country 2024 & 2032
- Figure 32: North America Cancer Cachexia Market Volume (K Unit), by Country 2024 & 2032
- Figure 33: North America Cancer Cachexia Market Revenue Share (%), by Country 2024 & 2032
- Figure 34: North America Cancer Cachexia Market Volume Share (%), by Country 2024 & 2032
- Figure 35: Europe Cancer Cachexia Market Revenue (Million), by Therapeutics 2024 & 2032
- Figure 36: Europe Cancer Cachexia Market Volume (K Unit), by Therapeutics 2024 & 2032
- Figure 37: Europe Cancer Cachexia Market Revenue Share (%), by Therapeutics 2024 & 2032
- Figure 38: Europe Cancer Cachexia Market Volume Share (%), by Therapeutics 2024 & 2032
- Figure 39: Europe Cancer Cachexia Market Revenue (Million), by Mechanism of Action 2024 & 2032
- Figure 40: Europe Cancer Cachexia Market Volume (K Unit), by Mechanism of Action 2024 & 2032
- Figure 41: Europe Cancer Cachexia Market Revenue Share (%), by Mechanism of Action 2024 & 2032
- Figure 42: Europe Cancer Cachexia Market Volume Share (%), by Mechanism of Action 2024 & 2032
- Figure 43: Europe Cancer Cachexia Market Revenue (Million), by Country 2024 & 2032
- Figure 44: Europe Cancer Cachexia Market Volume (K Unit), by Country 2024 & 2032
- Figure 45: Europe Cancer Cachexia Market Revenue Share (%), by Country 2024 & 2032
- Figure 46: Europe Cancer Cachexia Market Volume Share (%), by Country 2024 & 2032
- Figure 47: Asia Pacific Cancer Cachexia Market Revenue (Million), by Therapeutics 2024 & 2032
- Figure 48: Asia Pacific Cancer Cachexia Market Volume (K Unit), by Therapeutics 2024 & 2032
- Figure 49: Asia Pacific Cancer Cachexia Market Revenue Share (%), by Therapeutics 2024 & 2032
- Figure 50: Asia Pacific Cancer Cachexia Market Volume Share (%), by Therapeutics 2024 & 2032
- Figure 51: Asia Pacific Cancer Cachexia Market Revenue (Million), by Mechanism of Action 2024 & 2032
- Figure 52: Asia Pacific Cancer Cachexia Market Volume (K Unit), by Mechanism of Action 2024 & 2032
- Figure 53: Asia Pacific Cancer Cachexia Market Revenue Share (%), by Mechanism of Action 2024 & 2032
- Figure 54: Asia Pacific Cancer Cachexia Market Volume Share (%), by Mechanism of Action 2024 & 2032
- Figure 55: Asia Pacific Cancer Cachexia Market Revenue (Million), by Country 2024 & 2032
- Figure 56: Asia Pacific Cancer Cachexia Market Volume (K Unit), by Country 2024 & 2032
- Figure 57: Asia Pacific Cancer Cachexia Market Revenue Share (%), by Country 2024 & 2032
- Figure 58: Asia Pacific Cancer Cachexia Market Volume Share (%), by Country 2024 & 2032
- Figure 59: Middle East and Africa Cancer Cachexia Market Revenue (Million), by Therapeutics 2024 & 2032
- Figure 60: Middle East and Africa Cancer Cachexia Market Volume (K Unit), by Therapeutics 2024 & 2032
- Figure 61: Middle East and Africa Cancer Cachexia Market Revenue Share (%), by Therapeutics 2024 & 2032
- Figure 62: Middle East and Africa Cancer Cachexia Market Volume Share (%), by Therapeutics 2024 & 2032
- Figure 63: Middle East and Africa Cancer Cachexia Market Revenue (Million), by Mechanism of Action 2024 & 2032
- Figure 64: Middle East and Africa Cancer Cachexia Market Volume (K Unit), by Mechanism of Action 2024 & 2032
- Figure 65: Middle East and Africa Cancer Cachexia Market Revenue Share (%), by Mechanism of Action 2024 & 2032
- Figure 66: Middle East and Africa Cancer Cachexia Market Volume Share (%), by Mechanism of Action 2024 & 2032
- Figure 67: Middle East and Africa Cancer Cachexia Market Revenue (Million), by Country 2024 & 2032
- Figure 68: Middle East and Africa Cancer Cachexia Market Volume (K Unit), by Country 2024 & 2032
- Figure 69: Middle East and Africa Cancer Cachexia Market Revenue Share (%), by Country 2024 & 2032
- Figure 70: Middle East and Africa Cancer Cachexia Market Volume Share (%), by Country 2024 & 2032
- Figure 71: South America Cancer Cachexia Market Revenue (Million), by Therapeutics 2024 & 2032
- Figure 72: South America Cancer Cachexia Market Volume (K Unit), by Therapeutics 2024 & 2032
- Figure 73: South America Cancer Cachexia Market Revenue Share (%), by Therapeutics 2024 & 2032
- Figure 74: South America Cancer Cachexia Market Volume Share (%), by Therapeutics 2024 & 2032
- Figure 75: South America Cancer Cachexia Market Revenue (Million), by Mechanism of Action 2024 & 2032
- Figure 76: South America Cancer Cachexia Market Volume (K Unit), by Mechanism of Action 2024 & 2032
- Figure 77: South America Cancer Cachexia Market Revenue Share (%), by Mechanism of Action 2024 & 2032
- Figure 78: South America Cancer Cachexia Market Volume Share (%), by Mechanism of Action 2024 & 2032
- Figure 79: South America Cancer Cachexia Market Revenue (Million), by Country 2024 & 2032
- Figure 80: South America Cancer Cachexia Market Volume (K Unit), by Country 2024 & 2032
- Figure 81: South America Cancer Cachexia Market Revenue Share (%), by Country 2024 & 2032
- Figure 82: South America Cancer Cachexia Market Volume Share (%), by Country 2024 & 2032
List of Tables
- Table 1: Global Cancer Cachexia Market Revenue Million Forecast, by Region 2019 & 2032
- Table 2: Global Cancer Cachexia Market Volume K Unit Forecast, by Region 2019 & 2032
- Table 3: Global Cancer Cachexia Market Revenue Million Forecast, by Therapeutics 2019 & 2032
- Table 4: Global Cancer Cachexia Market Volume K Unit Forecast, by Therapeutics 2019 & 2032
- Table 5: Global Cancer Cachexia Market Revenue Million Forecast, by Mechanism of Action 2019 & 2032
- Table 6: Global Cancer Cachexia Market Volume K Unit Forecast, by Mechanism of Action 2019 & 2032
- Table 7: Global Cancer Cachexia Market Revenue Million Forecast, by Region 2019 & 2032
- Table 8: Global Cancer Cachexia Market Volume K Unit Forecast, by Region 2019 & 2032
- Table 9: Global Cancer Cachexia Market Revenue Million Forecast, by Country 2019 & 2032
- Table 10: Global Cancer Cachexia Market Volume K Unit Forecast, by Country 2019 & 2032
- Table 11: United States Cancer Cachexia Market Revenue (Million) Forecast, by Application 2019 & 2032
- Table 12: United States Cancer Cachexia Market Volume (K Unit) Forecast, by Application 2019 & 2032
- Table 13: Canada Cancer Cachexia Market Revenue (Million) Forecast, by Application 2019 & 2032
- Table 14: Canada Cancer Cachexia Market Volume (K Unit) Forecast, by Application 2019 & 2032
- Table 15: Mexico Cancer Cachexia Market Revenue (Million) Forecast, by Application 2019 & 2032
- Table 16: Mexico Cancer Cachexia Market Volume (K Unit) Forecast, by Application 2019 & 2032
- Table 17: Global Cancer Cachexia Market Revenue Million Forecast, by Country 2019 & 2032
- Table 18: Global Cancer Cachexia Market Volume K Unit Forecast, by Country 2019 & 2032
- Table 19: Germany Cancer Cachexia Market Revenue (Million) Forecast, by Application 2019 & 2032
- Table 20: Germany Cancer Cachexia Market Volume (K Unit) Forecast, by Application 2019 & 2032
- Table 21: United Kingdom Cancer Cachexia Market Revenue (Million) Forecast, by Application 2019 & 2032
- Table 22: United Kingdom Cancer Cachexia Market Volume (K Unit) Forecast, by Application 2019 & 2032
- Table 23: France Cancer Cachexia Market Revenue (Million) Forecast, by Application 2019 & 2032
- Table 24: France Cancer Cachexia Market Volume (K Unit) Forecast, by Application 2019 & 2032
- Table 25: Italy Cancer Cachexia Market Revenue (Million) Forecast, by Application 2019 & 2032
- Table 26: Italy Cancer Cachexia Market Volume (K Unit) Forecast, by Application 2019 & 2032
- Table 27: Spain Cancer Cachexia Market Revenue (Million) Forecast, by Application 2019 & 2032
- Table 28: Spain Cancer Cachexia Market Volume (K Unit) Forecast, by Application 2019 & 2032
- Table 29: Rest of Europe Cancer Cachexia Market Revenue (Million) Forecast, by Application 2019 & 2032
- Table 30: Rest of Europe Cancer Cachexia Market Volume (K Unit) Forecast, by Application 2019 & 2032
- Table 31: Global Cancer Cachexia Market Revenue Million Forecast, by Country 2019 & 2032
- Table 32: Global Cancer Cachexia Market Volume K Unit Forecast, by Country 2019 & 2032
- Table 33: China Cancer Cachexia Market Revenue (Million) Forecast, by Application 2019 & 2032
- Table 34: China Cancer Cachexia Market Volume (K Unit) Forecast, by Application 2019 & 2032
- Table 35: Japan Cancer Cachexia Market Revenue (Million) Forecast, by Application 2019 & 2032
- Table 36: Japan Cancer Cachexia Market Volume (K Unit) Forecast, by Application 2019 & 2032
- Table 37: India Cancer Cachexia Market Revenue (Million) Forecast, by Application 2019 & 2032
- Table 38: India Cancer Cachexia Market Volume (K Unit) Forecast, by Application 2019 & 2032
- Table 39: Australia Cancer Cachexia Market Revenue (Million) Forecast, by Application 2019 & 2032
- Table 40: Australia Cancer Cachexia Market Volume (K Unit) Forecast, by Application 2019 & 2032
- Table 41: South Korea Cancer Cachexia Market Revenue (Million) Forecast, by Application 2019 & 2032
- Table 42: South Korea Cancer Cachexia Market Volume (K Unit) Forecast, by Application 2019 & 2032
- Table 43: Rest of Asia Pacific Cancer Cachexia Market Revenue (Million) Forecast, by Application 2019 & 2032
- Table 44: Rest of Asia Pacific Cancer Cachexia Market Volume (K Unit) Forecast, by Application 2019 & 2032
- Table 45: Global Cancer Cachexia Market Revenue Million Forecast, by Country 2019 & 2032
- Table 46: Global Cancer Cachexia Market Volume K Unit Forecast, by Country 2019 & 2032
- Table 47: GCC Cancer Cachexia Market Revenue (Million) Forecast, by Application 2019 & 2032
- Table 48: GCC Cancer Cachexia Market Volume (K Unit) Forecast, by Application 2019 & 2032
- Table 49: South Africa Cancer Cachexia Market Revenue (Million) Forecast, by Application 2019 & 2032
- Table 50: South Africa Cancer Cachexia Market Volume (K Unit) Forecast, by Application 2019 & 2032
- Table 51: Rest of Middle East and Africa Cancer Cachexia Market Revenue (Million) Forecast, by Application 2019 & 2032
- Table 52: Rest of Middle East and Africa Cancer Cachexia Market Volume (K Unit) Forecast, by Application 2019 & 2032
- Table 53: Global Cancer Cachexia Market Revenue Million Forecast, by Country 2019 & 2032
- Table 54: Global Cancer Cachexia Market Volume K Unit Forecast, by Country 2019 & 2032
- Table 55: Brazil Cancer Cachexia Market Revenue (Million) Forecast, by Application 2019 & 2032
- Table 56: Brazil Cancer Cachexia Market Volume (K Unit) Forecast, by Application 2019 & 2032
- Table 57: Argentina Cancer Cachexia Market Revenue (Million) Forecast, by Application 2019 & 2032
- Table 58: Argentina Cancer Cachexia Market Volume (K Unit) Forecast, by Application 2019 & 2032
- Table 59: Rest of South America Cancer Cachexia Market Revenue (Million) Forecast, by Application 2019 & 2032
- Table 60: Rest of South America Cancer Cachexia Market Volume (K Unit) Forecast, by Application 2019 & 2032
- Table 61: Global Cancer Cachexia Market Revenue Million Forecast, by Therapeutics 2019 & 2032
- Table 62: Global Cancer Cachexia Market Volume K Unit Forecast, by Therapeutics 2019 & 2032
- Table 63: Global Cancer Cachexia Market Revenue Million Forecast, by Mechanism of Action 2019 & 2032
- Table 64: Global Cancer Cachexia Market Volume K Unit Forecast, by Mechanism of Action 2019 & 2032
- Table 65: Global Cancer Cachexia Market Revenue Million Forecast, by Country 2019 & 2032
- Table 66: Global Cancer Cachexia Market Volume K Unit Forecast, by Country 2019 & 2032
- Table 67: United States Cancer Cachexia Market Revenue (Million) Forecast, by Application 2019 & 2032
- Table 68: United States Cancer Cachexia Market Volume (K Unit) Forecast, by Application 2019 & 2032
- Table 69: Canada Cancer Cachexia Market Revenue (Million) Forecast, by Application 2019 & 2032
- Table 70: Canada Cancer Cachexia Market Volume (K Unit) Forecast, by Application 2019 & 2032
- Table 71: Mexico Cancer Cachexia Market Revenue (Million) Forecast, by Application 2019 & 2032
- Table 72: Mexico Cancer Cachexia Market Volume (K Unit) Forecast, by Application 2019 & 2032
- Table 73: Global Cancer Cachexia Market Revenue Million Forecast, by Therapeutics 2019 & 2032
- Table 74: Global Cancer Cachexia Market Volume K Unit Forecast, by Therapeutics 2019 & 2032
- Table 75: Global Cancer Cachexia Market Revenue Million Forecast, by Mechanism of Action 2019 & 2032
- Table 76: Global Cancer Cachexia Market Volume K Unit Forecast, by Mechanism of Action 2019 & 2032
- Table 77: Global Cancer Cachexia Market Revenue Million Forecast, by Country 2019 & 2032
- Table 78: Global Cancer Cachexia Market Volume K Unit Forecast, by Country 2019 & 2032
- Table 79: Germany Cancer Cachexia Market Revenue (Million) Forecast, by Application 2019 & 2032
- Table 80: Germany Cancer Cachexia Market Volume (K Unit) Forecast, by Application 2019 & 2032
- Table 81: United Kingdom Cancer Cachexia Market Revenue (Million) Forecast, by Application 2019 & 2032
- Table 82: United Kingdom Cancer Cachexia Market Volume (K Unit) Forecast, by Application 2019 & 2032
- Table 83: France Cancer Cachexia Market Revenue (Million) Forecast, by Application 2019 & 2032
- Table 84: France Cancer Cachexia Market Volume (K Unit) Forecast, by Application 2019 & 2032
- Table 85: Italy Cancer Cachexia Market Revenue (Million) Forecast, by Application 2019 & 2032
- Table 86: Italy Cancer Cachexia Market Volume (K Unit) Forecast, by Application 2019 & 2032
- Table 87: Spain Cancer Cachexia Market Revenue (Million) Forecast, by Application 2019 & 2032
- Table 88: Spain Cancer Cachexia Market Volume (K Unit) Forecast, by Application 2019 & 2032
- Table 89: Rest of Europe Cancer Cachexia Market Revenue (Million) Forecast, by Application 2019 & 2032
- Table 90: Rest of Europe Cancer Cachexia Market Volume (K Unit) Forecast, by Application 2019 & 2032
- Table 91: Global Cancer Cachexia Market Revenue Million Forecast, by Therapeutics 2019 & 2032
- Table 92: Global Cancer Cachexia Market Volume K Unit Forecast, by Therapeutics 2019 & 2032
- Table 93: Global Cancer Cachexia Market Revenue Million Forecast, by Mechanism of Action 2019 & 2032
- Table 94: Global Cancer Cachexia Market Volume K Unit Forecast, by Mechanism of Action 2019 & 2032
- Table 95: Global Cancer Cachexia Market Revenue Million Forecast, by Country 2019 & 2032
- Table 96: Global Cancer Cachexia Market Volume K Unit Forecast, by Country 2019 & 2032
- Table 97: China Cancer Cachexia Market Revenue (Million) Forecast, by Application 2019 & 2032
- Table 98: China Cancer Cachexia Market Volume (K Unit) Forecast, by Application 2019 & 2032
- Table 99: Japan Cancer Cachexia Market Revenue (Million) Forecast, by Application 2019 & 2032
- Table 100: Japan Cancer Cachexia Market Volume (K Unit) Forecast, by Application 2019 & 2032
- Table 101: India Cancer Cachexia Market Revenue (Million) Forecast, by Application 2019 & 2032
- Table 102: India Cancer Cachexia Market Volume (K Unit) Forecast, by Application 2019 & 2032
- Table 103: Australia Cancer Cachexia Market Revenue (Million) Forecast, by Application 2019 & 2032
- Table 104: Australia Cancer Cachexia Market Volume (K Unit) Forecast, by Application 2019 & 2032
- Table 105: South Korea Cancer Cachexia Market Revenue (Million) Forecast, by Application 2019 & 2032
- Table 106: South Korea Cancer Cachexia Market Volume (K Unit) Forecast, by Application 2019 & 2032
- Table 107: Rest of Asia Pacific Cancer Cachexia Market Revenue (Million) Forecast, by Application 2019 & 2032
- Table 108: Rest of Asia Pacific Cancer Cachexia Market Volume (K Unit) Forecast, by Application 2019 & 2032
- Table 109: Global Cancer Cachexia Market Revenue Million Forecast, by Therapeutics 2019 & 2032
- Table 110: Global Cancer Cachexia Market Volume K Unit Forecast, by Therapeutics 2019 & 2032
- Table 111: Global Cancer Cachexia Market Revenue Million Forecast, by Mechanism of Action 2019 & 2032
- Table 112: Global Cancer Cachexia Market Volume K Unit Forecast, by Mechanism of Action 2019 & 2032
- Table 113: Global Cancer Cachexia Market Revenue Million Forecast, by Country 2019 & 2032
- Table 114: Global Cancer Cachexia Market Volume K Unit Forecast, by Country 2019 & 2032
- Table 115: GCC Cancer Cachexia Market Revenue (Million) Forecast, by Application 2019 & 2032
- Table 116: GCC Cancer Cachexia Market Volume (K Unit) Forecast, by Application 2019 & 2032
- Table 117: South Africa Cancer Cachexia Market Revenue (Million) Forecast, by Application 2019 & 2032
- Table 118: South Africa Cancer Cachexia Market Volume (K Unit) Forecast, by Application 2019 & 2032
- Table 119: Rest of Middle East and Africa Cancer Cachexia Market Revenue (Million) Forecast, by Application 2019 & 2032
- Table 120: Rest of Middle East and Africa Cancer Cachexia Market Volume (K Unit) Forecast, by Application 2019 & 2032
- Table 121: Global Cancer Cachexia Market Revenue Million Forecast, by Therapeutics 2019 & 2032
- Table 122: Global Cancer Cachexia Market Volume K Unit Forecast, by Therapeutics 2019 & 2032
- Table 123: Global Cancer Cachexia Market Revenue Million Forecast, by Mechanism of Action 2019 & 2032
- Table 124: Global Cancer Cachexia Market Volume K Unit Forecast, by Mechanism of Action 2019 & 2032
- Table 125: Global Cancer Cachexia Market Revenue Million Forecast, by Country 2019 & 2032
- Table 126: Global Cancer Cachexia Market Volume K Unit Forecast, by Country 2019 & 2032
- Table 127: Brazil Cancer Cachexia Market Revenue (Million) Forecast, by Application 2019 & 2032
- Table 128: Brazil Cancer Cachexia Market Volume (K Unit) Forecast, by Application 2019 & 2032
- Table 129: Argentina Cancer Cachexia Market Revenue (Million) Forecast, by Application 2019 & 2032
- Table 130: Argentina Cancer Cachexia Market Volume (K Unit) Forecast, by Application 2019 & 2032
- Table 131: Rest of South America Cancer Cachexia Market Revenue (Million) Forecast, by Application 2019 & 2032
- Table 132: Rest of South America Cancer Cachexia Market Volume (K Unit) Forecast, by Application 2019 & 2032
Frequently Asked Questions
1. What is the projected Compound Annual Growth Rate (CAGR) of the Cancer Cachexia Market?
The projected CAGR is approximately 4.19%.
2. Which companies are prominent players in the Cancer Cachexia Market?
Key companies in the market include Green Cross Wellbeing Corporation, Aeterna Zentaris, NGM Biopharmaceuticals, Actimed Therapeutics, Merck KGaA, Fresenius Kabi, Aavogen Inc, TCI Peptide Therapeutics, Cannabics Pharmaceuticals Inc, Aveo Oncology, Artelo Biosciences Inc, Aphios Corporation, Tetra Bio-Pharma, Helsinn Group, Bristol-Myers Squibb Company, Pfizer Inc.
3. What are the main segments of the Cancer Cachexia Market?
The market segments include Therapeutics, Mechanism of Action.
4. Can you provide details about the market size?
The market size is estimated to be USD 2.72 Million as of 2022.
5. What are some drivers contributing to market growth?
Increasing Prevalence of Cancer Cachexia; Strong R&D and Product Pipeline.
6. What are the notable trends driving market growth?
Appetite Stimulators is Expected to Grow Significantly in the Cancer Cachexia Market.
7. Are there any restraints impacting market growth?
Stringent Regulatory Requirements.
8. Can you provide examples of recent developments in the market?
August 2022: ARTHEx biotech launched ENTRYTM , a platform that will allow it to advance its pipeline of drugs that includes drugs for myotonic dystrophy, cancer cachexia, and osteoarthritis by providing tissue-enriched delivery of antimiRs.
9. What pricing options are available for accessing the report?
Pricing options include single-user, multi-user, and enterprise licenses priced at USD 4750, USD 5250, and USD 8750 respectively.
10. Is the market size provided in terms of value or volume?
The market size is provided in terms of value, measured in Million and volume, measured in K Unit.
11. Are there any specific market keywords associated with the report?
Yes, the market keyword associated with the report is "Cancer Cachexia Market," which aids in identifying and referencing the specific market segment covered.
12. How do I determine which pricing option suits my needs best?
The pricing options vary based on user requirements and access needs. Individual users may opt for single-user licenses, while businesses requiring broader access may choose multi-user or enterprise licenses for cost-effective access to the report.
13. Are there any additional resources or data provided in the Cancer Cachexia Market report?
While the report offers comprehensive insights, it's advisable to review the specific contents or supplementary materials provided to ascertain if additional resources or data are available.
14. How can I stay updated on further developments or reports in the Cancer Cachexia Market?
To stay informed about further developments, trends, and reports in the Cancer Cachexia Market, consider subscribing to industry newsletters, following relevant companies and organizations, or regularly checking reputable industry news sources and publications.
Methodology
Step 1 - Identification of Relevant Samples Size from Population Database


Step 2 - Approaches for Defining Global Market Size (Value, Volume* & Price*)

Note*: In applicable scenarios
Step 3 - Data Sources
Primary Research
- Web Analytics
- Survey Reports
- Research Institute
- Latest Research Reports
- Opinion Leaders
Secondary Research
- Annual Reports
- White Paper
- Latest Press Release
- Industry Association
- Paid Database
- Investor Presentations

Step 4 - Data Triangulation
Involves using different sources of information in order to increase the validity of a study
These sources are likely to be stakeholders in a program - participants, other researchers, program staff, other community members, and so on.
Then we put all data in single framework & apply various statistical tools to find out the dynamic on the market.
During the analysis stage, feedback from the stakeholder groups would be compared to determine areas of agreement as well as areas of divergence


