
Key Insights
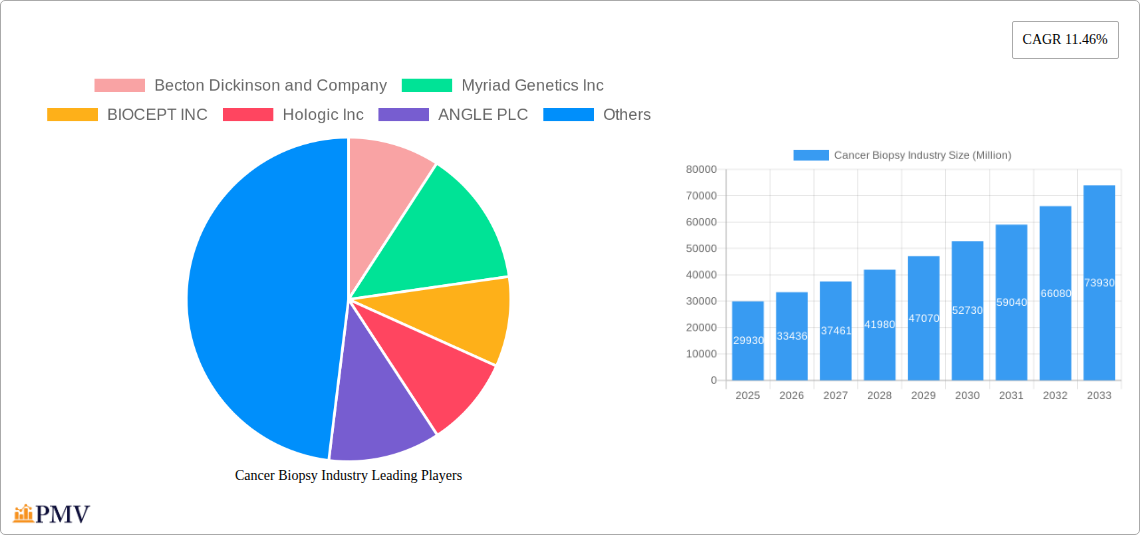
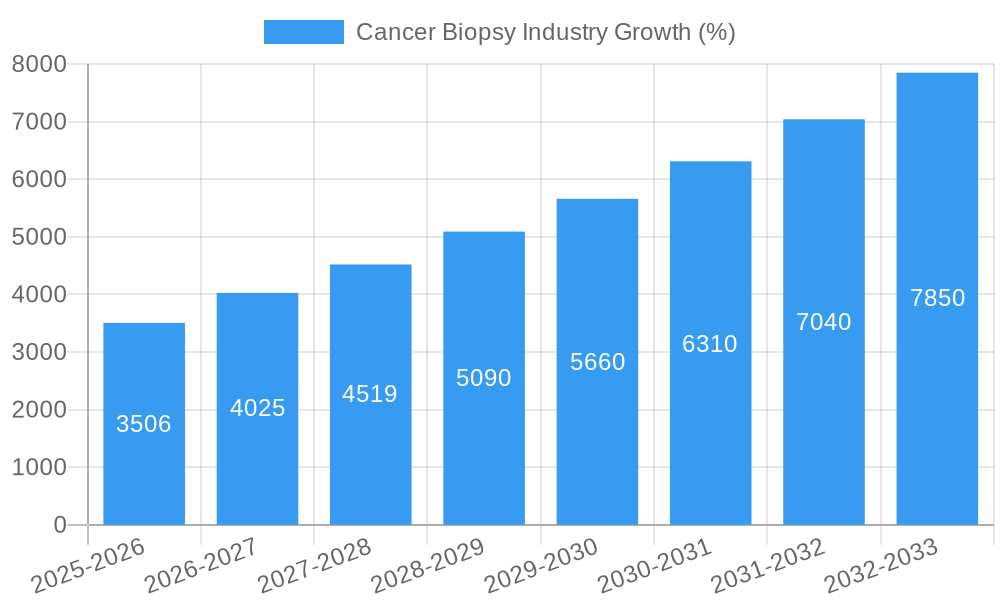
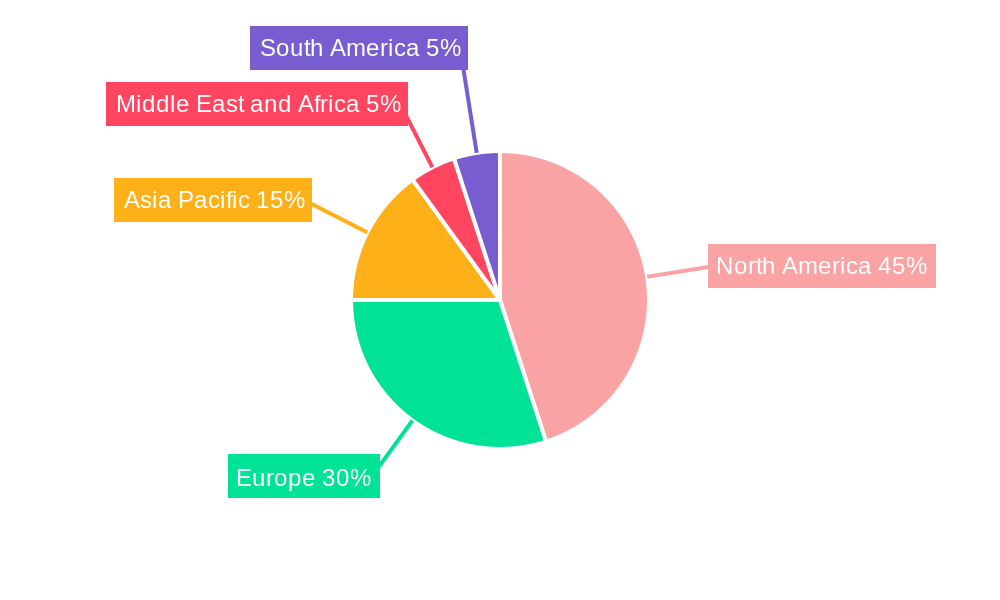
The global cancer biopsy market, valued at $29.93 billion in 2025, is projected to experience robust growth, driven by the rising incidence of cancer globally and advancements in biopsy techniques. The compound annual growth rate (CAGR) of 11.46% from 2025 to 2033 signifies a significant expansion of this market. Key drivers include the increasing prevalence of various cancer types, such as breast, colorectal, cervical, and lung cancers, necessitating accurate and minimally invasive diagnostic procedures. Technological advancements in biopsy methods, like liquid biopsy and minimally invasive surgical techniques, are further fueling market growth. The market is segmented by application (breast, colorectal, cervical, lung, and other cancers), end-user (hospitals, diagnostic laboratories, and others), product (instruments, kits and consumables, and services), and type (tissue biopsy, surgical biopsy, liquid biopsy, and others). The rise of personalized medicine and targeted therapies, requiring precise diagnostic information, is also a significant growth driver. North America and Europe currently dominate the market due to advanced healthcare infrastructure and high adoption of advanced diagnostic techniques. However, Asia-Pacific is anticipated to witness significant growth, driven by expanding healthcare expenditure and rising awareness. While regulatory hurdles and high costs associated with some advanced biopsy technologies could pose challenges, the overall market outlook remains positive, with considerable opportunities for market players.
The competitive landscape is characterized by the presence of both established players like Becton Dickinson, Hologic, and Danaher, and emerging companies focusing on innovative technologies. These companies are actively engaged in research and development to improve the accuracy, efficiency, and accessibility of biopsy procedures. Strategic collaborations, mergers and acquisitions, and the introduction of novel products are shaping the competitive dynamics. The market is expected to witness further consolidation as companies strive to expand their market share and geographic reach. The focus on developing less invasive and more patient-friendly biopsy techniques is expected to further boost market growth and improve patient outcomes. Future growth will be significantly influenced by the ongoing technological innovations, particularly in the field of liquid biopsy, which offers the potential for earlier and less invasive cancer detection.
This detailed report provides a comprehensive analysis of the global cancer biopsy industry, encompassing market size, segmentation, competitive landscape, key trends, and future growth projections from 2019 to 2033. The report leverages extensive primary and secondary research, offering invaluable insights for stakeholders across the value chain. With a base year of 2025 and a forecast period of 2025-2033, this report is an essential resource for strategic decision-making. The global market size is estimated at xx Million in 2025 and is projected to reach xx Million by 2033, exhibiting a CAGR of xx%.
Cancer Biopsy Industry Market Structure & Competitive Dynamics
The cancer biopsy market is characterized by a moderately concentrated structure with a few dominant players and several smaller, specialized companies. Key players such as Becton Dickinson and Company, Myriad Genetics Inc, and Illumina Inc, hold significant market share, driven by their extensive product portfolios and global reach. The market exhibits a dynamic competitive landscape fueled by ongoing innovation in biopsy technologies, including liquid biopsies, and the increasing adoption of minimally invasive procedures. Regulatory frameworks, particularly those governing diagnostic testing approvals, play a crucial role in shaping the market's competitive dynamics. Significant M&A activities have also impacted the market landscape, with deal values reaching several hundred Million in recent years.
- Market Concentration: Moderately concentrated, with top 5 players holding approximately xx% of the market share in 2025.
- Innovation Ecosystems: Strong R&D focus on minimally invasive techniques, advanced diagnostics (liquid biopsies), and AI-powered analysis.
- Regulatory Frameworks: Stringent regulatory approvals (e.g., FDA) significantly influence product launches and market entry.
- Product Substitutes: Limited direct substitutes, but alternative diagnostic methods (e.g., imaging) exist.
- End-User Trends: Increasing preference for minimally invasive procedures and personalized medicine drives demand.
- M&A Activities: Several significant mergers and acquisitions in the past five years, with deal values exceeding xx Million in total.
Cancer Biopsy Industry Industry Trends & Insights
The cancer biopsy market is experiencing robust growth driven by several factors. The rising global prevalence of cancer, coupled with advancements in cancer diagnostics and treatment, fuels demand for accurate and efficient biopsy procedures. Technological disruptions, such as the emergence of liquid biopsies, offer less invasive alternatives to traditional tissue biopsies, expanding market opportunities. Consumer preferences increasingly favor minimally invasive procedures, reducing patient discomfort and recovery times. The competitive landscape is characterized by ongoing innovation, strategic partnerships, and mergers and acquisitions, driving further market evolution. The market is expected to witness a considerable increase in demand due to factors like rising cancer incidence and technological advancements.
- Market Growth Drivers: Increasing cancer prevalence, technological advancements in biopsy techniques (liquid biopsies), rising demand for minimally invasive procedures, and growing adoption of personalized medicine.
- Technological Disruptions: Liquid biopsy technology is significantly impacting the market, offering less invasive and earlier cancer detection capabilities.
- Consumer Preferences: Patients increasingly prefer less invasive biopsy methods, driving demand for liquid biopsies and other minimally invasive techniques.
- Competitive Dynamics: Intense competition among established players and emerging companies, with focus on innovation and market share expansion.
Dominant Markets & Segments in Cancer Biopsy Industry
The global cancer biopsy market is geographically diverse, with North America and Europe holding significant shares. Within these regions, the United States and Germany emerge as leading national markets, driven by factors such as advanced healthcare infrastructure, high healthcare expenditure, and strong regulatory support. In terms of segments, breast cancer, colorectal cancer, and lung cancer represent major applications, accounting for a significant portion of overall market demand. Hospitals and diagnostic laboratories constitute the primary end-users, reflecting the centralized nature of cancer diagnosis and treatment. Kits and consumables, including reagents, represent a substantial proportion of market revenue, while liquid biopsies are gaining significant traction as a rapidly growing segment.
- By Application:
- Breast cancer dominates due to high incidence and screening rates.
- Colorectal cancer and lung cancer are significant segments driven by their prevalence.
- By End User:
- Hospitals and diagnostic laboratories constitute the largest market segments due to centralized cancer care.
- By Product:
- Kits and consumables represent a substantial portion of the market revenue.
- Instruments segment is experiencing growth due to technological advancements.
- By Type:
- Tissue biopsy remains dominant but liquid biopsy is exhibiting the highest growth rate.
Cancer Biopsy Industry Product Innovations
Recent years have witnessed significant advancements in cancer biopsy technologies, primarily driven by the development of liquid biopsies. These minimally invasive techniques offer advantages over traditional tissue biopsies by enabling early cancer detection, reducing invasiveness, and facilitating repeated monitoring. This innovation is transforming the cancer diagnostic landscape, paving the way for personalized medicine approaches and improved patient outcomes. Technological trends also encompass the integration of AI and machine learning for enhanced diagnostic accuracy and efficiency.
Report Segmentation & Scope
This report segments the cancer biopsy market by application (breast, colorectal, cervical, lung, other), end-user (hospitals, diagnostic laboratories, other), product (instruments, kits & consumables, services), and type (tissue, surgical, liquid, other). Growth projections, market size estimates, and competitive dynamics are provided for each segment. The report covers the historical period (2019-2024), the base year (2025), and the forecast period (2025-2033).
Key Drivers of Cancer Biopsy Industry Growth
The growth of the cancer biopsy industry is propelled by several key factors. These include the rising global cancer incidence rates, advancements in biopsy technologies (particularly liquid biopsies), increasing demand for minimally invasive procedures, the growing adoption of personalized medicine, and supportive government initiatives promoting early cancer detection. Technological advancements continue to improve the accuracy, efficiency, and accessibility of biopsy procedures.
Challenges in the Cancer Biopsy Industry Sector
The cancer biopsy industry faces challenges including stringent regulatory hurdles for new product approvals, potential supply chain disruptions impacting reagent and instrument availability, and intense competition from both established and emerging players. These factors can impact market growth and profitability, requiring strategic adaptations by industry participants. Pricing pressures and reimbursement policies also pose challenges.
Leading Players in the Cancer Biopsy Industry Market
- Becton Dickinson and Company
- Myriad Genetics Inc
- BIOCEPT INC
- Hologic Inc
- ANGLE PLC
- Danaher Corporation
- Agilent Technologies Inc
- Lucence Diagnostics Pte Ltd
- Sysmex Corporation
- MDx Health
- Illumina Inc
- Thermo Fisher Scientific
- QIAGEN
Key Developments in Cancer Biopsy Industry Sector
- August 2022: Guardant Health received US FDA approval for its Guardant360 CDx liquid biopsy test, expanding treatment options for HER2-mutant NSCLC.
- May 2022: Delfi Diagnostics presented progress on its DELFI-L101 study for lung cancer detection using a next-generation liquid biopsy platform.
Strategic Cancer Biopsy Industry Market Outlook
The cancer biopsy market is poised for continued growth, driven by technological advancements, increasing cancer prevalence, and a growing focus on early detection and personalized medicine. Strategic opportunities lie in developing innovative biopsy technologies, expanding into emerging markets, and forging strategic partnerships to broaden market access. The market presents significant potential for companies that can effectively address the evolving needs of healthcare providers and patients.
Cancer Biopsy Industry Segmentation
-
1. Product
- 1.1. Instruments
- 1.2. Kits and Consumables
- 1.3. Services
-
2. Type
- 2.1. Tissue Biopsy
- 2.2. Surgical Biopsy
- 2.3. Liquid Biopsy
- 2.4. Other Types
-
3. Application
- 3.1. Breast Cancer
- 3.2. Colorectal Cancer
- 3.3. Cervical Cancers
- 3.4. Lung Cancers
- 3.5. Other Applications
-
4. End User
- 4.1. Hospitals
- 4.2. Diagnostic Laboratories
- 4.3. Other End Users
Cancer Biopsy Industry Segmentation By Geography
-
1. North America
- 1.1. United States
- 1.2. Canada
- 1.3. Mexico
-
2. Europe
- 2.1. Germany
- 2.2. United Kingdom
- 2.3. France
- 2.4. Italy
- 2.5. Spain
- 2.6. Rest of Europe
-
3. Asia Pacific
- 3.1. China
- 3.2. Japan
- 3.3. India
- 3.4. Australia
- 3.5. South Korea
- 3.6. Rest of Asia Pacific
-
4. Middle East and Africa
- 4.1. GCC
- 4.2. South Africa
- 4.3. Rest of Middle East and Africa
-
5. South America
- 5.1. Brazil
- 5.2. Argentina
- 5.3. Rest of South America
Cancer Biopsy Industry REPORT HIGHLIGHTS
| Aspects | Details |
|---|---|
| Study Period | 2019-2033 |
| Base Year | 2024 |
| Estimated Year | 2025 |
| Forecast Period | 2025-2033 |
| Historical Period | 2019-2024 |
| Growth Rate | CAGR of 11.46% from 2019-2033 |
| Segmentation |
|
Table of Contents
- 1. Introduction
- 1.1. Research Scope
- 1.2. Market Segmentation
- 1.3. Research Methodology
- 1.4. Definitions and Assumptions
- 2. Executive Summary
- 2.1. Introduction
- 3. Market Dynamics
- 3.1. Introduction
- 3.2. Market Drivers
- 3.2.1. Rising Burden of Oncology Disorders and Increase in Adoption of Liquid Biopsies; Advancement in Technologies; Rising Awareness on Inherited Oncology Disorders and Genetic Testing
- 3.3. Market Restrains
- 3.3.1. Associated Risks with Biopsy Procedures
- 3.4. Market Trends
- 3.4.1. Breast Cancer Segment is Expected to Grow During the Forecast Period
- 4. Market Factor Analysis
- 4.1. Porters Five Forces
- 4.2. Supply/Value Chain
- 4.3. PESTEL analysis
- 4.4. Market Entropy
- 4.5. Patent/Trademark Analysis
- 5. Global Cancer Biopsy Industry Analysis, Insights and Forecast, 2019-2031
- 5.1. Market Analysis, Insights and Forecast - by Product
- 5.1.1. Instruments
- 5.1.2. Kits and Consumables
- 5.1.3. Services
- 5.2. Market Analysis, Insights and Forecast - by Type
- 5.2.1. Tissue Biopsy
- 5.2.2. Surgical Biopsy
- 5.2.3. Liquid Biopsy
- 5.2.4. Other Types
- 5.3. Market Analysis, Insights and Forecast - by Application
- 5.3.1. Breast Cancer
- 5.3.2. Colorectal Cancer
- 5.3.3. Cervical Cancers
- 5.3.4. Lung Cancers
- 5.3.5. Other Applications
- 5.4. Market Analysis, Insights and Forecast - by End User
- 5.4.1. Hospitals
- 5.4.2. Diagnostic Laboratories
- 5.4.3. Other End Users
- 5.5. Market Analysis, Insights and Forecast - by Region
- 5.5.1. North America
- 5.5.2. Europe
- 5.5.3. Asia Pacific
- 5.5.4. Middle East and Africa
- 5.5.5. South America
- 5.1. Market Analysis, Insights and Forecast - by Product
- 6. North America Cancer Biopsy Industry Analysis, Insights and Forecast, 2019-2031
- 6.1. Market Analysis, Insights and Forecast - by Product
- 6.1.1. Instruments
- 6.1.2. Kits and Consumables
- 6.1.3. Services
- 6.2. Market Analysis, Insights and Forecast - by Type
- 6.2.1. Tissue Biopsy
- 6.2.2. Surgical Biopsy
- 6.2.3. Liquid Biopsy
- 6.2.4. Other Types
- 6.3. Market Analysis, Insights and Forecast - by Application
- 6.3.1. Breast Cancer
- 6.3.2. Colorectal Cancer
- 6.3.3. Cervical Cancers
- 6.3.4. Lung Cancers
- 6.3.5. Other Applications
- 6.4. Market Analysis, Insights and Forecast - by End User
- 6.4.1. Hospitals
- 6.4.2. Diagnostic Laboratories
- 6.4.3. Other End Users
- 6.1. Market Analysis, Insights and Forecast - by Product
- 7. Europe Cancer Biopsy Industry Analysis, Insights and Forecast, 2019-2031
- 7.1. Market Analysis, Insights and Forecast - by Product
- 7.1.1. Instruments
- 7.1.2. Kits and Consumables
- 7.1.3. Services
- 7.2. Market Analysis, Insights and Forecast - by Type
- 7.2.1. Tissue Biopsy
- 7.2.2. Surgical Biopsy
- 7.2.3. Liquid Biopsy
- 7.2.4. Other Types
- 7.3. Market Analysis, Insights and Forecast - by Application
- 7.3.1. Breast Cancer
- 7.3.2. Colorectal Cancer
- 7.3.3. Cervical Cancers
- 7.3.4. Lung Cancers
- 7.3.5. Other Applications
- 7.4. Market Analysis, Insights and Forecast - by End User
- 7.4.1. Hospitals
- 7.4.2. Diagnostic Laboratories
- 7.4.3. Other End Users
- 7.1. Market Analysis, Insights and Forecast - by Product
- 8. Asia Pacific Cancer Biopsy Industry Analysis, Insights and Forecast, 2019-2031
- 8.1. Market Analysis, Insights and Forecast - by Product
- 8.1.1. Instruments
- 8.1.2. Kits and Consumables
- 8.1.3. Services
- 8.2. Market Analysis, Insights and Forecast - by Type
- 8.2.1. Tissue Biopsy
- 8.2.2. Surgical Biopsy
- 8.2.3. Liquid Biopsy
- 8.2.4. Other Types
- 8.3. Market Analysis, Insights and Forecast - by Application
- 8.3.1. Breast Cancer
- 8.3.2. Colorectal Cancer
- 8.3.3. Cervical Cancers
- 8.3.4. Lung Cancers
- 8.3.5. Other Applications
- 8.4. Market Analysis, Insights and Forecast - by End User
- 8.4.1. Hospitals
- 8.4.2. Diagnostic Laboratories
- 8.4.3. Other End Users
- 8.1. Market Analysis, Insights and Forecast - by Product
- 9. Middle East and Africa Cancer Biopsy Industry Analysis, Insights and Forecast, 2019-2031
- 9.1. Market Analysis, Insights and Forecast - by Product
- 9.1.1. Instruments
- 9.1.2. Kits and Consumables
- 9.1.3. Services
- 9.2. Market Analysis, Insights and Forecast - by Type
- 9.2.1. Tissue Biopsy
- 9.2.2. Surgical Biopsy
- 9.2.3. Liquid Biopsy
- 9.2.4. Other Types
- 9.3. Market Analysis, Insights and Forecast - by Application
- 9.3.1. Breast Cancer
- 9.3.2. Colorectal Cancer
- 9.3.3. Cervical Cancers
- 9.3.4. Lung Cancers
- 9.3.5. Other Applications
- 9.4. Market Analysis, Insights and Forecast - by End User
- 9.4.1. Hospitals
- 9.4.2. Diagnostic Laboratories
- 9.4.3. Other End Users
- 9.1. Market Analysis, Insights and Forecast - by Product
- 10. South America Cancer Biopsy Industry Analysis, Insights and Forecast, 2019-2031
- 10.1. Market Analysis, Insights and Forecast - by Product
- 10.1.1. Instruments
- 10.1.2. Kits and Consumables
- 10.1.3. Services
- 10.2. Market Analysis, Insights and Forecast - by Type
- 10.2.1. Tissue Biopsy
- 10.2.2. Surgical Biopsy
- 10.2.3. Liquid Biopsy
- 10.2.4. Other Types
- 10.3. Market Analysis, Insights and Forecast - by Application
- 10.3.1. Breast Cancer
- 10.3.2. Colorectal Cancer
- 10.3.3. Cervical Cancers
- 10.3.4. Lung Cancers
- 10.3.5. Other Applications
- 10.4. Market Analysis, Insights and Forecast - by End User
- 10.4.1. Hospitals
- 10.4.2. Diagnostic Laboratories
- 10.4.3. Other End Users
- 10.1. Market Analysis, Insights and Forecast - by Product
- 11. North America Cancer Biopsy Industry Analysis, Insights and Forecast, 2019-2031
- 11.1. Market Analysis, Insights and Forecast - By Country/Sub-region
- 11.1.1 United States
- 11.1.2 Canada
- 11.1.3 Mexico
- 12. Europe Cancer Biopsy Industry Analysis, Insights and Forecast, 2019-2031
- 12.1. Market Analysis, Insights and Forecast - By Country/Sub-region
- 12.1.1 Germany
- 12.1.2 United Kingdom
- 12.1.3 France
- 12.1.4 Italy
- 12.1.5 Spain
- 12.1.6 Rest of Europe
- 13. Asia Pacific Cancer Biopsy Industry Analysis, Insights and Forecast, 2019-2031
- 13.1. Market Analysis, Insights and Forecast - By Country/Sub-region
- 13.1.1 China
- 13.1.2 Japan
- 13.1.3 India
- 13.1.4 Australia
- 13.1.5 South Korea
- 13.1.6 Rest of Asia Pacific
- 14. Middle East and Africa Cancer Biopsy Industry Analysis, Insights and Forecast, 2019-2031
- 14.1. Market Analysis, Insights and Forecast - By Country/Sub-region
- 14.1.1 GCC
- 14.1.2 South Africa
- 14.1.3 Rest of Middle East and Africa
- 15. South America Cancer Biopsy Industry Analysis, Insights and Forecast, 2019-2031
- 15.1. Market Analysis, Insights and Forecast - By Country/Sub-region
- 15.1.1 Brazil
- 15.1.2 Argentina
- 15.1.3 Rest of South America
- 16. Competitive Analysis
- 16.1. Global Market Share Analysis 2024
- 16.2. Company Profiles
- 16.2.1 Becton Dickinson and Company
- 16.2.1.1. Overview
- 16.2.1.2. Products
- 16.2.1.3. SWOT Analysis
- 16.2.1.4. Recent Developments
- 16.2.1.5. Financials (Based on Availability)
- 16.2.2 Myriad Genetics Inc
- 16.2.2.1. Overview
- 16.2.2.2. Products
- 16.2.2.3. SWOT Analysis
- 16.2.2.4. Recent Developments
- 16.2.2.5. Financials (Based on Availability)
- 16.2.3 BIOCEPT INC
- 16.2.3.1. Overview
- 16.2.3.2. Products
- 16.2.3.3. SWOT Analysis
- 16.2.3.4. Recent Developments
- 16.2.3.5. Financials (Based on Availability)
- 16.2.4 Hologic Inc
- 16.2.4.1. Overview
- 16.2.4.2. Products
- 16.2.4.3. SWOT Analysis
- 16.2.4.4. Recent Developments
- 16.2.4.5. Financials (Based on Availability)
- 16.2.5 ANGLE PLC
- 16.2.5.1. Overview
- 16.2.5.2. Products
- 16.2.5.3. SWOT Analysis
- 16.2.5.4. Recent Developments
- 16.2.5.5. Financials (Based on Availability)
- 16.2.6 Danaher Corporation
- 16.2.6.1. Overview
- 16.2.6.2. Products
- 16.2.6.3. SWOT Analysis
- 16.2.6.4. Recent Developments
- 16.2.6.5. Financials (Based on Availability)
- 16.2.7 Agilent Technologies Inc
- 16.2.7.1. Overview
- 16.2.7.2. Products
- 16.2.7.3. SWOT Analysis
- 16.2.7.4. Recent Developments
- 16.2.7.5. Financials (Based on Availability)
- 16.2.8 Lucence Diagnostics Pte Ltd
- 16.2.8.1. Overview
- 16.2.8.2. Products
- 16.2.8.3. SWOT Analysis
- 16.2.8.4. Recent Developments
- 16.2.8.5. Financials (Based on Availability)
- 16.2.9 Sysmex Corporation
- 16.2.9.1. Overview
- 16.2.9.2. Products
- 16.2.9.3. SWOT Analysis
- 16.2.9.4. Recent Developments
- 16.2.9.5. Financials (Based on Availability)
- 16.2.10 MDx Health
- 16.2.10.1. Overview
- 16.2.10.2. Products
- 16.2.10.3. SWOT Analysis
- 16.2.10.4. Recent Developments
- 16.2.10.5. Financials (Based on Availability)
- 16.2.11 Illumina Inc
- 16.2.11.1. Overview
- 16.2.11.2. Products
- 16.2.11.3. SWOT Analysis
- 16.2.11.4. Recent Developments
- 16.2.11.5. Financials (Based on Availability)
- 16.2.12 Thermo Fisher Scientific
- 16.2.12.1. Overview
- 16.2.12.2. Products
- 16.2.12.3. SWOT Analysis
- 16.2.12.4. Recent Developments
- 16.2.12.5. Financials (Based on Availability)
- 16.2.13 QIAGEN
- 16.2.13.1. Overview
- 16.2.13.2. Products
- 16.2.13.3. SWOT Analysis
- 16.2.13.4. Recent Developments
- 16.2.13.5. Financials (Based on Availability)
- 16.2.1 Becton Dickinson and Company
List of Figures
- Figure 1: Global Cancer Biopsy Industry Revenue Breakdown (Million, %) by Region 2024 & 2032
- Figure 2: Global Cancer Biopsy Industry Volume Breakdown (K Unit, %) by Region 2024 & 2032
- Figure 3: North America Cancer Biopsy Industry Revenue (Million), by Country 2024 & 2032
- Figure 4: North America Cancer Biopsy Industry Volume (K Unit), by Country 2024 & 2032
- Figure 5: North America Cancer Biopsy Industry Revenue Share (%), by Country 2024 & 2032
- Figure 6: North America Cancer Biopsy Industry Volume Share (%), by Country 2024 & 2032
- Figure 7: Europe Cancer Biopsy Industry Revenue (Million), by Country 2024 & 2032
- Figure 8: Europe Cancer Biopsy Industry Volume (K Unit), by Country 2024 & 2032
- Figure 9: Europe Cancer Biopsy Industry Revenue Share (%), by Country 2024 & 2032
- Figure 10: Europe Cancer Biopsy Industry Volume Share (%), by Country 2024 & 2032
- Figure 11: Asia Pacific Cancer Biopsy Industry Revenue (Million), by Country 2024 & 2032
- Figure 12: Asia Pacific Cancer Biopsy Industry Volume (K Unit), by Country 2024 & 2032
- Figure 13: Asia Pacific Cancer Biopsy Industry Revenue Share (%), by Country 2024 & 2032
- Figure 14: Asia Pacific Cancer Biopsy Industry Volume Share (%), by Country 2024 & 2032
- Figure 15: Middle East and Africa Cancer Biopsy Industry Revenue (Million), by Country 2024 & 2032
- Figure 16: Middle East and Africa Cancer Biopsy Industry Volume (K Unit), by Country 2024 & 2032
- Figure 17: Middle East and Africa Cancer Biopsy Industry Revenue Share (%), by Country 2024 & 2032
- Figure 18: Middle East and Africa Cancer Biopsy Industry Volume Share (%), by Country 2024 & 2032
- Figure 19: South America Cancer Biopsy Industry Revenue (Million), by Country 2024 & 2032
- Figure 20: South America Cancer Biopsy Industry Volume (K Unit), by Country 2024 & 2032
- Figure 21: South America Cancer Biopsy Industry Revenue Share (%), by Country 2024 & 2032
- Figure 22: South America Cancer Biopsy Industry Volume Share (%), by Country 2024 & 2032
- Figure 23: North America Cancer Biopsy Industry Revenue (Million), by Product 2024 & 2032
- Figure 24: North America Cancer Biopsy Industry Volume (K Unit), by Product 2024 & 2032
- Figure 25: North America Cancer Biopsy Industry Revenue Share (%), by Product 2024 & 2032
- Figure 26: North America Cancer Biopsy Industry Volume Share (%), by Product 2024 & 2032
- Figure 27: North America Cancer Biopsy Industry Revenue (Million), by Type 2024 & 2032
- Figure 28: North America Cancer Biopsy Industry Volume (K Unit), by Type 2024 & 2032
- Figure 29: North America Cancer Biopsy Industry Revenue Share (%), by Type 2024 & 2032
- Figure 30: North America Cancer Biopsy Industry Volume Share (%), by Type 2024 & 2032
- Figure 31: North America Cancer Biopsy Industry Revenue (Million), by Application 2024 & 2032
- Figure 32: North America Cancer Biopsy Industry Volume (K Unit), by Application 2024 & 2032
- Figure 33: North America Cancer Biopsy Industry Revenue Share (%), by Application 2024 & 2032
- Figure 34: North America Cancer Biopsy Industry Volume Share (%), by Application 2024 & 2032
- Figure 35: North America Cancer Biopsy Industry Revenue (Million), by End User 2024 & 2032
- Figure 36: North America Cancer Biopsy Industry Volume (K Unit), by End User 2024 & 2032
- Figure 37: North America Cancer Biopsy Industry Revenue Share (%), by End User 2024 & 2032
- Figure 38: North America Cancer Biopsy Industry Volume Share (%), by End User 2024 & 2032
- Figure 39: North America Cancer Biopsy Industry Revenue (Million), by Country 2024 & 2032
- Figure 40: North America Cancer Biopsy Industry Volume (K Unit), by Country 2024 & 2032
- Figure 41: North America Cancer Biopsy Industry Revenue Share (%), by Country 2024 & 2032
- Figure 42: North America Cancer Biopsy Industry Volume Share (%), by Country 2024 & 2032
- Figure 43: Europe Cancer Biopsy Industry Revenue (Million), by Product 2024 & 2032
- Figure 44: Europe Cancer Biopsy Industry Volume (K Unit), by Product 2024 & 2032
- Figure 45: Europe Cancer Biopsy Industry Revenue Share (%), by Product 2024 & 2032
- Figure 46: Europe Cancer Biopsy Industry Volume Share (%), by Product 2024 & 2032
- Figure 47: Europe Cancer Biopsy Industry Revenue (Million), by Type 2024 & 2032
- Figure 48: Europe Cancer Biopsy Industry Volume (K Unit), by Type 2024 & 2032
- Figure 49: Europe Cancer Biopsy Industry Revenue Share (%), by Type 2024 & 2032
- Figure 50: Europe Cancer Biopsy Industry Volume Share (%), by Type 2024 & 2032
- Figure 51: Europe Cancer Biopsy Industry Revenue (Million), by Application 2024 & 2032
- Figure 52: Europe Cancer Biopsy Industry Volume (K Unit), by Application 2024 & 2032
- Figure 53: Europe Cancer Biopsy Industry Revenue Share (%), by Application 2024 & 2032
- Figure 54: Europe Cancer Biopsy Industry Volume Share (%), by Application 2024 & 2032
- Figure 55: Europe Cancer Biopsy Industry Revenue (Million), by End User 2024 & 2032
- Figure 56: Europe Cancer Biopsy Industry Volume (K Unit), by End User 2024 & 2032
- Figure 57: Europe Cancer Biopsy Industry Revenue Share (%), by End User 2024 & 2032
- Figure 58: Europe Cancer Biopsy Industry Volume Share (%), by End User 2024 & 2032
- Figure 59: Europe Cancer Biopsy Industry Revenue (Million), by Country 2024 & 2032
- Figure 60: Europe Cancer Biopsy Industry Volume (K Unit), by Country 2024 & 2032
- Figure 61: Europe Cancer Biopsy Industry Revenue Share (%), by Country 2024 & 2032
- Figure 62: Europe Cancer Biopsy Industry Volume Share (%), by Country 2024 & 2032
- Figure 63: Asia Pacific Cancer Biopsy Industry Revenue (Million), by Product 2024 & 2032
- Figure 64: Asia Pacific Cancer Biopsy Industry Volume (K Unit), by Product 2024 & 2032
- Figure 65: Asia Pacific Cancer Biopsy Industry Revenue Share (%), by Product 2024 & 2032
- Figure 66: Asia Pacific Cancer Biopsy Industry Volume Share (%), by Product 2024 & 2032
- Figure 67: Asia Pacific Cancer Biopsy Industry Revenue (Million), by Type 2024 & 2032
- Figure 68: Asia Pacific Cancer Biopsy Industry Volume (K Unit), by Type 2024 & 2032
- Figure 69: Asia Pacific Cancer Biopsy Industry Revenue Share (%), by Type 2024 & 2032
- Figure 70: Asia Pacific Cancer Biopsy Industry Volume Share (%), by Type 2024 & 2032
- Figure 71: Asia Pacific Cancer Biopsy Industry Revenue (Million), by Application 2024 & 2032
- Figure 72: Asia Pacific Cancer Biopsy Industry Volume (K Unit), by Application 2024 & 2032
- Figure 73: Asia Pacific Cancer Biopsy Industry Revenue Share (%), by Application 2024 & 2032
- Figure 74: Asia Pacific Cancer Biopsy Industry Volume Share (%), by Application 2024 & 2032
- Figure 75: Asia Pacific Cancer Biopsy Industry Revenue (Million), by End User 2024 & 2032
- Figure 76: Asia Pacific Cancer Biopsy Industry Volume (K Unit), by End User 2024 & 2032
- Figure 77: Asia Pacific Cancer Biopsy Industry Revenue Share (%), by End User 2024 & 2032
- Figure 78: Asia Pacific Cancer Biopsy Industry Volume Share (%), by End User 2024 & 2032
- Figure 79: Asia Pacific Cancer Biopsy Industry Revenue (Million), by Country 2024 & 2032
- Figure 80: Asia Pacific Cancer Biopsy Industry Volume (K Unit), by Country 2024 & 2032
- Figure 81: Asia Pacific Cancer Biopsy Industry Revenue Share (%), by Country 2024 & 2032
- Figure 82: Asia Pacific Cancer Biopsy Industry Volume Share (%), by Country 2024 & 2032
- Figure 83: Middle East and Africa Cancer Biopsy Industry Revenue (Million), by Product 2024 & 2032
- Figure 84: Middle East and Africa Cancer Biopsy Industry Volume (K Unit), by Product 2024 & 2032
- Figure 85: Middle East and Africa Cancer Biopsy Industry Revenue Share (%), by Product 2024 & 2032
- Figure 86: Middle East and Africa Cancer Biopsy Industry Volume Share (%), by Product 2024 & 2032
- Figure 87: Middle East and Africa Cancer Biopsy Industry Revenue (Million), by Type 2024 & 2032
- Figure 88: Middle East and Africa Cancer Biopsy Industry Volume (K Unit), by Type 2024 & 2032
- Figure 89: Middle East and Africa Cancer Biopsy Industry Revenue Share (%), by Type 2024 & 2032
- Figure 90: Middle East and Africa Cancer Biopsy Industry Volume Share (%), by Type 2024 & 2032
- Figure 91: Middle East and Africa Cancer Biopsy Industry Revenue (Million), by Application 2024 & 2032
- Figure 92: Middle East and Africa Cancer Biopsy Industry Volume (K Unit), by Application 2024 & 2032
- Figure 93: Middle East and Africa Cancer Biopsy Industry Revenue Share (%), by Application 2024 & 2032
- Figure 94: Middle East and Africa Cancer Biopsy Industry Volume Share (%), by Application 2024 & 2032
- Figure 95: Middle East and Africa Cancer Biopsy Industry Revenue (Million), by End User 2024 & 2032
- Figure 96: Middle East and Africa Cancer Biopsy Industry Volume (K Unit), by End User 2024 & 2032
- Figure 97: Middle East and Africa Cancer Biopsy Industry Revenue Share (%), by End User 2024 & 2032
- Figure 98: Middle East and Africa Cancer Biopsy Industry Volume Share (%), by End User 2024 & 2032
- Figure 99: Middle East and Africa Cancer Biopsy Industry Revenue (Million), by Country 2024 & 2032
- Figure 100: Middle East and Africa Cancer Biopsy Industry Volume (K Unit), by Country 2024 & 2032
- Figure 101: Middle East and Africa Cancer Biopsy Industry Revenue Share (%), by Country 2024 & 2032
- Figure 102: Middle East and Africa Cancer Biopsy Industry Volume Share (%), by Country 2024 & 2032
- Figure 103: South America Cancer Biopsy Industry Revenue (Million), by Product 2024 & 2032
- Figure 104: South America Cancer Biopsy Industry Volume (K Unit), by Product 2024 & 2032
- Figure 105: South America Cancer Biopsy Industry Revenue Share (%), by Product 2024 & 2032
- Figure 106: South America Cancer Biopsy Industry Volume Share (%), by Product 2024 & 2032
- Figure 107: South America Cancer Biopsy Industry Revenue (Million), by Type 2024 & 2032
- Figure 108: South America Cancer Biopsy Industry Volume (K Unit), by Type 2024 & 2032
- Figure 109: South America Cancer Biopsy Industry Revenue Share (%), by Type 2024 & 2032
- Figure 110: South America Cancer Biopsy Industry Volume Share (%), by Type 2024 & 2032
- Figure 111: South America Cancer Biopsy Industry Revenue (Million), by Application 2024 & 2032
- Figure 112: South America Cancer Biopsy Industry Volume (K Unit), by Application 2024 & 2032
- Figure 113: South America Cancer Biopsy Industry Revenue Share (%), by Application 2024 & 2032
- Figure 114: South America Cancer Biopsy Industry Volume Share (%), by Application 2024 & 2032
- Figure 115: South America Cancer Biopsy Industry Revenue (Million), by End User 2024 & 2032
- Figure 116: South America Cancer Biopsy Industry Volume (K Unit), by End User 2024 & 2032
- Figure 117: South America Cancer Biopsy Industry Revenue Share (%), by End User 2024 & 2032
- Figure 118: South America Cancer Biopsy Industry Volume Share (%), by End User 2024 & 2032
- Figure 119: South America Cancer Biopsy Industry Revenue (Million), by Country 2024 & 2032
- Figure 120: South America Cancer Biopsy Industry Volume (K Unit), by Country 2024 & 2032
- Figure 121: South America Cancer Biopsy Industry Revenue Share (%), by Country 2024 & 2032
- Figure 122: South America Cancer Biopsy Industry Volume Share (%), by Country 2024 & 2032
List of Tables
- Table 1: Global Cancer Biopsy Industry Revenue Million Forecast, by Region 2019 & 2032
- Table 2: Global Cancer Biopsy Industry Volume K Unit Forecast, by Region 2019 & 2032
- Table 3: Global Cancer Biopsy Industry Revenue Million Forecast, by Product 2019 & 2032
- Table 4: Global Cancer Biopsy Industry Volume K Unit Forecast, by Product 2019 & 2032
- Table 5: Global Cancer Biopsy Industry Revenue Million Forecast, by Type 2019 & 2032
- Table 6: Global Cancer Biopsy Industry Volume K Unit Forecast, by Type 2019 & 2032
- Table 7: Global Cancer Biopsy Industry Revenue Million Forecast, by Application 2019 & 2032
- Table 8: Global Cancer Biopsy Industry Volume K Unit Forecast, by Application 2019 & 2032
- Table 9: Global Cancer Biopsy Industry Revenue Million Forecast, by End User 2019 & 2032
- Table 10: Global Cancer Biopsy Industry Volume K Unit Forecast, by End User 2019 & 2032
- Table 11: Global Cancer Biopsy Industry Revenue Million Forecast, by Region 2019 & 2032
- Table 12: Global Cancer Biopsy Industry Volume K Unit Forecast, by Region 2019 & 2032
- Table 13: Global Cancer Biopsy Industry Revenue Million Forecast, by Country 2019 & 2032
- Table 14: Global Cancer Biopsy Industry Volume K Unit Forecast, by Country 2019 & 2032
- Table 15: United States Cancer Biopsy Industry Revenue (Million) Forecast, by Application 2019 & 2032
- Table 16: United States Cancer Biopsy Industry Volume (K Unit) Forecast, by Application 2019 & 2032
- Table 17: Canada Cancer Biopsy Industry Revenue (Million) Forecast, by Application 2019 & 2032
- Table 18: Canada Cancer Biopsy Industry Volume (K Unit) Forecast, by Application 2019 & 2032
- Table 19: Mexico Cancer Biopsy Industry Revenue (Million) Forecast, by Application 2019 & 2032
- Table 20: Mexico Cancer Biopsy Industry Volume (K Unit) Forecast, by Application 2019 & 2032
- Table 21: Global Cancer Biopsy Industry Revenue Million Forecast, by Country 2019 & 2032
- Table 22: Global Cancer Biopsy Industry Volume K Unit Forecast, by Country 2019 & 2032
- Table 23: Germany Cancer Biopsy Industry Revenue (Million) Forecast, by Application 2019 & 2032
- Table 24: Germany Cancer Biopsy Industry Volume (K Unit) Forecast, by Application 2019 & 2032
- Table 25: United Kingdom Cancer Biopsy Industry Revenue (Million) Forecast, by Application 2019 & 2032
- Table 26: United Kingdom Cancer Biopsy Industry Volume (K Unit) Forecast, by Application 2019 & 2032
- Table 27: France Cancer Biopsy Industry Revenue (Million) Forecast, by Application 2019 & 2032
- Table 28: France Cancer Biopsy Industry Volume (K Unit) Forecast, by Application 2019 & 2032
- Table 29: Italy Cancer Biopsy Industry Revenue (Million) Forecast, by Application 2019 & 2032
- Table 30: Italy Cancer Biopsy Industry Volume (K Unit) Forecast, by Application 2019 & 2032
- Table 31: Spain Cancer Biopsy Industry Revenue (Million) Forecast, by Application 2019 & 2032
- Table 32: Spain Cancer Biopsy Industry Volume (K Unit) Forecast, by Application 2019 & 2032
- Table 33: Rest of Europe Cancer Biopsy Industry Revenue (Million) Forecast, by Application 2019 & 2032
- Table 34: Rest of Europe Cancer Biopsy Industry Volume (K Unit) Forecast, by Application 2019 & 2032
- Table 35: Global Cancer Biopsy Industry Revenue Million Forecast, by Country 2019 & 2032
- Table 36: Global Cancer Biopsy Industry Volume K Unit Forecast, by Country 2019 & 2032
- Table 37: China Cancer Biopsy Industry Revenue (Million) Forecast, by Application 2019 & 2032
- Table 38: China Cancer Biopsy Industry Volume (K Unit) Forecast, by Application 2019 & 2032
- Table 39: Japan Cancer Biopsy Industry Revenue (Million) Forecast, by Application 2019 & 2032
- Table 40: Japan Cancer Biopsy Industry Volume (K Unit) Forecast, by Application 2019 & 2032
- Table 41: India Cancer Biopsy Industry Revenue (Million) Forecast, by Application 2019 & 2032
- Table 42: India Cancer Biopsy Industry Volume (K Unit) Forecast, by Application 2019 & 2032
- Table 43: Australia Cancer Biopsy Industry Revenue (Million) Forecast, by Application 2019 & 2032
- Table 44: Australia Cancer Biopsy Industry Volume (K Unit) Forecast, by Application 2019 & 2032
- Table 45: South Korea Cancer Biopsy Industry Revenue (Million) Forecast, by Application 2019 & 2032
- Table 46: South Korea Cancer Biopsy Industry Volume (K Unit) Forecast, by Application 2019 & 2032
- Table 47: Rest of Asia Pacific Cancer Biopsy Industry Revenue (Million) Forecast, by Application 2019 & 2032
- Table 48: Rest of Asia Pacific Cancer Biopsy Industry Volume (K Unit) Forecast, by Application 2019 & 2032
- Table 49: Global Cancer Biopsy Industry Revenue Million Forecast, by Country 2019 & 2032
- Table 50: Global Cancer Biopsy Industry Volume K Unit Forecast, by Country 2019 & 2032
- Table 51: GCC Cancer Biopsy Industry Revenue (Million) Forecast, by Application 2019 & 2032
- Table 52: GCC Cancer Biopsy Industry Volume (K Unit) Forecast, by Application 2019 & 2032
- Table 53: South Africa Cancer Biopsy Industry Revenue (Million) Forecast, by Application 2019 & 2032
- Table 54: South Africa Cancer Biopsy Industry Volume (K Unit) Forecast, by Application 2019 & 2032
- Table 55: Rest of Middle East and Africa Cancer Biopsy Industry Revenue (Million) Forecast, by Application 2019 & 2032
- Table 56: Rest of Middle East and Africa Cancer Biopsy Industry Volume (K Unit) Forecast, by Application 2019 & 2032
- Table 57: Global Cancer Biopsy Industry Revenue Million Forecast, by Country 2019 & 2032
- Table 58: Global Cancer Biopsy Industry Volume K Unit Forecast, by Country 2019 & 2032
- Table 59: Brazil Cancer Biopsy Industry Revenue (Million) Forecast, by Application 2019 & 2032
- Table 60: Brazil Cancer Biopsy Industry Volume (K Unit) Forecast, by Application 2019 & 2032
- Table 61: Argentina Cancer Biopsy Industry Revenue (Million) Forecast, by Application 2019 & 2032
- Table 62: Argentina Cancer Biopsy Industry Volume (K Unit) Forecast, by Application 2019 & 2032
- Table 63: Rest of South America Cancer Biopsy Industry Revenue (Million) Forecast, by Application 2019 & 2032
- Table 64: Rest of South America Cancer Biopsy Industry Volume (K Unit) Forecast, by Application 2019 & 2032
- Table 65: Global Cancer Biopsy Industry Revenue Million Forecast, by Product 2019 & 2032
- Table 66: Global Cancer Biopsy Industry Volume K Unit Forecast, by Product 2019 & 2032
- Table 67: Global Cancer Biopsy Industry Revenue Million Forecast, by Type 2019 & 2032
- Table 68: Global Cancer Biopsy Industry Volume K Unit Forecast, by Type 2019 & 2032
- Table 69: Global Cancer Biopsy Industry Revenue Million Forecast, by Application 2019 & 2032
- Table 70: Global Cancer Biopsy Industry Volume K Unit Forecast, by Application 2019 & 2032
- Table 71: Global Cancer Biopsy Industry Revenue Million Forecast, by End User 2019 & 2032
- Table 72: Global Cancer Biopsy Industry Volume K Unit Forecast, by End User 2019 & 2032
- Table 73: Global Cancer Biopsy Industry Revenue Million Forecast, by Country 2019 & 2032
- Table 74: Global Cancer Biopsy Industry Volume K Unit Forecast, by Country 2019 & 2032
- Table 75: United States Cancer Biopsy Industry Revenue (Million) Forecast, by Application 2019 & 2032
- Table 76: United States Cancer Biopsy Industry Volume (K Unit) Forecast, by Application 2019 & 2032
- Table 77: Canada Cancer Biopsy Industry Revenue (Million) Forecast, by Application 2019 & 2032
- Table 78: Canada Cancer Biopsy Industry Volume (K Unit) Forecast, by Application 2019 & 2032
- Table 79: Mexico Cancer Biopsy Industry Revenue (Million) Forecast, by Application 2019 & 2032
- Table 80: Mexico Cancer Biopsy Industry Volume (K Unit) Forecast, by Application 2019 & 2032
- Table 81: Global Cancer Biopsy Industry Revenue Million Forecast, by Product 2019 & 2032
- Table 82: Global Cancer Biopsy Industry Volume K Unit Forecast, by Product 2019 & 2032
- Table 83: Global Cancer Biopsy Industry Revenue Million Forecast, by Type 2019 & 2032
- Table 84: Global Cancer Biopsy Industry Volume K Unit Forecast, by Type 2019 & 2032
- Table 85: Global Cancer Biopsy Industry Revenue Million Forecast, by Application 2019 & 2032
- Table 86: Global Cancer Biopsy Industry Volume K Unit Forecast, by Application 2019 & 2032
- Table 87: Global Cancer Biopsy Industry Revenue Million Forecast, by End User 2019 & 2032
- Table 88: Global Cancer Biopsy Industry Volume K Unit Forecast, by End User 2019 & 2032
- Table 89: Global Cancer Biopsy Industry Revenue Million Forecast, by Country 2019 & 2032
- Table 90: Global Cancer Biopsy Industry Volume K Unit Forecast, by Country 2019 & 2032
- Table 91: Germany Cancer Biopsy Industry Revenue (Million) Forecast, by Application 2019 & 2032
- Table 92: Germany Cancer Biopsy Industry Volume (K Unit) Forecast, by Application 2019 & 2032
- Table 93: United Kingdom Cancer Biopsy Industry Revenue (Million) Forecast, by Application 2019 & 2032
- Table 94: United Kingdom Cancer Biopsy Industry Volume (K Unit) Forecast, by Application 2019 & 2032
- Table 95: France Cancer Biopsy Industry Revenue (Million) Forecast, by Application 2019 & 2032
- Table 96: France Cancer Biopsy Industry Volume (K Unit) Forecast, by Application 2019 & 2032
- Table 97: Italy Cancer Biopsy Industry Revenue (Million) Forecast, by Application 2019 & 2032
- Table 98: Italy Cancer Biopsy Industry Volume (K Unit) Forecast, by Application 2019 & 2032
- Table 99: Spain Cancer Biopsy Industry Revenue (Million) Forecast, by Application 2019 & 2032
- Table 100: Spain Cancer Biopsy Industry Volume (K Unit) Forecast, by Application 2019 & 2032
- Table 101: Rest of Europe Cancer Biopsy Industry Revenue (Million) Forecast, by Application 2019 & 2032
- Table 102: Rest of Europe Cancer Biopsy Industry Volume (K Unit) Forecast, by Application 2019 & 2032
- Table 103: Global Cancer Biopsy Industry Revenue Million Forecast, by Product 2019 & 2032
- Table 104: Global Cancer Biopsy Industry Volume K Unit Forecast, by Product 2019 & 2032
- Table 105: Global Cancer Biopsy Industry Revenue Million Forecast, by Type 2019 & 2032
- Table 106: Global Cancer Biopsy Industry Volume K Unit Forecast, by Type 2019 & 2032
- Table 107: Global Cancer Biopsy Industry Revenue Million Forecast, by Application 2019 & 2032
- Table 108: Global Cancer Biopsy Industry Volume K Unit Forecast, by Application 2019 & 2032
- Table 109: Global Cancer Biopsy Industry Revenue Million Forecast, by End User 2019 & 2032
- Table 110: Global Cancer Biopsy Industry Volume K Unit Forecast, by End User 2019 & 2032
- Table 111: Global Cancer Biopsy Industry Revenue Million Forecast, by Country 2019 & 2032
- Table 112: Global Cancer Biopsy Industry Volume K Unit Forecast, by Country 2019 & 2032
- Table 113: China Cancer Biopsy Industry Revenue (Million) Forecast, by Application 2019 & 2032
- Table 114: China Cancer Biopsy Industry Volume (K Unit) Forecast, by Application 2019 & 2032
- Table 115: Japan Cancer Biopsy Industry Revenue (Million) Forecast, by Application 2019 & 2032
- Table 116: Japan Cancer Biopsy Industry Volume (K Unit) Forecast, by Application 2019 & 2032
- Table 117: India Cancer Biopsy Industry Revenue (Million) Forecast, by Application 2019 & 2032
- Table 118: India Cancer Biopsy Industry Volume (K Unit) Forecast, by Application 2019 & 2032
- Table 119: Australia Cancer Biopsy Industry Revenue (Million) Forecast, by Application 2019 & 2032
- Table 120: Australia Cancer Biopsy Industry Volume (K Unit) Forecast, by Application 2019 & 2032
- Table 121: South Korea Cancer Biopsy Industry Revenue (Million) Forecast, by Application 2019 & 2032
- Table 122: South Korea Cancer Biopsy Industry Volume (K Unit) Forecast, by Application 2019 & 2032
- Table 123: Rest of Asia Pacific Cancer Biopsy Industry Revenue (Million) Forecast, by Application 2019 & 2032
- Table 124: Rest of Asia Pacific Cancer Biopsy Industry Volume (K Unit) Forecast, by Application 2019 & 2032
- Table 125: Global Cancer Biopsy Industry Revenue Million Forecast, by Product 2019 & 2032
- Table 126: Global Cancer Biopsy Industry Volume K Unit Forecast, by Product 2019 & 2032
- Table 127: Global Cancer Biopsy Industry Revenue Million Forecast, by Type 2019 & 2032
- Table 128: Global Cancer Biopsy Industry Volume K Unit Forecast, by Type 2019 & 2032
- Table 129: Global Cancer Biopsy Industry Revenue Million Forecast, by Application 2019 & 2032
- Table 130: Global Cancer Biopsy Industry Volume K Unit Forecast, by Application 2019 & 2032
- Table 131: Global Cancer Biopsy Industry Revenue Million Forecast, by End User 2019 & 2032
- Table 132: Global Cancer Biopsy Industry Volume K Unit Forecast, by End User 2019 & 2032
- Table 133: Global Cancer Biopsy Industry Revenue Million Forecast, by Country 2019 & 2032
- Table 134: Global Cancer Biopsy Industry Volume K Unit Forecast, by Country 2019 & 2032
- Table 135: GCC Cancer Biopsy Industry Revenue (Million) Forecast, by Application 2019 & 2032
- Table 136: GCC Cancer Biopsy Industry Volume (K Unit) Forecast, by Application 2019 & 2032
- Table 137: South Africa Cancer Biopsy Industry Revenue (Million) Forecast, by Application 2019 & 2032
- Table 138: South Africa Cancer Biopsy Industry Volume (K Unit) Forecast, by Application 2019 & 2032
- Table 139: Rest of Middle East and Africa Cancer Biopsy Industry Revenue (Million) Forecast, by Application 2019 & 2032
- Table 140: Rest of Middle East and Africa Cancer Biopsy Industry Volume (K Unit) Forecast, by Application 2019 & 2032
- Table 141: Global Cancer Biopsy Industry Revenue Million Forecast, by Product 2019 & 2032
- Table 142: Global Cancer Biopsy Industry Volume K Unit Forecast, by Product 2019 & 2032
- Table 143: Global Cancer Biopsy Industry Revenue Million Forecast, by Type 2019 & 2032
- Table 144: Global Cancer Biopsy Industry Volume K Unit Forecast, by Type 2019 & 2032
- Table 145: Global Cancer Biopsy Industry Revenue Million Forecast, by Application 2019 & 2032
- Table 146: Global Cancer Biopsy Industry Volume K Unit Forecast, by Application 2019 & 2032
- Table 147: Global Cancer Biopsy Industry Revenue Million Forecast, by End User 2019 & 2032
- Table 148: Global Cancer Biopsy Industry Volume K Unit Forecast, by End User 2019 & 2032
- Table 149: Global Cancer Biopsy Industry Revenue Million Forecast, by Country 2019 & 2032
- Table 150: Global Cancer Biopsy Industry Volume K Unit Forecast, by Country 2019 & 2032
- Table 151: Brazil Cancer Biopsy Industry Revenue (Million) Forecast, by Application 2019 & 2032
- Table 152: Brazil Cancer Biopsy Industry Volume (K Unit) Forecast, by Application 2019 & 2032
- Table 153: Argentina Cancer Biopsy Industry Revenue (Million) Forecast, by Application 2019 & 2032
- Table 154: Argentina Cancer Biopsy Industry Volume (K Unit) Forecast, by Application 2019 & 2032
- Table 155: Rest of South America Cancer Biopsy Industry Revenue (Million) Forecast, by Application 2019 & 2032
- Table 156: Rest of South America Cancer Biopsy Industry Volume (K Unit) Forecast, by Application 2019 & 2032
Frequently Asked Questions
1. What is the projected Compound Annual Growth Rate (CAGR) of the Cancer Biopsy Industry?
The projected CAGR is approximately 11.46%.
2. Which companies are prominent players in the Cancer Biopsy Industry?
Key companies in the market include Becton Dickinson and Company, Myriad Genetics Inc, BIOCEPT INC, Hologic Inc, ANGLE PLC, Danaher Corporation, Agilent Technologies Inc, Lucence Diagnostics Pte Ltd, Sysmex Corporation, MDx Health, Illumina Inc, Thermo Fisher Scientific, QIAGEN.
3. What are the main segments of the Cancer Biopsy Industry?
The market segments include Product, Type, Application, End User.
4. Can you provide details about the market size?
The market size is estimated to be USD 29.93 Million as of 2022.
5. What are some drivers contributing to market growth?
Rising Burden of Oncology Disorders and Increase in Adoption of Liquid Biopsies; Advancement in Technologies; Rising Awareness on Inherited Oncology Disorders and Genetic Testing.
6. What are the notable trends driving market growth?
Breast Cancer Segment is Expected to Grow During the Forecast Period.
7. Are there any restraints impacting market growth?
Associated Risks with Biopsy Procedures.
8. Can you provide examples of recent developments in the market?
In August 2022, Guardant Health gained US FDA approval for its Guardant360 CDx liquid biopsy test as a companion diagnostic (CDx) to choose patients with unresectable or metastatic HER2-mutant non-small cell lung cancer (NSCLC) with tumors that have activating HER2 (ERBB2) mutations for treatment with ENHERTU (fam-trastuzumab deruxtecan-nxki).
9. What pricing options are available for accessing the report?
Pricing options include single-user, multi-user, and enterprise licenses priced at USD 4750, USD 5250, and USD 8750 respectively.
10. Is the market size provided in terms of value or volume?
The market size is provided in terms of value, measured in Million and volume, measured in K Unit.
11. Are there any specific market keywords associated with the report?
Yes, the market keyword associated with the report is "Cancer Biopsy Industry," which aids in identifying and referencing the specific market segment covered.
12. How do I determine which pricing option suits my needs best?
The pricing options vary based on user requirements and access needs. Individual users may opt for single-user licenses, while businesses requiring broader access may choose multi-user or enterprise licenses for cost-effective access to the report.
13. Are there any additional resources or data provided in the Cancer Biopsy Industry report?
While the report offers comprehensive insights, it's advisable to review the specific contents or supplementary materials provided to ascertain if additional resources or data are available.
14. How can I stay updated on further developments or reports in the Cancer Biopsy Industry?
To stay informed about further developments, trends, and reports in the Cancer Biopsy Industry, consider subscribing to industry newsletters, following relevant companies and organizations, or regularly checking reputable industry news sources and publications.
Methodology
Step 1 - Identification of Relevant Samples Size from Population Database


Step 2 - Approaches for Defining Global Market Size (Value, Volume* & Price*)

Note*: In applicable scenarios
Step 3 - Data Sources
Primary Research
- Web Analytics
- Survey Reports
- Research Institute
- Latest Research Reports
- Opinion Leaders
Secondary Research
- Annual Reports
- White Paper
- Latest Press Release
- Industry Association
- Paid Database
- Investor Presentations

Step 4 - Data Triangulation
Involves using different sources of information in order to increase the validity of a study
These sources are likely to be stakeholders in a program - participants, other researchers, program staff, other community members, and so on.
Then we put all data in single framework & apply various statistical tools to find out the dynamic on the market.
During the analysis stage, feedback from the stakeholder groups would be compared to determine areas of agreement as well as areas of divergence


